Estimated zip code population in 2022: 3,007 Zip code population in 2010: 3,241 Zip code population in 2000: 3,245
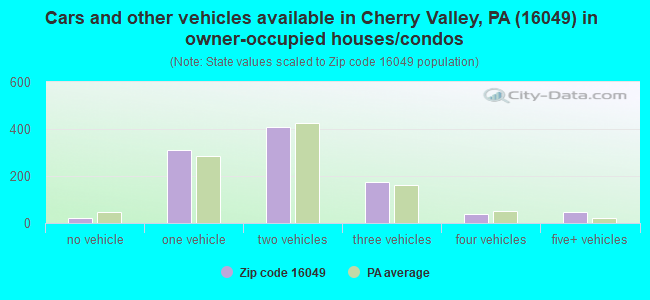
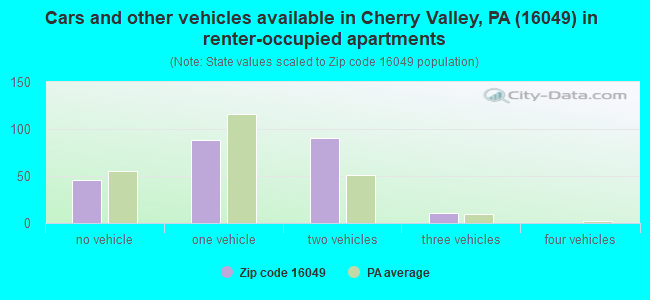
Houses and condos: 1,611 Renter-occupied apartments: 235
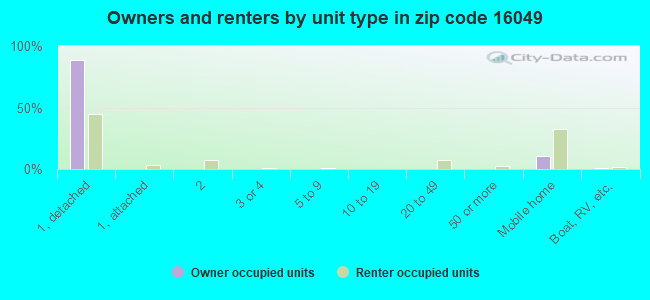
% of renters here:
19%
State:
31%
March 2022 cost of living index in zip code 16049: 91.0 (less than average, U.S. average is 100)
Land area: 92.3 sq. mi. Water area: 2.2 sq. mi.
Population density: 33 people per square mile
(very low).
OSM Map
General Map
Google Map
MSN Map
OSM Map
General Map
Google Map
MSN Map
OSM Map
General Map
Google Map
MSN Map
OSM Map
General Map
Google Map
MSN Map
Please wait while loading the map...
Real estate property taxes paid for housing units in 2022:
This zip code:
0.9% ($1,325)
Pennsylvania:
1.3% ($3,094)
Median real estate property taxes paid for housing units with mortgages in 2022: $1,639 (0.9%) Median real estate property taxes paid for housing units with no mortgage in 2022: $1,119 (0.9%)
Business Search- 14 Million verified businesses
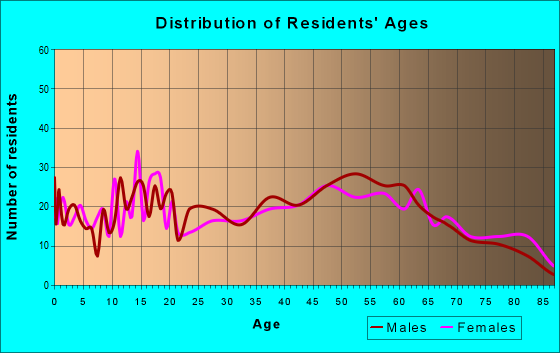
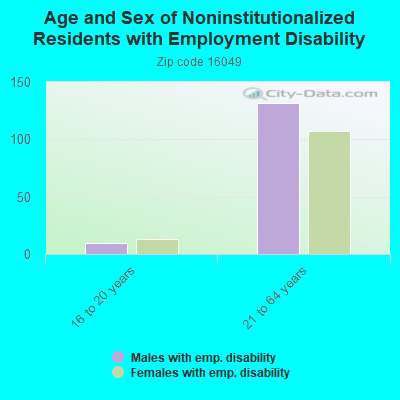
Males: 1,577
(52.5%)
Females: 1,429
(47.5%)
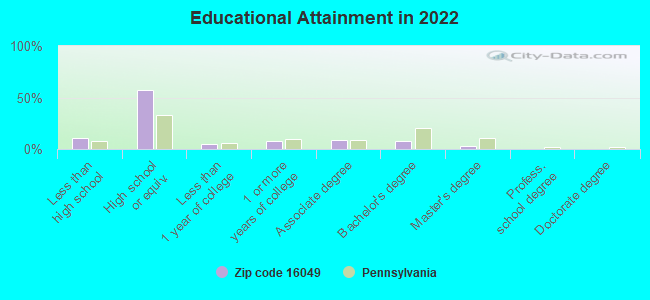
For population 25 years and over in 16049:
High school or higher: 87.4%
Bachelor's degree or higher: 11.1%
Graduate or professional degree: 3.6%
Unemployed: 5.2%
Mean travel time to work (commute): 32.5 minutes
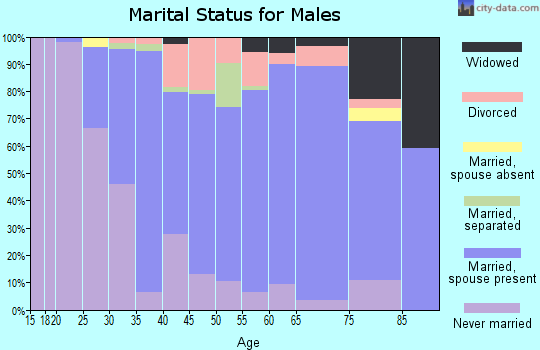
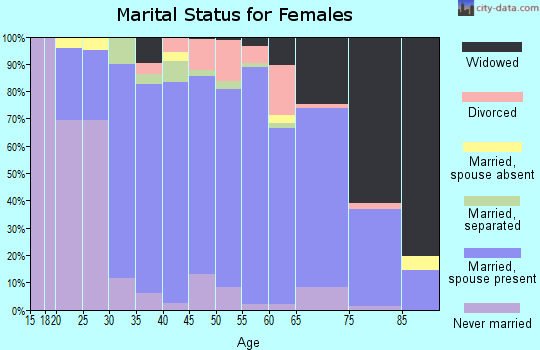
For population 15 years and over in 16049:
Never married: 23.6%
Now married: 57.0%
Separated: 1.6%
Widowed: 8.8%
Divorced: 9.0%
Zip code 16049 compared to state average:
Median house value below state average.
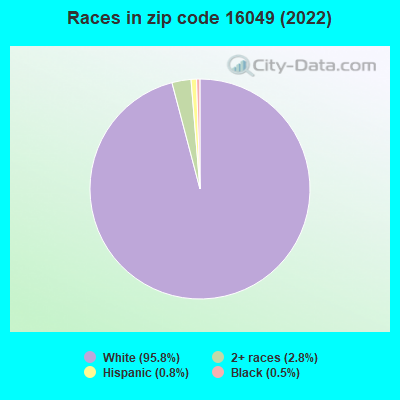
Black race population percentage significantly below state average.
Hispanic race population percentage significantly below state average.
Median age above state average.
Foreign-born population percentage significantly below state average.
Renting percentage below state average.
Length of stay since moving in significantly above state average.
Number of college students below state average.
Percentage of population with a bachelor's degree or higher significantly below state average.
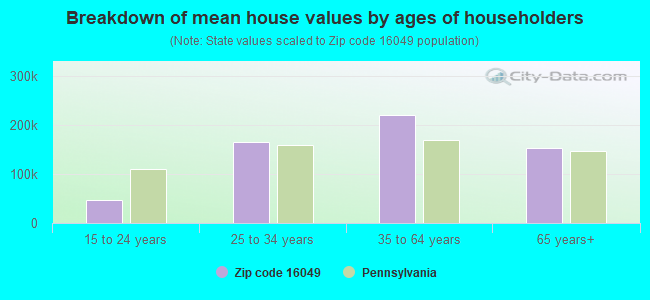
Estimated median house/condo value in 2022: $144,782
16049:
$144,782
Pennsylvania:
$245,500
According to our research of Pennsylvania and other state lists, there were 3 registered sex offenders living in 16049 zip code as of May 20, 2024. The ratio of all residents to sex offenders in zip code 16049 is 991 to 1. The ratio of registered sex offenders to all residents in this zip code is lower than the state average.
Median resident age:
This zip code:
47.8 years
Pennsylvania median age:
40.9 years
Average household size:
This zip code:
2.4 people
Pennsylvania:
2.4 people
Averages for the 2020 tax year for zip code 16049, filed in 2021:
Average Adjusted Gross Income (AGI) in 2020: $52,972 (Individual Income Tax Returns)
Here:
$52,972
State:
$75,707
Salary/wage: $47,185 (reported on 77.5% of returns)
Here:
$47,185
State:
$62,806
(% of AGI for various income ranges: 1049.7% for AGIs below $25k, 3188.3% for AGIs $25k-50k, 5472.6% for AGIs $50k-75k, 7463.8% for AGIs $75k-100k, 15906.7% for AGIs $100k-200k)
Taxable interest for individuals: $567 (reported on 31.7% of returns)
This zip code:
$567
Pennsylvania:
$1,633
(% of AGI for various income ranges: 18.3% for AGIs below $25k, 18.0% for AGIs $25k-50k, 23.7% for AGIs $50k-75k, 30.8% for AGIs $75k-100k, 50.8% for AGIs $100k-200k)
Ordinary dividends: $3,032 (reported on 15.5% of returns)
Here:
$3,032
State:
$7,382
(% of AGI for various income ranges: 38.3% for AGIs below $25k, 37.0% for AGIs $25k-50k, 35.8% for AGIs $50k-75k, 42.3% for AGIs $75k-100k, 265.0% for AGIs $100k-200k)
Net capital gain/loss in AGI: +$4,061 (reported on 12.7% of returns)
Here:
+$4,061
State:
+$23,522
(% of AGI for various income ranges: 17.0% for AGIs below $25k, 28.3% for AGIs $25k-50k, 75.3% for AGIs $50k-75k, 15.4% for AGIs $75k-100k, 360.0% for AGIs $100k-200k)
Profit/loss from business: +$10,282 (reported on 12.0% of returns)
Here:
+$10,282
State:
+$16,274
(% of AGI for various income ranges: 103.0% for AGIs below $25k, 149.7% for AGIs $25k-50k, 176.3% for AGIs $50k-75k, 154.6% for AGIs $75k-100k, 378.3% for AGIs $100k-200k)
Taxable individual retirement arrangement distribution: $18,647 (reported on 12.0% of returns)
16049:
$18,647
Pennsylvania:
$18,583
(% of AGI for various income ranges: 83.3% for AGIs below $25k, 148.3% for AGIs $25k-50k, 259.5% for AGIs $50k-75k, 473.1% for AGIs $75k-100k, 1139.2% for AGIs $100k-200k)
Earned income credit: $2,206 (reported on 11.3% of returns)
Here:
$2,206
State:
$2,100
(% of AGI for various income ranges: 67.7% for AGIs below $25k, 50.0% for AGIs $25k-50k)
Percentage of individuals using paid preparers for their 2020 taxes: 93.7%
Here:
94%
State:
92%
(% for various income ranges: 93.5% for AGIs below $25k, 94.6% for AGIs $25k-50k, 91.7% for AGIs $50k-75k, 93.8% for AGIs $75k-100k, 94.7% for AGIs $100k-200k)
Averages for the 2012 tax year for zip code 16049, filed in 2013:
Average Adjusted Gross Income (AGI) in 2012: $47,194 (Individual Income Tax Returns)
Here:
$47,194
State:
$61,346
Salary/wage: $40,461 (reported on 80.9% of returns)
Here:
$40,461
State:
$51,902
(% of AGI for various income ranges: 66.6% for AGIs below $25k, 76.9% for AGIs $25k-50k, 78.5% for AGIs $50k-75k, 77.6% for AGIs $75k-100k, 54.0% for AGIs $100k-200k)
Taxable interest for individuals: $637 (reported on 30.5% of returns)
This zip code:
$637
Pennsylvania:
$1,588
(% of AGI for various income ranges: 1.8% for AGIs below $25k, 0.3% for AGIs $25k-50k, 0.3% for AGIs $50k-75k, 0.3% for AGIs $75k-100k, 0.2% for AGIs $100k-200k)
Ordinary dividends: $1,635 (reported on 16.3% of returns)
Here:
$1,635
State:
$5,827
(% of AGI for various income ranges: 1.6% for AGIs below $25k, 0.6% for AGIs $25k-50k, 0.3% for AGIs $50k-75k, 0.7% for AGIs $75k-100k, 0.2% for AGIs $100k-200k)
Net capital gain/loss in AGI: +$2,442 (reported on 8.5% of returns)
Here:
+$2,442
State:
+$14,495
(% of AGI for various income ranges: 0.9% for AGIs $50k-75k, 0.3% for AGIs $75k-100k, 0.6% for AGIs $100k-200k)
Profit/loss from business: +$7,662 (reported on 11.3% of returns)
Here:
+$7,662
State:
+$16,268
(% of AGI for various income ranges: 7.1% for AGIs below $25k, 2.6% for AGIs $25k-50k, 2.5% for AGIs $50k-75k, 0.2% for AGIs $100k-200k)
Taxable individual retirement arrangement distribution: $12,527 (reported on 10.6% of returns)
16049:
$12,527
Pennsylvania:
$14,550
(% of AGI for various income ranges: 3.8% for AGIs below $25k, 2.4% for AGIs $25k-50k, 2.4% for AGIs $50k-75k, 3.0% for AGIs $75k-100k, 3.0% for AGIs $100k-200k)
Total itemized deductions: $17,735 (17% of AGI, reported on 12.1% of returns)
Here:
$17,735
State:
$23,538
Here:
16.8% of AGI
State:
18.4% of AGI
(% of AGI for various income ranges: 3.7% for AGIs $25k-50k, 4.1% for AGIs $50k-75k, 4.6% for AGIs $75k-100k, 6.8% for AGIs $100k-200k)
Charity contributions: $3,800 (reported on 8.5% of returns)
Here:
$3,800
State:
$4,025
(% of AGI for various income ranges: 1.3% for AGIs below $25k, 0.4% for AGIs $50k-75k, 0.8% for AGIs $75k-100k, 1.1% for AGIs $100k-200k)
Taxes paid: $6,259 (reported on 12.1% of returns)
16049:
$6,259
State:
$9,982
(% of AGI for various income ranges: 0.9% for AGIs $25k-50k, 1.2% for AGIs $50k-75k, 1.6% for AGIs $75k-100k, 2.9% for AGIs $100k-200k)
Earned income credit: $2,129 (reported on 14.9% of returns)
Here:
$2,129
State:
$2,106
(% of AGI for various income ranges: 4.9% for AGIs below $25k, 0.9% for AGIs $25k-50k)
Percentage of individuals using paid preparers for their 2012 taxes: 53.9%
Here:
54%
State:
53%
(% for various income ranges: 47.2% for AGIs below $25k, 51.3% for AGIs $25k-50k, 56.5% for AGIs $50k-75k, 61.5% for AGIs $75k-100k, 76.9% for AGIs $100k-200k)
Averages for the 2004 tax year for zip code 16049, filed in 2005:
Average Adjusted Gross Income (AGI) in 2004: $32,744 (Individual Income Tax Returns)
Here:
$32,744
State:
$48,049
Salary/wage: $31,012 (reported on 83.1% of returns)
Here:
$31,012
State:
$42,646
(% of AGI for various income ranges: 110.7% for AGIs below $10k, 72.6% for AGIs $10k-25k, 79.7% for AGIs $25k-50k, 84.5% for AGIs $50k-75k, 79.2% for AGIs $75k-100k, 59.6% for AGIs over 100k)
Taxable interest for individuals: $1,016 (reported on 41.7% of returns)
This zip code:
$1,016
Pennsylvania:
$1,657
(% of AGI for various income ranges: 10.3% for AGIs below $10k, 2.5% for AGIs $10k-25k, 1.4% for AGIs $25k-50k, 0.5% for AGIs $50k-75k, 0.6% for AGIs $75k-100k, 0.2% for AGIs over 100k)
Taxable dividends: $1,180 (reported on 18.4% of returns)
Here:
$1,180
State:
$3,566
(% of AGI for various income ranges: 3.8% for AGIs below $10k, 1.2% for AGIs $10k-25k, 0.6% for AGIs $25k-50k, 0.3% for AGIs $50k-75k, 0.8% for AGIs $75k-100k, 0.0% for AGIs over 100k)
Net capital gain/loss: +$822 (reported on 12.2% of returns)
Here:
+$822
State:
+$9,716
(% of AGI for various income ranges: -1.8% for AGIs below $10k, 0.0% for AGIs $10k-25k, 0.7% for AGIs $25k-50k, 0.3% for AGIs $50k-75k, 0.3% for AGIs $75k-100k)
Profit/loss from business: +$6,543 (reported on 14.2% of returns)
Here:
+$6,543
State:
+$14,267
(% of AGI for various income ranges: 6.3% for AGIs below $10k, 4.8% for AGIs $10k-25k, 2.4% for AGIs $25k-50k, 3.1% for AGIs $50k-75k, 2.8% for AGIs $75k-100k)
IRA payment deduction: $2,370 (reported on 1.9% of returns)
16049:
$2,370
Pennsylvania:
$2,903
Total itemized deductions: $13,784 (24% of AGI, reported on 12.0% of returns)
Here:
$13,784
State:
$18,804
Here:
23.6% of AGI
State:
19.5% of AGI
(% of AGI for various income ranges: 3.4% for AGIs $10k-25k, 5.1% for AGIs $25k-50k, 4.7% for AGIs $50k-75k, 7.7% for AGIs $75k-100k, 5.4% for AGIs over 100k)
Charity contributions deductions: $3,108 (5% of AGI, reported on 9.4% of returns)
Here:
$3,108
State:
$3,337
Here:
5.0% of AGI
State:
3.3% of AGI
(% of AGI for various income ranges: 0.2% for AGIs $10k-25k, 0.8% for AGIs $25k-50k, 0.6% for AGIs $50k-75k, 2.0% for AGIs $75k-100k, 1.3% for AGIs over 100k)
Total tax: $3,711 (reported on 73.3% of returns)
16049:
$3,711
State:
$8,008
(% of AGI for various income ranges: 2.5% for AGIs below $10k, 4.0% for AGIs $10k-25k, 6.3% for AGIs $25k-50k, 8.8% for AGIs $50k-75k, 11.0% for AGIs $75k-100k, 17.1% for AGIs over 100k)
Earned income credit: $1,519 (reported on 15.1% of returns)
Here:
$1,519
State:
$1,643
Percentage of individuals using paid preparers for their 2004 taxes: 60.0%
Here:
60%
State:
56%
(% for various income ranges: 56.4% for AGIs below $10k, 59.5% for AGIs $10k-25k, 61.4% for AGIs $25k-50k, 59.5% for AGIs $50k-75k, 63.2% for AGIs $75k-100k, 78.1% for AGIs over 100k)
Household received Food Stamps/SNAP in the past 12 months: 250 Household did not receive Food Stamps/SNAP in the past 12 months: 984
Women who had a birth in the past 12 months: 31 (21 now married, 9 unmarried) Women who did not have a birth in the past 12 months: 510 (281 now married, 225 unmarried)
Housing units in zip code 16049 with a mortgage: 396 (38 second mortgage, 35 both second mortgage and home equity loan) Houses without a mortgage: 32
Median monthly owner costs for units with a mortgage: $1,204 Median monthly owner costs for units without a mortgage: $412
Residents with income below the poverty level in 2022:
This zip code:
13.5%
Whole state:
11.8%
Residents with income below 50% of the poverty level in 2022:
This zip code:
6.9%
Whole state:
6.1%
Median number of rooms in houses and condos:
Here:
6.4
State:
6.8
Median number of rooms in apartments:
Here:
4.9
State:
4.3
Notable locations in this zip code not listed on our city pages
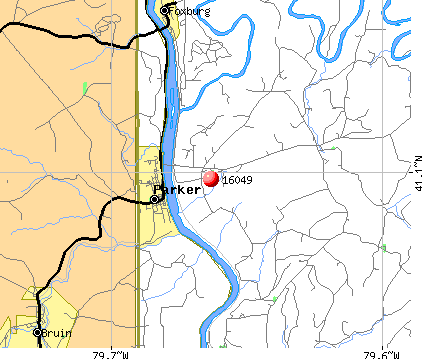
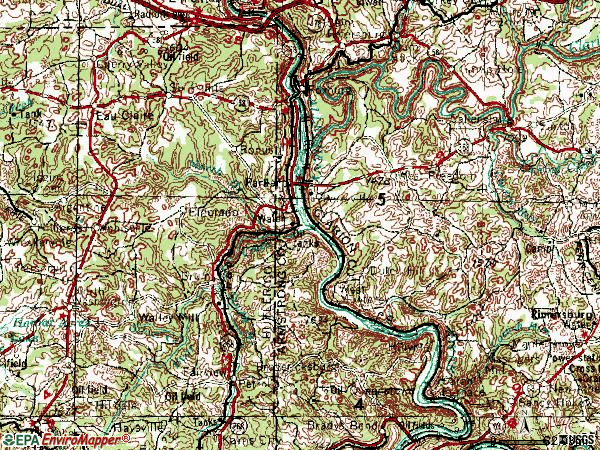
Notable locations in zip code 16049: Church Hill (A), Happy Retreat (B), Farrentown (C), Donelly Station (D), Blue Goose Mine (E), Parkers Landing (F), Sandy Point (G), Eagle Mine (H), Stonehouse (I), Parker City Volunteer Fire Department (J), Perry Township Volunteer Fire Department (K), Callensburg - Licking Township Volunteer Fire Department (L). Display/hide their locations on the map
Streams, rivers, and creeks: Clarion River (A), Lowrey Run (B), Thoms Run (C), Fiddlers Run (D), Dunlap Creek (E), Bear Creek (F), Licking Creek (G), Cherry Run (H), Catfish Run (I). Display/hide their locations on the map
In group quarters: 65 (-1 institutionalized population)
Size of family households: 458 2-persons, 144 3-persons, 123 4-persons, 85 5-persons, 9 6-persons, 11 7-or-more-persons
Size of nonfamily households: 359 1-person, 37 2-persons
461 married couples with children.
134 single-parent households (32 men, 102 women).
98.2% of residents of 16049 zip code speak English at home.
0.3% of residents speak Spanish at home (80% very well, 20% not well).
1.2% of residents speak other Indo-European language at home (68% very well, 21% well, 12% not well).
Foreign born population: 0 (0.0%)
:
0.0%
Whole state:
7.5%
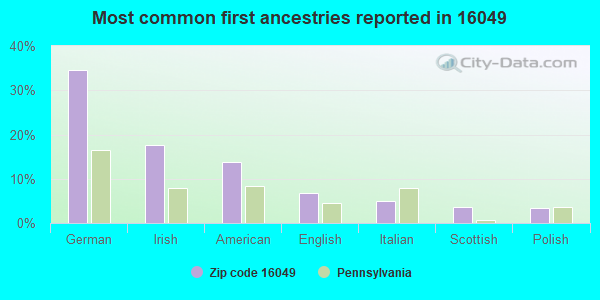
35%German
18%Irish
14%American
7%English
5%Italian
4%Scottish
3%Polish
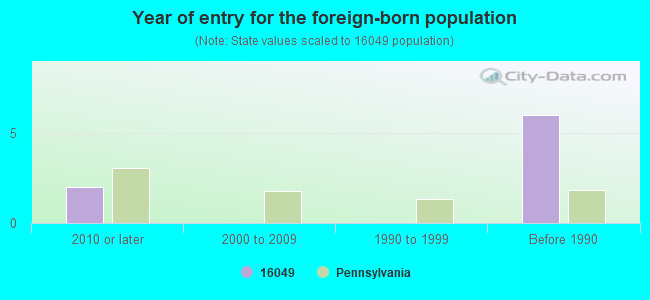
Year of entry for the foreign-born population
22010 or later
02000 to 2009
01990 to 1999
6Before 1990
Facilities with environmental interests located in this zip code:
ALLWASTE CONTAINER SERVICES (105 TANKER LN in PARKER, PA)
HAZARDOUS WASTE BIENNIAL REPORTER (Resource Conservation and Recovery Act (tracking hazardous waste)) Large Quantity Generators, more that 1000 kg of hazardous waste/month (Resource Conservation and Recovery Act (tracking hazardous waste)) - notification Organizations: ALLWASTE CONTAINER SVC (CONTACT/OPERATOR)
, PHILIP SERVICES CORPORATION (CONTACT/OWNER)
Alternative names: ALLWASTE CONTAINER SERVICES PARKER, ALLWASTE TANK CLEANING INC
A-C VALLEY IND PARK STF (RD 3 in PARKER, PA)
National Pollutant Discharge Elimination System NON-MAJOR (Tracking pollutant discharge elimination systems) - permit Business SIC classification: LAND SUBDIVIDERS AND DEVELOPERS, EXCEPT CEMETERIES Alternative names: ALLEGH-CLARION DEV CORP, ALLEGHENY-CLARION VALLEY DEVEL
Housing units lacking complete plumbing facilities: 5.3% Housing units lacking complete kitchen facilities: 4.2%
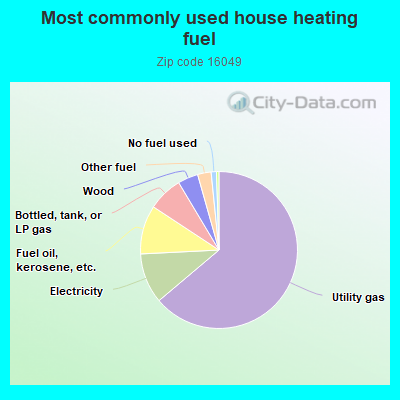
64.1%Utility gas
10.4%Electricity
10.1%Fuel oil, kerosene, etc.
7.2%Bottled, tank, or LP gas
4.2%Wood
2.8%Other fuel
1.1%No fuel used
Population in 1990: 3,131. Population change in the 1990s: +114 (+3.6%).
Place of birth for U.S.-born residents:
This state: 2,676
Northeast: 50
Midwest: 81
South: 108
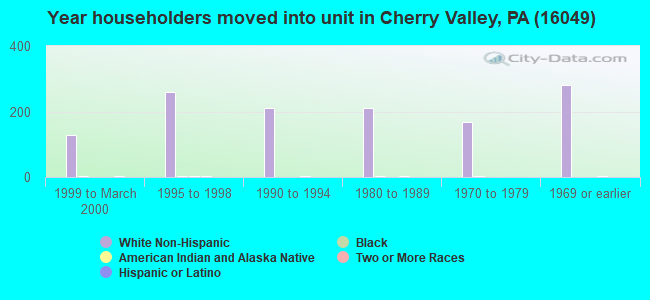
West: 60
72% of the 16049 zip code residents lived in the same house 5 years ago. Out of people who lived in different houses, 52% lived in this county. Out of people who lived in different counties, 50% lived in Pennsylvania.
93% of the 16049 zip code residents lived in the same house 1 year ago. Out of people who lived in different houses, 46% moved from this county. Out of people who lived in different houses, 52% moved from different county within same state. Out of people who lived in different houses, 1% moved from different state.
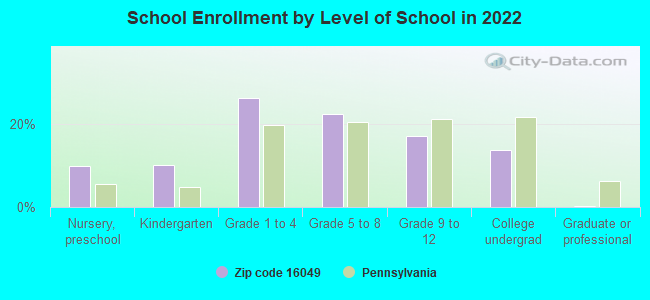
Private vs. public school enrollment:
Students in private schools in grades 1 to 8 (elementary and middle school): 27
Here:
9.4%
Pennsylvania:
15.7%
Students in private schools in grades 9 to 12 (high school): 8
Here:
8.1%
Pennsylvania:
13.4%
Students in private undergraduate colleges: 11
Here:
13.2%
Pennsylvania:
39.8%
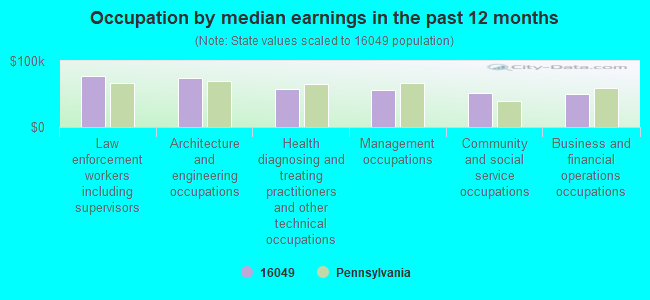
Occupation by median earnings in the past 12 months ($)
77,338Law enforcement workers including supervisors
74,616Architecture and engineering occupations
57,152Health diagnosing and treating practitioners and other technical occupations
55,697Management occupations
51,846Community and social service occupations
50,712Business and financial operations occupations
Top industries in this zip code by the number of employees in 2005:
Utilities: Electric Power Distribution (50-99 employees: 1 establishment)
Health Care and Social Assistance: Homes for the Elderly (20-49: 1)
Other Services (except Public Administration): Religious Organizations (10-19: 1, 5-9: 1, 1-4: 4)
Accommodation and Food Services: Limited-Service Restaurants (10-19: 1, 1-4: 1)
Professional, Scientific, and Technical Services: All Other Professional, Scientific, and Technical Services (10-19: 1)
Construction: Masonry Contractors (10-19: 1)
People in group quarters in 2010:
2 people in group homes intended for adults
Fatal accident statistics in 2014:
Fatal accident count: 3
Vehicles involved in fatal accidents: 4
Fatal accidents caused by drunken drivers: 2
Fatalities: 3
Persons involved in fatal accidents: 5
Pedestrians involved in fatal accidents: 0
Fatal accident statistics in 2013:
Fatal accident count: 1
Vehicles involved in fatal accidents: 1
Fatal accidents caused by drunken drivers: 0
Fatalities: 1
Persons involved in fatal accidents: 1
Pedestrians involved in fatal accidents: 0
Home Mortgage Disclosure Act Aggregated Statistics For Year 2009 (Based on 6 partial tracts)
A) FHA, FSA/RHS & VA Home Purchase Loans
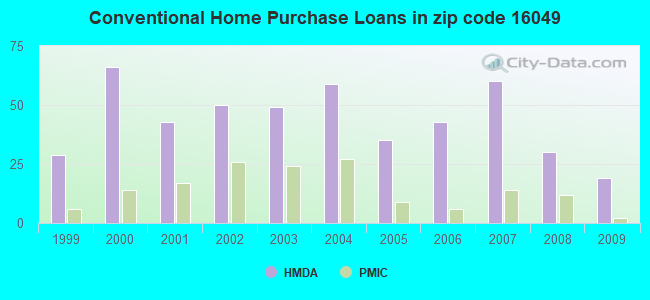
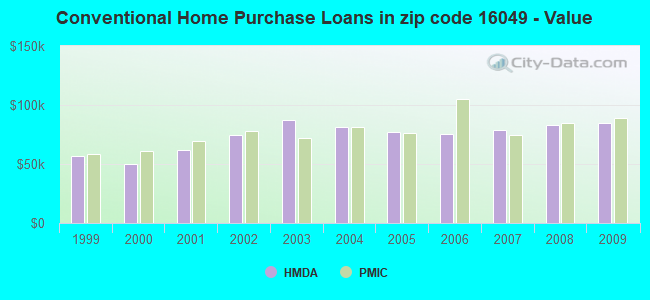
B) Conventional Home Purchase Loans
C) Refinancings
D) Home Improvement Loans
F) Non-occupant Loans on < 5 Family Dwellings (A B C & D)
G) Loans On Manufactured Home Dwelling (A B C & D)
Number
Average Value
Number
Average Value
Number
Average Value
Number
Average Value
Number
Average Value
Number
Average Value
LOANS ORIGINATED
15
$102,314
19
$85,034
79
$110,009
23
$41,443
4
$60,542
3
$67,267
APPLICATIONS APPROVED, NOT ACCEPTED
1
$64,200
1
$82,010
7
$107,314
0
$0
0
$0
1
$72,030
APPLICATIONS DENIED
1
$165,950
4
$49,155
53
$87,378
13
$33,939
4
$45,985
7
$54,237
APPLICATIONS WITHDRAWN
0
$0
4
$89,102
30
$101,059
3
$35,143
2
$61,525
2
$101,555
FILES CLOSED FOR INCOMPLETENESS
0
$0
0
$0
7
$85,424
2
$37,795
0
$0
2
$83,845
Aggregated Statistics For Year 2008 (Based on 6 partial tracts)
A) FHA, FSA/RHS & VA Home Purchase Loans
B) Conventional Home Purchase Loans
C) Refinancings
D) Home Improvement Loans
F) Non-occupant Loans on < 5 Family Dwellings (A B C & D)
G) Loans On Manufactured Home Dwelling (A B C & D)
Number
Average Value
Number
Average Value
Number
Average Value
Number
Average Value
Number
Average Value
Number
Average Value
LOANS ORIGINATED
10
$80,687
30
$83,420
64
$88,104
36
$24,020
4
$58,695
11
$67,162
APPLICATIONS APPROVED, NOT ACCEPTED
1
$126,010
9
$81,520
7
$61,103
2
$41,820
1
$36,740
2
$98,505
APPLICATIONS DENIED
3
$54,297
7
$59,013
87
$97,749
23
$33,924
3
$34,653
13
$91,325
APPLICATIONS WITHDRAWN
3
$110,207
6
$73,198
23
$108,650
4
$79,260
1
$48,470
3
$97,400
FILES CLOSED FOR INCOMPLETENESS
0
$0
0
$0
3
$47,830
1
$9,580
0
$0
0
$0
Aggregated Statistics For Year 2007 (Based on 6 partial tracts)
A) FHA, FSA/RHS & VA Home Purchase Loans
B) Conventional Home Purchase Loans
C) Refinancings
D) Home Improvement Loans
F) Non-occupant Loans on < 5 Family Dwellings (A B C & D)
G) Loans On Manufactured Home Dwelling (A B C & D)
Number
Average Value
Number
Average Value
Number
Average Value
Number
Average Value
Number
Average Value
Number
Average Value
LOANS ORIGINATED
7
$95,253
60
$79,090
92
$81,661
40
$39,426
11
$90,726
22
$76,615
APPLICATIONS APPROVED, NOT ACCEPTED
0
$0
7
$102,417
28
$84,304
5
$27,752
1
$70,280
5
$97,232
APPLICATIONS DENIED
1
$85,280
14
$74,737
120
$96,508
27
$40,747
3
$62,337
14
$84,063
APPLICATIONS WITHDRAWN
0
$0
5
$74,504
36
$100,658
1
$44,150
1
$38,480
4
$113,150
FILES CLOSED FOR INCOMPLETENESS
0
$0
2
$87,470
6
$123,475
2
$82,165
0
$0
1
$134,150
Aggregated Statistics For Year 2006 (Based on 6 partial tracts)
A) FHA, FSA/RHS & VA Home Purchase Loans
B) Conventional Home Purchase Loans
C) Refinancings
D) Home Improvement Loans
F) Non-occupant Loans on < 5 Family Dwellings (A B C & D)
G) Loans On Manufactured Home Dwelling (A B C & D)
Number
Average Value
Number
Average Value
Number
Average Value
Number
Average Value
Number
Average Value
Number
Average Value
LOANS ORIGINATED
10
$86,501
43
$75,534
95
$85,266
44
$32,754
6
$51,500
10
$73,828
APPLICATIONS APPROVED, NOT ACCEPTED
0
$0
9
$56,077
19
$88,509
4
$30,485
0
$0
2
$50,050
APPLICATIONS DENIED
1
$88,490
20
$69,034
124
$84,822
21
$29,617
4
$61,092
19
$71,602
APPLICATIONS WITHDRAWN
2
$67,555
3
$42,633
44
$89,635
3
$56,107
2
$51,370
2
$25,490
FILES CLOSED FOR INCOMPLETENESS
0
$0
1
$74,420
10
$112,597
1
$20,000
1
$59,500
0
$0
Aggregated Statistics For Year 2005 (Based on 6 partial tracts)
A) FHA, FSA/RHS & VA Home Purchase Loans
B) Conventional Home Purchase Loans
C) Refinancings
D) Home Improvement Loans
F) Non-occupant Loans on < 5 Family Dwellings (A B C & D)
G) Loans On Manufactured Home Dwelling (A B C & D)
Number
Average Value
Number
Average Value
Number
Average Value
Number
Average Value
Number
Average Value
Number
Average Value
LOANS ORIGINATED
3
$72,117
35
$77,299
116
$76,294
45
$40,565
9
$70,060
14
$60,469
APPLICATIONS APPROVED, NOT ACCEPTED
0
$0
6
$66,823
23
$73,196
9
$51,379
3
$38,953
2
$31,305
APPLICATIONS DENIED
0
$0
21
$67,564
140
$77,676
25
$33,316
6
$30,560
20
$58,771
APPLICATIONS WITHDRAWN
1
$90,110
8
$65,939
69
$95,750
8
$101,548
1
$77,210
5
$70,130
FILES CLOSED FOR INCOMPLETENESS
0
$0
2
$75,700
12
$88,741
0
$0
0
$0
0
$0
Aggregated Statistics For Year 2004 (Based on 6 partial tracts)
A) FHA, FSA/RHS & VA Home Purchase Loans
B) Conventional Home Purchase Loans
C) Refinancings
D) Home Improvement Loans
F) Non-occupant Loans on < 5 Family Dwellings (A B C & D)
G) Loans On Manufactured Home Dwelling (A B C & D)
Number
Average Value
Number
Average Value
Number
Average Value
Number
Average Value
Number
Average Value
Number
Average Value
LOANS ORIGINATED
2
$76,445
59
$80,953
121
$70,392
41
$37,209
15
$47,606
5
$77,454
APPLICATIONS APPROVED, NOT ACCEPTED
1
$132,330
8
$61,978
25
$68,056
7
$66,316
3
$52,520
5
$43,462
APPLICATIONS DENIED
2
$59,885
13
$75,142
121
$82,197
31
$32,049
10
$56,087
12
$79,613
APPLICATIONS WITHDRAWN
1
$64,130
14
$97,126
70
$81,809
6
$40,237
2
$80,945
4
$73,725
FILES CLOSED FOR INCOMPLETENESS
0
$0
6
$81,852
37
$94,009
1
$16,870
2
$77,615
0
$0
Aggregated Statistics For Year 2003 (Based on 4 partial tracts)
A) FHA, FSA/RHS & VA Home Purchase Loans
B) Conventional Home Purchase Loans
C) Refinancings
D) Home Improvement Loans
F) Non-occupant Loans on < 5 Family Dwellings (A B C & D)
Number
Average Value
Number
Average Value
Number
Average Value
Number
Average Value
Number
Average Value
LOANS ORIGINATED
2
$95,820
49
$87,327
183
$77,674
34
$26,171
7
$62,631
APPLICATIONS APPROVED, NOT ACCEPTED
1
$59,410
6
$51,188
37
$81,198
8
$21,389
2
$33,475
APPLICATIONS DENIED
0
$0
16
$62,291
178
$79,308
30
$21,905
6
$34,955
APPLICATIONS WITHDRAWN
1
$38,330
9
$86,659
63
$81,976
2
$12,905
3
$78,253
FILES CLOSED FOR INCOMPLETENESS
0
$0
0
$0
10
$76,286
1
$25,630
0
$0
Aggregated Statistics For Year 2002 (Based on 4 partial tracts)
A) FHA, FSA/RHS & VA Home Purchase Loans
B) Conventional Home Purchase Loans
C) Refinancings
D) Home Improvement Loans
F) Non-occupant Loans on < 5 Family Dwellings (A B C & D)
Number
Average Value
Number
Average Value
Number
Average Value
Number
Average Value
Number
Average Value
LOANS ORIGINATED
4
$83,620
50
$74,847
138
$68,618
32
$24,555
6
$79,648
APPLICATIONS APPROVED, NOT ACCEPTED
1
$35,450
7
$59,376
50
$65,983
8
$29,091
1
$57,090
APPLICATIONS DENIED
0
$0
29
$44,326
102
$71,991
14
$13,066
3
$74,700
APPLICATIONS WITHDRAWN
4
$57,252
4
$61,048
74
$77,110
4
$15,792
0
$0
FILES CLOSED FOR INCOMPLETENESS
0
$0
3
$59,730
25
$79,808
0
$0
1
$57,490
Aggregated Statistics For Year 2001 (Based on 4 partial tracts)
A) FHA, FSA/RHS & VA Home Purchase Loans
B) Conventional Home Purchase Loans
C) Refinancings
D) Home Improvement Loans
F) Non-occupant Loans on < 5 Family Dwellings (A B C & D)
Number
Average Value
Number
Average Value
Number
Average Value
Number
Average Value
Number
Average Value
LOANS ORIGINATED
7
$58,773
43
$61,855
131
$61,568
38
$22,871
5
$36,056
APPLICATIONS APPROVED, NOT ACCEPTED
0
$0
17
$46,713
62
$65,218
16
$30,748
1
$58,220
APPLICATIONS DENIED
1
$84,350
33
$47,702
176
$60,011
34
$18,578
2
$51,455
APPLICATIONS WITHDRAWN
1
$82,410
5
$41,882
77
$70,842
12
$14,996
2
$46,350
FILES CLOSED FOR INCOMPLETENESS
0
$0
2
$33,535
12
$67,420
0
$0
0
$0
Aggregated Statistics For Year 2000 (Based on 4 partial tracts)
A) FHA, FSA/RHS & VA Home Purchase Loans
B) Conventional Home Purchase Loans
C) Refinancings
D) Home Improvement Loans
E) Loans on Dwellings For 5+ Families
F) Non-occupant Loans on < 5 Family Dwellings (A B C & D)
Number
Average Value
Number
Average Value
Number
Average Value
Number
Average Value
Number
Average Value
Number
Average Value
LOANS ORIGINATED
10
$53,637
66
$50,242
82
$52,623
41
$18,672
1
$124,570
5
$20,436
APPLICATIONS APPROVED, NOT ACCEPTED
1
$47,910
19
$45,234
47
$67,394
12
$25,904
0
$0
0
$0
APPLICATIONS DENIED
5
$38,902
70
$49,075
97
$53,676
37
$15,811
0
$0
4
$35,512
APPLICATIONS WITHDRAWN
2
$53,180
9
$49,132
39
$55,739
3
$17,327
0
$0
0
$0
FILES CLOSED FOR INCOMPLETENESS
0
$0
4
$57,328
11
$60,200
1
$50,780
0
$0
1
$93,900
Aggregated Statistics For Year 1999 (Based on 2 partial tracts)
A) FHA, FSA/RHS & VA Home Purchase Loans
B) Conventional Home Purchase Loans
C) Refinancings
D) Home Improvement Loans
F) Non-occupant Loans on < 5 Family Dwellings (A B C & D)
2003 - 2018 National Fire Incident Reporting System (NFIRS) incidents
Based on the data from the years 2003 - 2018 the average number of fire incidents per year is 12. The highest number of fires - 47 took place in 2016, and the least - 0 in 2013. The data has an increasing trend.
When looking into fire subcategories, the most reports belonged to: Structure Fires (57.1%), and Outside Fires (27.6%).
Fire incident types reported to NFIRS in Zip Code 16049
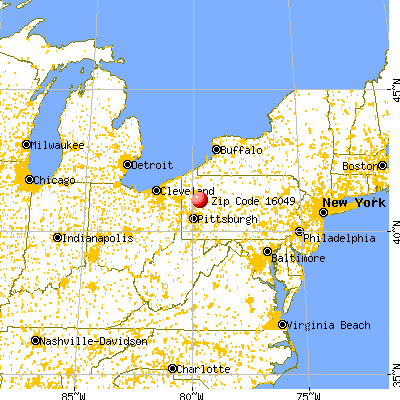


 Nearest zip codes: 16036, 16054, 16022, 16041, 16050, 16373.


 Based on the data from the years 2003 - 2018 the average number of fire incidents per year is 12. The highest number of fires - 47 took place in 2016, and the least - 0 in 2013. The data has an increasing trend.
 When looking into fire subcategories, the most reports belonged to: Structure Fires (57.1%), and Outside Fires (27.6%).