Estimated zip code population in 2022: 2,701 Zip code population in 2010: 2,761 Zip code population in 2000: 2,346
Houses and condos: 1,087 Renter-occupied apartments: 113
% of renters here:
11%
State:
31%
March 2022 cost of living index in zip code 16061: 88.7 (less than average, U.S. average is 100)
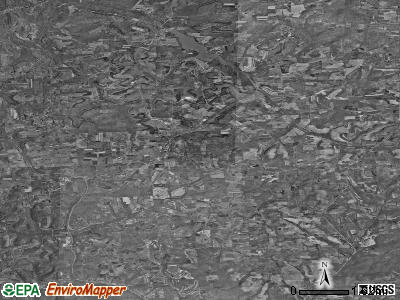
Land area: 44.0 sq. mi. Water area: 0.3 sq. mi.
Population density: 61 people per square mile
(very low).
OSM Map
General Map
Google Map
MSN Map
OSM Map
General Map
Google Map
MSN Map
OSM Map
General Map
Google Map
MSN Map
OSM Map
General Map
Google Map
MSN Map
Please wait while loading the map...
Real estate property taxes paid for housing units in 2022:
This zip code:
1.0% ($2,128)
Pennsylvania:
1.3% ($3,094)
Median real estate property taxes paid for housing units with mortgages in 2022: $2,245 (0.9%) Median real estate property taxes paid for housing units with no mortgage in 2022: $2,013 (1.2%)
Business Search- 14 Million verified businesses
Males: 1,376
(51.0%)
Females: 1,324
(49.0%)
For population 25 years and over in 16061:
High school or higher: 92.0%
Bachelor's degree or higher: 17.7%
Graduate or professional degree: 2.1%
Unemployed: 1.4%
Mean travel time to work (commute): 31.5 minutes
For population 15 years and over in 16061:
Never married: 32.0%
Now married: 53.4%
Separated: 2.1%
Widowed: 5.7%
Divorced: 6.8%
Zip code 16061 compared to state average:
Unemployed percentage significantly below state average.
Black race population percentage significantly below state average.
Hispanic race population percentage significantly below state average.
Median age above state average.
Foreign-born population percentage significantly below state average.
Renting percentage significantly below state average.
Length of stay since moving in significantly above state average.
House age below state average.
Number of college students below state average.
Percentage of population with a bachelor's degree or higher below state average.
Estimated median house/condo value in 2022: $208,816
16061:
$208,816
Pennsylvania:
$245,500
According to our research of Pennsylvania and other state lists, there was 1 registered sex offender living in 16061 zip code as of June 02, 2024. The ratio of all residents to sex offenders in zip code 16061 is 2,544 to 1. The ratio of registered sex offenders to all residents in this zip code is much lower than the state average.
Median resident age:
This zip code:
45.6 years
Pennsylvania median age:
40.9 years
Average household size:
This zip code:
2.7 people
Pennsylvania:
2.4 people
Averages for the 2020 tax year for zip code 16061, filed in 2021:
Average Adjusted Gross Income (AGI) in 2020: $56,099 (Individual Income Tax Returns)
Here:
$56,099
State:
$75,707
Salary/wage: $48,953 (reported on 77.5% of returns)
Here:
$48,953
State:
$62,806
(% of AGI for various income ranges: 1066.7% for AGIs below $25k, 3166.2% for AGIs $25k-50k, 5478.8% for AGIs $50k-75k, 9043.0% for AGIs $75k-100k, 15233.8% for AGIs $100k-200k)
Taxable interest for individuals: $878 (reported on 35.7% of returns)
This zip code:
$878
Pennsylvania:
$1,633
(% of AGI for various income ranges: 23.8% for AGIs below $25k, 58.1% for AGIs $25k-50k, 35.3% for AGIs $50k-75k, 51.0% for AGIs $75k-100k, 65.4% for AGIs $100k-200k)
Ordinary dividends: $1,784 (reported on 19.4% of returns)
Here:
$1,784
State:
$7,382
(% of AGI for various income ranges: 19.6% for AGIs below $25k, 41.2% for AGIs $25k-50k, 53.5% for AGIs $50k-75k, 98.0% for AGIs $75k-100k, 79.2% for AGIs $100k-200k)
Net capital gain/loss in AGI: +$4,252 (reported on 16.3% of returns)
Here:
+$4,252
State:
+$23,522
(% of AGI for various income ranges: 10.4% for AGIs below $25k, 25.0% for AGIs $25k-50k, 53.5% for AGIs $50k-75k, 106.0% for AGIs $75k-100k, 466.2% for AGIs $100k-200k)
Profit/loss from business: +$7,827 (reported on 11.6% of returns)
Here:
+$7,827
State:
+$16,274
(% of AGI for various income ranges: 79.6% for AGIs below $25k, 133.5% for AGIs $25k-50k, 118.8% for AGIs $50k-75k, 333.8% for AGIs $100k-200k)
Taxable individual retirement arrangement distribution: $13,528 (reported on 14.0% of returns)
16061:
$13,528
Pennsylvania:
$18,583
(% of AGI for various income ranges: 133.8% for AGIs below $25k, 157.7% for AGIs $25k-50k, 344.1% for AGIs $50k-75k, 320.0% for AGIs $75k-100k, 614.6% for AGIs $100k-200k)
Earned income credit: $1,983 (reported on 9.3% of returns)
Here:
$1,983
State:
$2,100
(% of AGI for various income ranges: 53.3% for AGIs below $25k, 42.3% for AGIs $25k-50k)
Percentage of individuals using paid preparers for their 2020 taxes: 91.5%
Here:
91%
State:
92%
(% for various income ranges: 89.7% for AGIs below $25k, 91.2% for AGIs $25k-50k, 95.2% for AGIs $50k-75k, 93.3% for AGIs $75k-100k, 90.0% for AGIs $100k-200k)
Averages for the 2012 tax year for zip code 16061, filed in 2013:
Average Adjusted Gross Income (AGI) in 2012: $58,288 (Individual Income Tax Returns)
Here:
$58,288
State:
$61,346
Salary/wage: $41,012 (reported on 81.9% of returns)
Here:
$41,012
State:
$51,902
(% of AGI for various income ranges: 73.2% for AGIs below $25k, 74.6% for AGIs $25k-50k, 69.9% for AGIs $50k-75k, 75.8% for AGIs $75k-100k, 58.7% for AGIs $100k-200k, 15.7% for AGIs over 200k)
Taxable interest for individuals: $708 (reported on 34.8% of returns)
This zip code:
$708
Pennsylvania:
$1,588
(% of AGI for various income ranges: 0.3% for AGIs below $25k, 0.3% for AGIs $25k-50k, 0.5% for AGIs $50k-75k, 0.4% for AGIs $75k-100k, 0.2% for AGIs $100k-200k, 0.9% for AGIs over 200k)
Ordinary dividends: $1,688 (reported on 18.1% of returns)
Here:
$1,688
State:
$5,827
(% of AGI for various income ranges: 0.7% for AGIs below $25k, 0.5% for AGIs $25k-50k, 0.8% for AGIs $50k-75k, 0.3% for AGIs $75k-100k, 0.4% for AGIs $100k-200k, 0.6% for AGIs over 200k)
Net capital gain/loss in AGI: +$473 (reported on 10.9% of returns)
Here:
+$473
State:
+$14,495
(% of AGI for various income ranges: 0.3% for AGIs over 200k)
Profit/loss from business: +$6,258 (reported on 13.8% of returns)
Here:
+$6,258
State:
+$16,268
(% of AGI for various income ranges: 3.7% for AGIs below $25k, 2.1% for AGIs $25k-50k, 0.8% for AGIs $50k-75k, 1.2% for AGIs $75k-100k, 2.2% for AGIs $100k-200k)
Taxable individual retirement arrangement distribution: $10,124 (reported on 12.3% of returns)
16061:
$10,124
Pennsylvania:
$14,550
(% of AGI for various income ranges: 4.9% for AGIs below $25k, 3.4% for AGIs $25k-50k, 1.7% for AGIs $50k-75k, 3.7% for AGIs $75k-100k, 1.7% for AGIs $100k-200k)
Total itemized deductions: $17,569 (16% of AGI, reported on 21.0% of returns)
Here:
$17,569
State:
$23,538
Here:
15.9% of AGI
State:
18.4% of AGI
(% of AGI for various income ranges: 8.0% for AGIs $25k-50k, 5.9% for AGIs $50k-75k, 8.3% for AGIs $75k-100k, 7.7% for AGIs $100k-200k, 4.6% for AGIs over 200k)
Charity contributions: $2,758 (reported on 13.8% of returns)
Here:
$2,758
State:
$4,025
(% of AGI for various income ranges: 0.5% for AGIs $25k-50k, 0.3% for AGIs $50k-75k, 0.6% for AGIs $75k-100k, 1.0% for AGIs $100k-200k, 0.8% for AGIs over 200k)
Taxes paid: $6,872 (reported on 21.0% of returns)
16061:
$6,872
State:
$9,982
(% of AGI for various income ranges: 2.1% for AGIs $25k-50k, 2.0% for AGIs $50k-75k, 2.9% for AGIs $75k-100k, 3.3% for AGIs $100k-200k, 2.6% for AGIs over 200k)
Earned income credit: $1,847 (reported on 12.3% of returns)
Here:
$1,847
State:
$2,106
(% of AGI for various income ranges: 3.4% for AGIs below $25k, 1.0% for AGIs $25k-50k)
Percentage of individuals using paid preparers for their 2012 taxes: 58.0%
Here:
58%
State:
53%
(% for various income ranges: 49.0% for AGIs below $25k, 56.7% for AGIs $25k-50k, 61.9% for AGIs $50k-75k, 64.3% for AGIs $75k-100k, 70.6% for AGIs $100k-200k, 80.0% for AGIs over 200k)
Averages for the 2004 tax year for zip code 16061, filed in 2005:
Average Adjusted Gross Income (AGI) in 2004: $36,607 (Individual Income Tax Returns)
Here:
$36,607
State:
$48,049
Salary/wage: $34,365 (reported on 85.6% of returns)
Here:
$34,365
State:
$42,646
(% of AGI for various income ranges: 108.6% for AGIs below $10k, 76.7% for AGIs $10k-25k, 78.9% for AGIs $25k-50k, 85.2% for AGIs $50k-75k, 88.0% for AGIs $75k-100k, 63.1% for AGIs over 100k)
Taxable interest for individuals: $1,131 (reported on 47.1% of returns)
This zip code:
$1,131
Pennsylvania:
$1,657
(% of AGI for various income ranges: 7.0% for AGIs below $10k, 1.6% for AGIs $10k-25k, 1.5% for AGIs $25k-50k, 1.3% for AGIs $50k-75k, 0.7% for AGIs $75k-100k, 1.7% for AGIs over 100k)
Taxable dividends: $1,309 (reported on 20.2% of returns)
Here:
$1,309
State:
$3,566
(% of AGI for various income ranges: 2.0% for AGIs below $10k, 1.5% for AGIs $10k-25k, 0.8% for AGIs $25k-50k, 0.2% for AGIs $50k-75k, 0.6% for AGIs $75k-100k, 0.9% for AGIs over 100k)
Net capital gain/loss: +$2,633 (reported on 15.2% of returns)
Here:
+$2,633
State:
+$9,716
(% of AGI for various income ranges: -4.0% for AGIs below $10k, 0.7% for AGIs $10k-25k, 1.0% for AGIs $25k-50k, 0.6% for AGIs $50k-75k, 0.9% for AGIs $75k-100k, 3.5% for AGIs over 100k)
Profit/loss from business: +$6,239 (reported on 13.7% of returns)
Here:
+$6,239
State:
+$14,267
(% of AGI for various income ranges: 11.3% for AGIs below $10k, 5.0% for AGIs $10k-25k, 3.1% for AGIs $25k-50k, 2.0% for AGIs $50k-75k, 0.9% for AGIs $75k-100k)
IRA payment deduction: $2,913 (reported on 1.8% of returns)
16061:
$2,913
Pennsylvania:
$2,903
Total itemized deductions: $14,336 (21% of AGI, reported on 21.6% of returns)
Here:
$14,336
State:
$18,804
Here:
21.1% of AGI
State:
19.5% of AGI
(% of AGI for various income ranges: 6.1% for AGIs $10k-25k, 6.8% for AGIs $25k-50k, 8.3% for AGIs $50k-75k, 11.6% for AGIs $75k-100k, 10.9% for AGIs over 100k)
Charity contributions deductions: $2,155 (3% of AGI, reported on 16.8% of returns)
Here:
$2,155
State:
$3,337
Here:
2.9% of AGI
State:
3.3% of AGI
(% of AGI for various income ranges: 0.5% for AGIs $10k-25k, 0.5% for AGIs $25k-50k, 0.7% for AGIs $50k-75k, 1.1% for AGIs $75k-100k, 2.9% for AGIs over 100k)
Total tax: $4,420 (reported on 75.8% of returns)
16061:
$4,420
State:
$8,008
(% of AGI for various income ranges: 3.5% for AGIs below $10k, 4.3% for AGIs $10k-25k, 6.6% for AGIs $25k-50k, 8.5% for AGIs $50k-75k, 10.4% for AGIs $75k-100k, 18.1% for AGIs over 100k)
Earned income credit: $1,605 (reported on 12.7% of returns)
Here:
$1,605
State:
$1,643
Percentage of individuals using paid preparers for their 2004 taxes: 55.7%
Here:
56%
State:
56%
(% for various income ranges: 49.8% for AGIs below $10k, 58.4% for AGIs $10k-25k, 58.6% for AGIs $25k-50k, 50.5% for AGIs $50k-75k, 53.8% for AGIs $75k-100k, 80.0% for AGIs over 100k)
Household received Food Stamps/SNAP in the past 12 months: 163 Household did not receive Food Stamps/SNAP in the past 12 months: 849
Women who had a birth in the past 12 months: 78 (4 now married, 63 unmarried) Women who did not have a birth in the past 12 months: 482 (234 now married, 246 unmarried)
Housing units in zip code 16061 with a mortgage: 407 (34 second mortgage, 34 both second mortgage and home equity loan) Houses without a mortgage: 97
Median monthly owner costs for units with a mortgage: $1,439 Median monthly owner costs for units without a mortgage: $477
Residents with income below the poverty level in 2022:
This zip code:
10.4%
Whole state:
11.8%
Residents with income below 50% of the poverty level in 2022:
This zip code:
6.6%
Whole state:
6.1%
Median number of rooms in houses and condos:
Here:
6.5
State:
6.8
Median number of rooms in apartments:
Here:
5.6
State:
4.3
Notable locations in this zip code not listed on our city pages
Churches in zip code 16061 include: Pleasant Valley Church (A), Rider Church (B), Concord Church (C), Springdale Church (D). Display/hide their locations on the map
In group quarters: 9 (-1 institutionalized population)
Size of family households: 307 2-persons, 180 3-persons, 128 4-persons, 113 5-persons, 2 6-persons
Size of nonfamily households: 236 1-person, 36 2-persons
291 married couples with children.
174 single-parent households (103 men, 71 women).
98.6% of residents of 16061 zip code speak English at home.
0.4% of residents speak Spanish at home (60% very well, 40% well).
0.2% of residents speak other Indo-European language at home (100% well).
Foreign born population: 9 (0.3%) (34.2% of them are naturalized citizens)
This zip code:
0.3%
Whole state:
7.5%
56%Bolivia
11%Honduras
11%Brazil
30%German
22%American
9%Irish
6%English
5%Scotch-Irish
4%Italian
4%Polish
Year of entry for the foreign-born population
72010 or later
12000 to 2009
11990 to 1999
6Before 1990
Facilities with environmental interests located in this zip code:
ALCORN PROP (MAHOOD RD in WEST SUNBURY, PA)
STATE MASTER (Pennsylvania database) - RCRIS-PAD987395373, HAZARDOUS WASTE PROGRAM Conditionally Exempt Small Quantity Generators, less than 100 kg/month of hazardous waste (Resource Conservation and Recovery Act (tracking hazardous waste)) - notification Organizations: ALCORN MARY (CONTACT/OWNER)
Alternative names: ALCORN PROPERTY
Housing units lacking complete plumbing facilities: 0.7% Housing units lacking complete kitchen facilities: 0.8%
24.5%Electricity
21.8%Utility gas
20.7%Fuel oil, kerosene, etc.
17.7%Bottled, tank, or LP gas
14.3%Wood
0.9%Other fuel
Population in 1990: 1,999. Population change in the 1990s: +347 (+17.4%).
Place of birth for U.S.-born residents:
This state: 2,453
Northeast: 66
Midwest: 29
South: 95
West: 16
77% of the 16061 zip code residents lived in the same house 5 years ago. Out of people who lived in different houses, 66% lived in this county. Out of people who lived in different counties, 50% lived in Pennsylvania.
95% of the 16061 zip code residents lived in the same house 1 year ago. Out of people who lived in different houses, 85% moved from this county. Out of people who lived in different houses, 12% moved from different county within same state. Out of people who lived in different houses, 3% moved from abroad.
Private vs. public school enrollment:
Students in private schools in grades 1 to 8 (elementary and middle school): 36
Here:
16.7%
Pennsylvania:
15.7%
Students in private schools in grades 9 to 12 (high school): 25
Here:
18.3%
Pennsylvania:
13.4%
Students in private undergraduate colleges: 8
Here:
12.8%
Pennsylvania:
39.8%
Occupation by median earnings in the past 12 months ($)
89,742Fire fighting and prevention, and other protective service workers including supervisors
77,703Computer and mathematical occupations
76,526Business and financial operations occupations
68,074Management occupations
60,535Health technologists and technicians
56,333Health diagnosing and treating practitioners and other technical occupations
Top industries in this zip code by the number of employees in 2005:
Administrative and Support and Waste Management and Remediation Services: Solid Waste Collection (20-49 employees: 1 establishment)
Health Care and Social Assistance: Residential Mental Retardation Facilities (10-19: 2)
Accommodation and Food Services: Limited-Service Restaurants (10-19: 1)
Other Services (except Public Administration): Religious Organizations (5-9: 1, 1-4: 3)
Finance and Insurance: Insurance Agencies and Brokerages (5-9: 1, 1-4: 1)
Other Services (except Public Administration): Funeral Homes and Funeral Services (5-9: 1)
Administrative and Support and Waste Management and Remediation Services: Solid Waste Landfill (5-9: 1)
People in group quarters in 2010:
5 people in group homes intended for adults
People in group quarters in 2000:
12 people in college dormitories (includes college quarters off campus)
8 people in schools, hospitals, or wards for the intellectually disabled
5 people in homes for the mentally retarded
Fatal accident statistics in 2014:
Fatal accident count: 1
Vehicles involved in fatal accidents: 2
Fatal accidents caused by drunken drivers: 0
Fatalities: 1
Persons involved in fatal accidents: 4
Pedestrians involved in fatal accidents: 0
Fatal accident statistics in 2012:
Fatal accident count: 2
Vehicles involved in fatal accidents: 3
Fatal accidents caused by drunken drivers: 1
Fatalities: 2
Persons involved in fatal accidents: 5
Pedestrians involved in fatal accidents: 0
Home Mortgage Disclosure Act Aggregated Statistics For Year 2009 (Based on 8 partial tracts)
A) FHA, FSA/RHS & VA Home Purchase Loans
B) Conventional Home Purchase Loans
C) Refinancings
D) Home Improvement Loans
F) Non-occupant Loans on < 5 Family Dwellings (A B C & D)
G) Loans On Manufactured Home Dwelling (A B C & D)
Number
Average Value
Number
Average Value
Number
Average Value
Number
Average Value
Number
Average Value
Number
Average Value
LOANS ORIGINATED
8
$122,465
23
$108,443
124
$115,856
31
$23,080
4
$92,092
15
$64,386
APPLICATIONS APPROVED, NOT ACCEPTED
0
$0
3
$67,800
9
$91,066
2
$46,990
0
$0
4
$56,440
APPLICATIONS DENIED
3
$142,747
6
$82,013
54
$116,473
19
$44,016
3
$61,420
18
$74,538
APPLICATIONS WITHDRAWN
3
$101,280
4
$146,185
36
$135,915
2
$54,190
1
$43,650
2
$115,635
FILES CLOSED FOR INCOMPLETENESS
0
$0
1
$71,480
10
$145,388
1
$69,610
1
$122,250
0
$0
Aggregated Statistics For Year 2008 (Based on 8 partial tracts)
A) FHA, FSA/RHS & VA Home Purchase Loans
B) Conventional Home Purchase Loans
C) Refinancings
D) Home Improvement Loans
F) Non-occupant Loans on < 5 Family Dwellings (A B C & D)
G) Loans On Manufactured Home Dwelling (A B C & D)
Number
Average Value
Number
Average Value
Number
Average Value
Number
Average Value
Number
Average Value
Number
Average Value
LOANS ORIGINATED
16
$104,246
34
$116,980
84
$101,808
31
$34,622
4
$80,615
20
$64,904
APPLICATIONS APPROVED, NOT ACCEPTED
2
$132,875
7
$125,361
8
$107,871
4
$48,962
0
$0
5
$89,596
APPLICATIONS DENIED
2
$82,650
12
$71,822
76
$114,908
29
$59,350
2
$80,025
22
$82,082
APPLICATIONS WITHDRAWN
1
$169,430
4
$71,375
23
$137,625
2
$52,185
0
$0
3
$118,237
FILES CLOSED FOR INCOMPLETENESS
0
$0
0
$0
6
$156,160
2
$72,095
0
$0
0
$0
Aggregated Statistics For Year 2007 (Based on 8 partial tracts)
A) FHA, FSA/RHS & VA Home Purchase Loans
B) Conventional Home Purchase Loans
C) Refinancings
D) Home Improvement Loans
F) Non-occupant Loans on < 5 Family Dwellings (A B C & D)
G) Loans On Manufactured Home Dwelling (A B C & D)
Number
Average Value
Number
Average Value
Number
Average Value
Number
Average Value
Number
Average Value
Number
Average Value
LOANS ORIGINATED
4
$113,975
58
$104,459
87
$92,871
54
$36,347
12
$64,785
23
$47,144
APPLICATIONS APPROVED, NOT ACCEPTED
0
$0
12
$91,692
18
$95,791
5
$68,456
1
$73,980
9
$88,257
APPLICATIONS DENIED
1
$86,870
24
$97,848
130
$117,374
27
$35,404
6
$94,182
22
$72,890
APPLICATIONS WITHDRAWN
1
$128,990
12
$101,907
31
$105,793
3
$39,543
2
$209,895
1
$102,110
FILES CLOSED FOR INCOMPLETENESS
0
$0
2
$118,720
7
$165,989
1
$52,590
0
$0
1
$129,490
Aggregated Statistics For Year 2006 (Based on 8 partial tracts)
A) FHA, FSA/RHS & VA Home Purchase Loans
B) Conventional Home Purchase Loans
C) Refinancings
D) Home Improvement Loans
F) Non-occupant Loans on < 5 Family Dwellings (A B C & D)
G) Loans On Manufactured Home Dwelling (A B C & D)
Number
Average Value
Number
Average Value
Number
Average Value
Number
Average Value
Number
Average Value
Number
Average Value
LOANS ORIGINATED
8
$121,791
58
$99,043
114
$88,570
55
$27,985
8
$92,524
26
$74,204
APPLICATIONS APPROVED, NOT ACCEPTED
0
$0
7
$62,056
27
$94,533
6
$31,090
2
$74,850
4
$58,812
APPLICATIONS DENIED
0
$0
16
$61,094
159
$107,941
44
$28,675
5
$71,534
27
$59,913
APPLICATIONS WITHDRAWN
0
$0
10
$106,135
58
$104,710
4
$68,798
1
$271,280
5
$133,546
FILES CLOSED FOR INCOMPLETENESS
0
$0
1
$43,540
14
$115,542
1
$17,710
1
$46,160
1
$9,180
Aggregated Statistics For Year 2005 (Based on 8 partial tracts)
A) FHA, FSA/RHS & VA Home Purchase Loans
B) Conventional Home Purchase Loans
C) Refinancings
D) Home Improvement Loans
F) Non-occupant Loans on < 5 Family Dwellings (A B C & D)
G) Loans On Manufactured Home Dwelling (A B C & D)
Number
Average Value
Number
Average Value
Number
Average Value
Number
Average Value
Number
Average Value
Number
Average Value
LOANS ORIGINATED
4
$107,102
67
$94,241
131
$87,216
50
$34,122
13
$86,160
35
$60,644
APPLICATIONS APPROVED, NOT ACCEPTED
0
$0
13
$75,301
32
$95,862
7
$41,453
1
$53,430
6
$62,277
APPLICATIONS DENIED
0
$0
24
$73,910
140
$101,220
47
$36,582
6
$36,457
35
$76,160
APPLICATIONS WITHDRAWN
1
$83,930
11
$108,927
75
$105,865
11
$110,957
2
$57,865
8
$88,724
FILES CLOSED FOR INCOMPLETENESS
0
$0
0
$0
19
$119,756
2
$59,390
0
$0
1
$94,750
Aggregated Statistics For Year 2004 (Based on 8 partial tracts)
A) FHA, FSA/RHS & VA Home Purchase Loans
B) Conventional Home Purchase Loans
C) Refinancings
D) Home Improvement Loans
E) Loans on Dwellings For 5+ Families
F) Non-occupant Loans on < 5 Family Dwellings (A B C & D)
G) Loans On Manufactured Home Dwelling (A B C & D)
Number
Average Value
Number
Average Value
Number
Average Value
Number
Average Value
Number
Average Value
Number
Average Value
Number
Average Value
LOANS ORIGINATED
6
$90,510
61
$112,991
148
$86,869
46
$34,335
0
$0
4
$69,040
25
$75,024
APPLICATIONS APPROVED, NOT ACCEPTED
1
$105,130
6
$101,690
25
$93,076
4
$53,212
0
$0
0
$0
6
$86,328
APPLICATIONS DENIED
0
$0
26
$81,020
146
$92,280
39
$30,258
0
$0
12
$24,812
33
$65,331
APPLICATIONS WITHDRAWN
1
$78,880
13
$95,841
88
$102,606
8
$54,370
1
$93,680
2
$144,635
14
$71,542
FILES CLOSED FOR INCOMPLETENESS
0
$0
2
$111,790
28
$112,440
4
$68,722
0
$0
0
$0
0
$0
Aggregated Statistics For Year 2003 (Based on 8 partial tracts)
A) FHA, FSA/RHS & VA Home Purchase Loans
B) Conventional Home Purchase Loans
C) Refinancings
D) Home Improvement Loans
F) Non-occupant Loans on < 5 Family Dwellings (A B C & D)
Number
Average Value
Number
Average Value
Number
Average Value
Number
Average Value
Number
Average Value
LOANS ORIGINATED
4
$119,600
70
$87,135
299
$91,321
49
$25,915
13
$54,727
APPLICATIONS APPROVED, NOT ACCEPTED
0
$0
14
$71,921
64
$84,323
6
$32,938
1
$21,090
APPLICATIONS DENIED
1
$43,160
27
$67,406
201
$88,277
21
$23,093
4
$66,555
APPLICATIONS WITHDRAWN
2
$79,905
11
$95,183
69
$98,618
6
$20,455
1
$76,430
FILES CLOSED FOR INCOMPLETENESS
0
$0
2
$76,080
8
$102,761
1
$97,470
0
$0
Aggregated Statistics For Year 2002 (Based on 8 partial tracts)
A) FHA, FSA/RHS & VA Home Purchase Loans
B) Conventional Home Purchase Loans
C) Refinancings
D) Home Improvement Loans
F) Non-occupant Loans on < 5 Family Dwellings (A B C & D)
Number
Average Value
Number
Average Value
Number
Average Value
Number
Average Value
Number
Average Value
LOANS ORIGINATED
5
$94,184
59
$79,943
186
$81,980
43
$24,160
8
$54,001
APPLICATIONS APPROVED, NOT ACCEPTED
0
$0
19
$52,871
72
$79,591
7
$37,064
1
$63,800
APPLICATIONS DENIED
1
$54,190
30
$49,894
140
$79,483
22
$22,866
4
$51,150
APPLICATIONS WITHDRAWN
1
$91,320
15
$81,595
79
$94,783
3
$26,380
1
$146,330
FILES CLOSED FOR INCOMPLETENESS
0
$0
1
$98,800
19
$94,409
0
$0
0
$0
Aggregated Statistics For Year 2001 (Based on 8 partial tracts)
A) FHA, FSA/RHS & VA Home Purchase Loans
B) Conventional Home Purchase Loans
C) Refinancings
D) Home Improvement Loans
F) Non-occupant Loans on < 5 Family Dwellings (A B C & D)
Number
Average Value
Number
Average Value
Number
Average Value
Number
Average Value
Number
Average Value
LOANS ORIGINATED
2
$83,685
54
$84,221
170
$75,438
63
$21,752
4
$50,718
APPLICATIONS APPROVED, NOT ACCEPTED
0
$0
25
$57,522
64
$64,990
16
$30,963
1
$17,620
APPLICATIONS DENIED
1
$41,960
45
$50,416
141
$67,205
22
$19,136
2
$28,265
APPLICATIONS WITHDRAWN
1
$47,760
3
$49,760
98
$89,680
10
$46,305
2
$37,040
FILES CLOSED FOR INCOMPLETENESS
0
$0
1
$25,320
14
$82,283
2
$43,075
0
$0
Aggregated Statistics For Year 2000 (Based on 8 partial tracts)
A) FHA, FSA/RHS & VA Home Purchase Loans
B) Conventional Home Purchase Loans
C) Refinancings
D) Home Improvement Loans
F) Non-occupant Loans on < 5 Family Dwellings (A B C & D)
Number
Average Value
Number
Average Value
Number
Average Value
Number
Average Value
Number
Average Value
LOANS ORIGINATED
5
$87,454
82
$60,839
89
$61,152
48
$15,585
7
$51,021
APPLICATIONS APPROVED, NOT ACCEPTED
0
$0
24
$53,232
39
$62,806
16
$22,156
1
$40,270
APPLICATIONS DENIED
3
$66,430
53
$45,722
87
$57,480
27
$22,654
1
$38,020
APPLICATIONS WITHDRAWN
1
$41,330
8
$65,155
34
$62,762
3
$22,650
1
$15,260
FILES CLOSED FOR INCOMPLETENESS
0
$0
1
$69,440
8
$76,269
0
$0
1
$50,510
Aggregated Statistics For Year 1999 (Based on 4 partial tracts)
A) FHA, FSA/RHS & VA Home Purchase Loans
B) Conventional Home Purchase Loans
C) Refinancings
D) Home Improvement Loans
E) Loans on Dwellings For 5+ Families
F) Non-occupant Loans on < 5 Family Dwellings (A B C & D)


 Nearest zip codes: 16048, 16040, 16020, 16001, 16050, 16029.