Estimated zip code population in 2022: 3,884 Zip code population in 2010: 3,886 Zip code population in 2000: 3,898
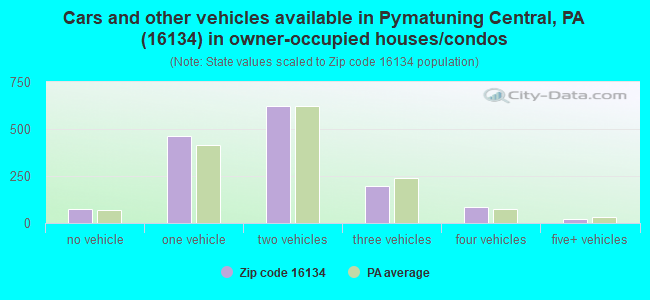
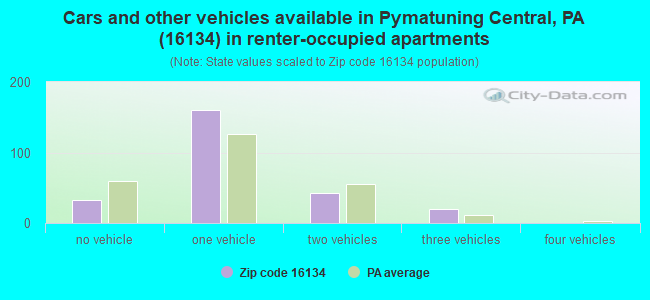
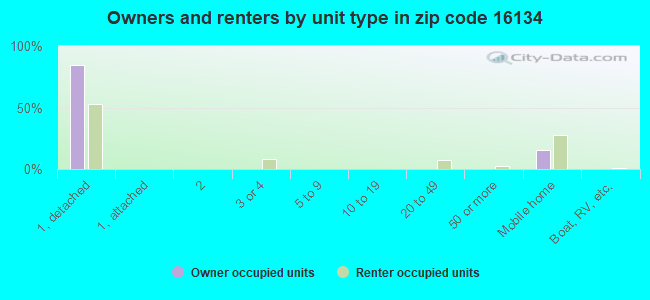
Houses and condos: 2,643 Renter-occupied apartments: 254
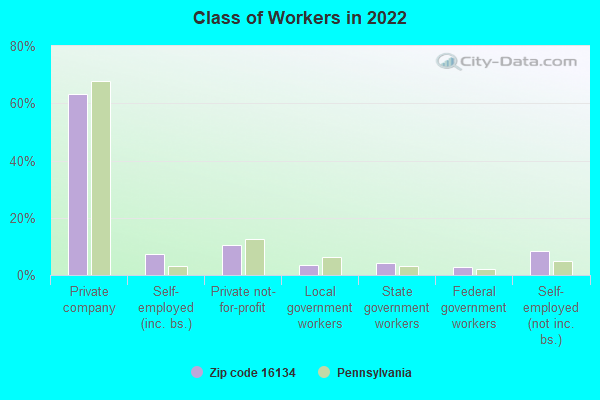
% of renters here:
15%
State:
31%
March 2022 cost of living index in zip code 16134: 91.0 (less than average, U.S. average is 100)
Land area: 46.8 sq. mi. Water area: 5.6 sq. mi.
Population density: 83 people per square mile
(very low).
OSM Map
General Map
Google Map
MSN Map
OSM Map
General Map
Google Map
MSN Map
OSM Map
General Map
Google Map
MSN Map
OSM Map
General Map
Google Map
MSN Map
Please wait while loading the map...
Real estate property taxes paid for housing units in 2022:
This zip code:
1.2% ($1,613)
Pennsylvania:
1.3% ($3,094)
Median real estate property taxes paid for housing units with mortgages in 2022: $1,787 (1.3%) Median real estate property taxes paid for housing units with no mortgage in 2022: $1,489 (1.2%)
Business Search- 14 Million verified businesses
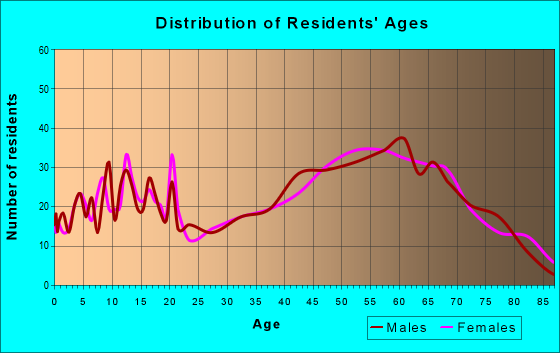
Males: 1,971
(50.8%)
Females: 1,913
(49.2%)
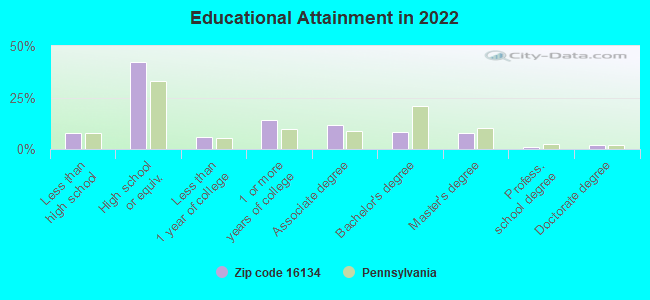
For population 25 years and over in 16134:
High school or higher: 91.2%
Bachelor's degree or higher: 18.9%
Graduate or professional degree: 10.5%
Unemployed: 4.6%
Mean travel time to work (commute): 28.1 minutes
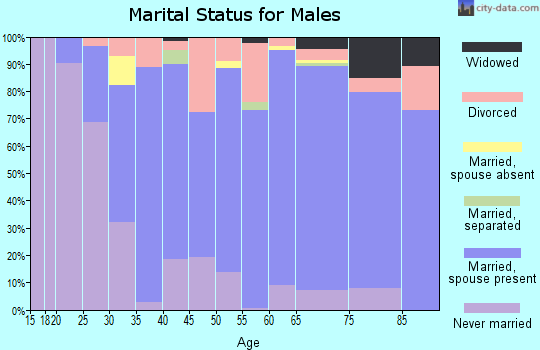
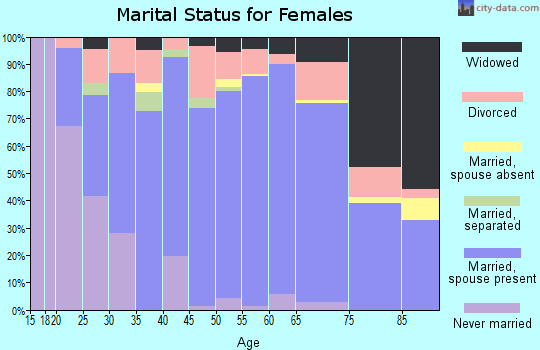
For population 15 years and over in 16134:
Never married: 16.6%
Now married: 61.4%
Separated: 1.4%
Widowed: 7.4%
Divorced: 13.3%
Zip code 16134 compared to state average:
Median house value below state average.
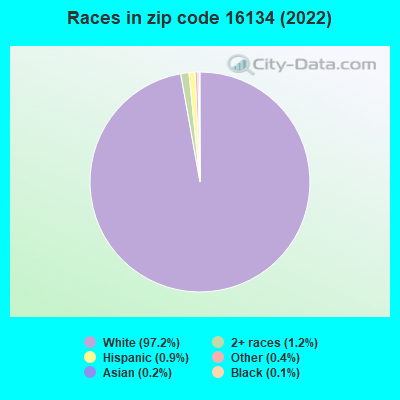
Black race population percentage significantly below state average.
Hispanic race population percentage significantly below state average.
Median age significantly above state average.
Foreign-born population percentage significantly below state average.
Renting percentage below state average.
Length of stay since moving in significantly above state average.
Percentage of population with a bachelor's degree or higher below state average.
Estimated median house/condo value in 2022: $133,386
16134:
$133,386
Pennsylvania:
$245,500
According to our research of Pennsylvania and other state lists, there were 6 registered sex offenders living in 16134 zip code as of May 20, 2024. The ratio of all residents to sex offenders in zip code 16134 is 670 to 1. The ratio of registered sex offenders to all residents in this zip code is near the state average.
Median resident age:
This zip code:
51.7 years
Pennsylvania median age:
40.9 years
Average household size:
This zip code:
2.3 people
Pennsylvania:
2.4 people
Averages for the 2020 tax year for zip code 16134, filed in 2021:
Average Adjusted Gross Income (AGI) in 2020: $51,688 (Individual Income Tax Returns)
Here:
$51,688
State:
$75,707
Salary/wage: $43,981 (reported on 69.7% of returns)
Here:
$43,981
State:
$62,806
(% of AGI for various income ranges: 927.1% for AGIs below $25k, 2961.9% for AGIs $25k-50k, 5708.3% for AGIs $50k-75k, 8397.7% for AGIs $75k-100k, 13046.4% for AGIs $100k-200k)
Taxable interest for individuals: $1,104 (reported on 28.1% of returns)
This zip code:
$1,104
Pennsylvania:
$1,633
(% of AGI for various income ranges: 23.2% for AGIs below $25k, 31.9% for AGIs $25k-50k, 47.8% for AGIs $50k-75k, 24.6% for AGIs $75k-100k, 203.6% for AGIs $100k-200k)
Ordinary dividends: $2,711 (reported on 19.7% of returns)
Here:
$2,711
State:
$7,382
(% of AGI for various income ranges: 32.0% for AGIs below $25k, 36.7% for AGIs $25k-50k, 90.6% for AGIs $50k-75k, 101.5% for AGIs $75k-100k, 355.5% for AGIs $100k-200k)
Net capital gain/loss in AGI: +$7,637 (reported on 16.9% of returns)
Here:
+$7,637
State:
+$23,522
(% of AGI for various income ranges: 28.0% for AGIs below $25k, 32.8% for AGIs $25k-50k, 182.8% for AGIs $50k-75k, 258.5% for AGIs $75k-100k, 1266.4% for AGIs $100k-200k)
Profit/loss from business: +$11,830 (reported on 12.9% of returns)
Here:
+$11,830
State:
+$16,274
(% of AGI for various income ranges: 93.2% for AGIs below $25k, 193.6% for AGIs $25k-50k, 288.9% for AGIs $50k-75k, 240.8% for AGIs $75k-100k, 735.5% for AGIs $100k-200k)
Taxable individual retirement arrangement distribution: $15,430 (reported on 16.9% of returns)
16134:
$15,430
Pennsylvania:
$18,583
(% of AGI for various income ranges: 158.5% for AGIs below $25k, 181.7% for AGIs $25k-50k, 363.3% for AGIs $50k-75k, 423.8% for AGIs $75k-100k, 1927.3% for AGIs $100k-200k)
Total itemized deductions: $33,033 (reported on 1.7% of returns)
Here:
$33,033
State:
$34,850
(% of AGI for various income ranges: 762.3% for AGIs $75k-100k)
Taxes paid: $6,933 (reported on 1.7% of returns)
16134:
$6,933
State:
$8,200
(% of AGI for various income ranges: 160.0% for AGIs $75k-100k)
Earned income credit: $2,095 (reported on 11.8% of returns)
Here:
$2,095
State:
$2,100
(% of AGI for various income ranges: 62.4% for AGIs below $25k, 51.1% for AGIs $25k-50k)
Percentage of individuals using paid preparers for their 2020 taxes: 94.4%
Here:
94%
State:
92%
(% for various income ranges: 93.9% for AGIs below $25k, 93.6% for AGIs $25k-50k, 92.6% for AGIs $50k-75k, 94.4% for AGIs $75k-100k, 100.0% for AGIs $100k-200k, 100.0% for AGIs over 200k)
Averages for the 2012 tax year for zip code 16134, filed in 2013:
Average Adjusted Gross Income (AGI) in 2012: $41,611 (Individual Income Tax Returns)
Here:
$41,611
State:
$61,346
Salary/wage: $36,427 (reported on 74.0% of returns)
Here:
$36,427
State:
$51,902
(% of AGI for various income ranges: 60.5% for AGIs below $25k, 70.3% for AGIs $25k-50k, 68.8% for AGIs $50k-75k, 70.1% for AGIs $75k-100k, 54.3% for AGIs $100k-200k)
Taxable interest for individuals: $857 (reported on 35.6% of returns)
This zip code:
$857
Pennsylvania:
$1,588
(% of AGI for various income ranges: 1.6% for AGIs below $25k, 0.8% for AGIs $25k-50k, 0.8% for AGIs $50k-75k, 0.4% for AGIs $75k-100k, 0.5% for AGIs $100k-200k)
Ordinary dividends: $2,181 (reported on 20.9% of returns)
Here:
$2,181
State:
$5,827
(% of AGI for various income ranges: 1.7% for AGIs below $25k, 1.2% for AGIs $25k-50k, 1.2% for AGIs $50k-75k, 0.4% for AGIs $75k-100k, 1.1% for AGIs $100k-200k)
Net capital gain/loss in AGI: +$2,118 (reported on 12.4% of returns)
Here:
+$2,118
State:
+$14,495
(% of AGI for various income ranges: 0.9% for AGIs below $25k, 1.3% for AGIs $50k-75k, 1.0% for AGIs $75k-100k, 0.3% for AGIs $100k-200k)
Profit/loss from business: +$9,505 (reported on 12.4% of returns)
Here:
+$9,505
State:
+$16,268
(% of AGI for various income ranges: 5.3% for AGIs below $25k, 3.4% for AGIs $25k-50k, 1.5% for AGIs $50k-75k, 5.9% for AGIs $75k-100k)
Taxable individual retirement arrangement distribution: $9,325 (reported on 15.8% of returns)
16134:
$9,325
Pennsylvania:
$14,550
(% of AGI for various income ranges: 6.0% for AGIs below $25k, 3.4% for AGIs $25k-50k, 4.2% for AGIs $50k-75k, 5.9% for AGIs $75k-100k)
Total itemized deductions: $18,764 (21% of AGI, reported on 14.1% of returns)
Here:
$18,764
State:
$23,538
Here:
20.8% of AGI
State:
18.4% of AGI
(% of AGI for various income ranges: 4.8% for AGIs below $25k, 4.9% for AGIs $25k-50k, 5.2% for AGIs $50k-75k, 6.6% for AGIs $75k-100k, 9.4% for AGIs $100k-200k)
Charity contributions: $3,694 (reported on 9.6% of returns)
Here:
$3,694
State:
$4,025
(% of AGI for various income ranges: 0.7% for AGIs $25k-50k, 0.9% for AGIs $50k-75k, 0.7% for AGIs $75k-100k, 1.5% for AGIs $100k-200k)
Taxes paid: $6,136 (reported on 14.1% of returns)
16134:
$6,136
State:
$9,982
(% of AGI for various income ranges: 1.1% for AGIs below $25k, 1.1% for AGIs $25k-50k, 1.4% for AGIs $50k-75k, 2.3% for AGIs $75k-100k, 4.0% for AGIs $100k-200k)
Earned income credit: $1,917 (reported on 16.4% of returns)
Here:
$1,917
State:
$2,106
(% of AGI for various income ranges: 4.5% for AGIs below $25k, 0.9% for AGIs $25k-50k)
Percentage of individuals using paid preparers for their 2012 taxes: 62.1%
Here:
62%
State:
53%
(% for various income ranges: 59.5% for AGIs below $25k, 63.6% for AGIs $25k-50k, 66.7% for AGIs $50k-75k, 62.5% for AGIs $75k-100k, 63.6% for AGIs $100k-200k)
Averages for the 2004 tax year for zip code 16134, filed in 2005:
Average Adjusted Gross Income (AGI) in 2004: $32,508 (Individual Income Tax Returns)
Here:
$32,508
State:
$48,049
Salary/wage: $29,759 (reported on 79.1% of returns)
Here:
$29,759
State:
$42,646
(% of AGI for various income ranges: 86.7% for AGIs below $10k, 65.6% for AGIs $10k-25k, 73.3% for AGIs $25k-50k, 79.9% for AGIs $50k-75k, 74.4% for AGIs $75k-100k, 58.4% for AGIs over 100k)
Taxable interest for individuals: $1,012 (reported on 46.8% of returns)
This zip code:
$1,012
Pennsylvania:
$1,657
(% of AGI for various income ranges: 6.4% for AGIs below $10k, 2.1% for AGIs $10k-25k, 1.3% for AGIs $25k-50k, 1.1% for AGIs $50k-75k, 1.1% for AGIs $75k-100k, 1.0% for AGIs over 100k)
Taxable dividends: $1,886 (reported on 24.0% of returns)
Here:
$1,886
State:
$3,566
(% of AGI for various income ranges: 4.9% for AGIs below $10k, 1.5% for AGIs $10k-25k, 1.5% for AGIs $25k-50k, 1.3% for AGIs $50k-75k, 0.8% for AGIs $75k-100k, 1.2% for AGIs over 100k)
Net capital gain/loss: +$5,127 (reported on 15.9% of returns)
Here:
+$5,127
State:
+$9,716
(% of AGI for various income ranges: -1.6% for AGIs below $10k, 1.0% for AGIs $10k-25k, 0.8% for AGIs $25k-50k, 1.3% for AGIs $50k-75k, 3.5% for AGIs $75k-100k, 10.3% for AGIs over 100k)
Profit/loss from business: +$7,356 (reported on 14.6% of returns)
Here:
+$7,356
State:
+$14,267
(% of AGI for various income ranges: 3.4% for AGIs below $10k, 5.8% for AGIs $10k-25k, 1.9% for AGIs $25k-50k, 3.9% for AGIs $50k-75k, 5.9% for AGIs over 100k)
IRA payment deduction: $2,680 (reported on 2.8% of returns)
16134:
$2,680
Pennsylvania:
$2,903
Total itemized deductions: $14,997 (24% of AGI, reported on 17.2% of returns)
Here:
$14,997
State:
$18,804
Here:
23.5% of AGI
State:
19.5% of AGI
(% of AGI for various income ranges: 8.2% for AGIs below $10k, 7.3% for AGIs $10k-25k, 7.3% for AGIs $25k-50k, 6.0% for AGIs $50k-75k, 9.5% for AGIs $75k-100k, 12.3% for AGIs over 100k)
Charity contributions deductions: $2,549 (4% of AGI, reported on 13.2% of returns)
Here:
$2,549
State:
$3,337
Here:
3.7% of AGI
State:
3.3% of AGI
(% of AGI for various income ranges: 0.6% for AGIs $10k-25k, 0.5% for AGIs $25k-50k, 0.9% for AGIs $50k-75k, 1.0% for AGIs $75k-100k, 3.1% for AGIs over 100k)
Total tax: $3,961 (reported on 69.7% of returns)
16134:
$3,961
State:
$8,008
(% of AGI for various income ranges: 2.2% for AGIs below $10k, 3.8% for AGIs $10k-25k, 5.9% for AGIs $25k-50k, 8.9% for AGIs $50k-75k, 11.3% for AGIs $75k-100k, 17.0% for AGIs over 100k)
Earned income credit: $1,650 (reported on 15.8% of returns)
Here:
$1,650
State:
$1,643
Percentage of individuals using paid preparers for their 2004 taxes: 60.7%
Here:
61%
State:
56%
(% for various income ranges: 51.0% for AGIs below $10k, 62.4% for AGIs $10k-25k, 68.5% for AGIs $25k-50k, 57.7% for AGIs $50k-75k, 59.8% for AGIs $75k-100k, 68.6% for AGIs over 100k)
Likely homosexual households (counted as self-reported same-sex unmarried-partner households)
Lesbian couples: 0.0% of all households
Gay men: 0.1% of all households
Household received Food Stamps/SNAP in the past 12 months: 300 Household did not receive Food Stamps/SNAP in the past 12 months: 1,415
Women who had a birth in the past 12 months: 57 (48 now married, 10 unmarried) Women who did not have a birth in the past 12 months: 634 (341 now married, 290 unmarried)
Housing units in zip code 16134 with a mortgage: 685 (124 second mortgage, 3 home equity loan, 120 both second mortgage and home equity loan) Houses without a mortgage: 30
Median monthly owner costs for units with a mortgage: $1,247 Median monthly owner costs for units without a mortgage: $425
Residents with income below the poverty level in 2022:
This zip code:
13.1%
Whole state:
11.8%
Residents with income below 50% of the poverty level in 2022:
This zip code:
10.3%
Whole state:
6.1%
Median number of rooms in houses and condos:
Here:
6.5
State:
6.8
Median number of rooms in apartments:
Here:
5.0
State:
4.3
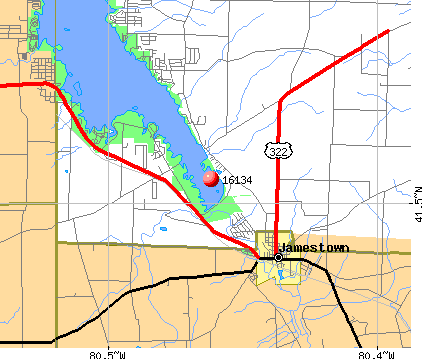
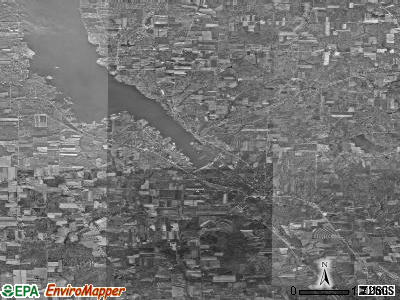
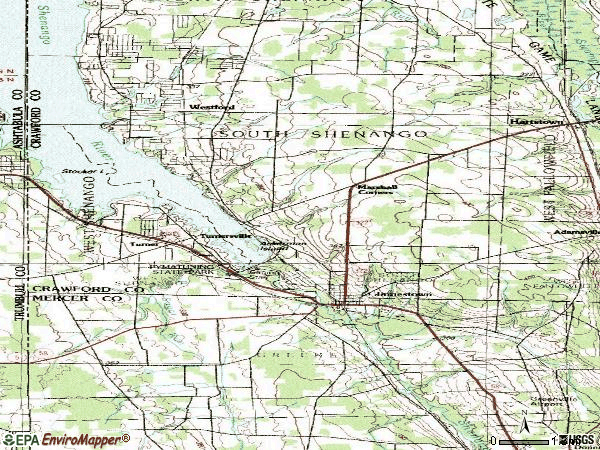
Notable locations in this zip code not listed on our city pages
Notable locations in zip code 16134: Walnut Creek Golf Course (A), Marshall Corners (B), Jamestown Volunteer Fire Department (C). Display/hide their locations on the map
In group quarters: 20 (-1 institutionalized population)
Size of family households: 665 2-persons, 236 3-persons, 150 4-persons, 27 5-persons, 15 6-persons, 87 7-or-more-persons
Size of nonfamily households: 468 1-person, 57 2-persons, 7 3-persons
367 married couples with children.
134 single-parent households (31 men, 103 women).
95.0% of residents of 16134 zip code speak English at home.
0.2% of residents speak Spanish at home (100% very well).
4.7% of residents speak other Indo-European language at home (82% very well, 9% well, 9% not well).
0.1% of residents speak other language at home (75% well, 25% not at all).
Foreign born population: 34 (0.9%) (55.5% of them are naturalized citizens)
This zip code:
0.9%
Whole state:
7.5%
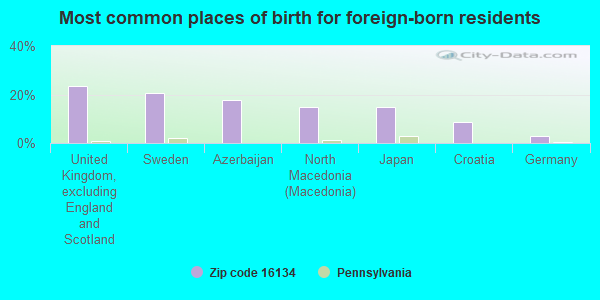
24%United Kingdom, excluding England and Scotland
21%Sweden
18%Azerbaijan
15%North Macedonia (Macedonia)
15%Japan
9%Croatia
3%Germany
21%American
16%German
14%English
14%Irish
6%Polish
4%Italian
2%European
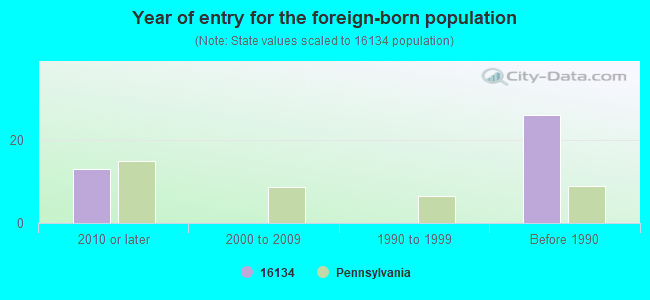
Year of entry for the foreign-born population
132010 or later
02000 to 2009
01990 to 1999
26Before 1990
Facilities with environmental interests located in this zip code:
C G WOOD SITE (SOUTHERN END OF CHESTNUT STREET in JAMESTOWN, PA)
SUPERFUND (Superfund database)
Housing units lacking complete plumbing facilities: 1.4% Housing units lacking complete kitchen facilities: 1.5%
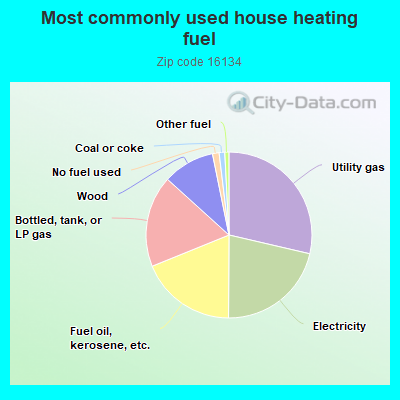
28.7%Utility gas
21.5%Electricity
18.8%Fuel oil, kerosene, etc.
17.9%Bottled, tank, or LP gas
10.1%Wood
1.3%No fuel used
1.1%Coal or coke
0.8%Other fuel
Population in 1990: 3,328. Population change in the 1990s: +570 (+17.1%).
Place of birth for U.S.-born residents:
This state: 2,908
Northeast: 83
Midwest: 632
South: 173
West: 41
66% of the 16134 zip code residents lived in the same house 5 years ago. Out of people who lived in different houses, 33% lived in this county. Out of people who lived in different counties, 50% lived in Pennsylvania.
93% of the 16134 zip code residents lived in the same house 1 year ago. Out of people who lived in different houses, 46% moved from this county. Out of people who lived in different houses, 25% moved from different county within same state. Out of people who lived in different houses, 27% moved from different state. Out of people who lived in different houses, 3% moved from abroad.
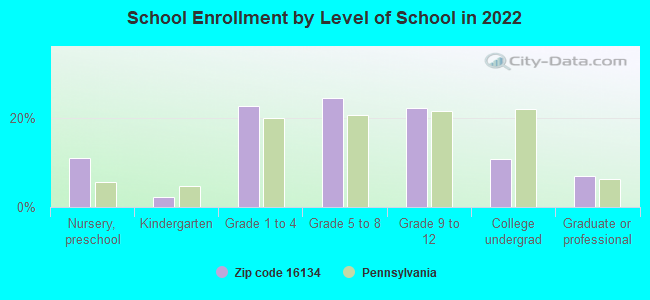
Private vs. public school enrollment:
Students in private schools in grades 1 to 8 (elementary and middle school): 111
Here:
31.7%
Pennsylvania:
15.7%
Students in private schools in grades 9 to 12 (high school): 15
Here:
9.5%
Pennsylvania:
13.4%
Students in private undergraduate colleges: 36
Here:
44.9%
Pennsylvania:
39.8%
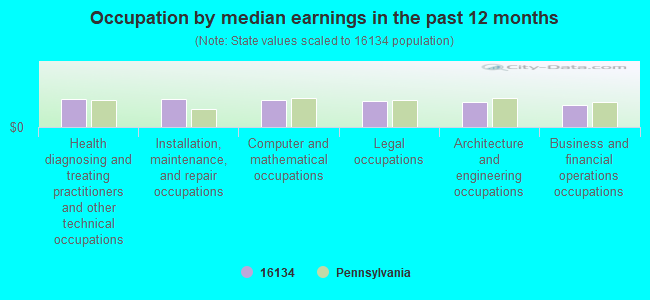
Occupation by median earnings in the past 12 months ($)
82,261Health diagnosing and treating practitioners and other technical occupations
81,705Installation, maintenance, and repair occupations
77,703Computer and mathematical occupations
75,492Legal occupations
72,169Architecture and engineering occupations
64,940Business and financial operations occupations
Companies with federal contracts located in this zip code:
M DAVIDSON AND ASSOCIATES, IN (1944 WEST LAKE ROAD in JAMESTOWN, PA; small business) : $330,744 in 42 contractsfrom 2000 to 2006
Contracts for Waste Treatment and Storage, Facilities Operations Support Services by U.S. Army Corps of Engineers - civil program financing only, Army Signed by year:2000: $43,680; 2001: $37,449; 2002: $44,880; 2003: $51,425; 2004: $89,026; 2005: $47,572; 2006: $16,712.
Biggest contracts:
$46,160 with U.S. Army Corps of Engineers - civil program financing only for Waste Treatment and Storage. Signed on 2004-05-06. Completion date: 2004-05-22.
$46,160 with Army for Waste Treatment and Storage. Signed on 2004-05-06. Completion date: 2004-05-22.
$45,520 with U.S. Army Corps of Engineers - civil program financing only for Waste Treatment and Storage. Signed on 2003-05-19. Completion date: 2004-05-22.
$44,880, same as above.Signed on 2002-05-24. Completion date: 2003-05-22.
COMBINED TACTICAL SYSTEMS INC (388 KINSMAN RD in JAMESTOWN, PA; small business) 100 employees, $0 revenue. : $13,756 in 5 contractsfrom 2005 to 2006
Contracts for Other Education and Training Services, Cartridge and Propellant Actuated Devices and Components, Miscellaneous Ammunition, Specialized Ammunition Handling Servicing Equipment by Army, Bureau of Prisoners/Federal Prison System Signed by year:2000: $0; 2001: $0; 2002: $0; 2003: $0; 2004: $0; 2005: $10,152; 2006: $3,604.
Biggest contracts:
$5,000 with Army for Other Education and Training Services. Taking place in VA. Signed on 2005-06-21. Completion date: 2005-07-18.
$3,656 with Bureau of Prisoners/Federal Prison System for Cartridge and Propellant Actuated Devices and Components. Taking place in FL. Signed on 2005-04-15. Completion date: 2005-05-30.
$3,604 with Bureau of Prisoners/Federal Prison System for Miscellaneous Ammunition. Taking place in TX. Signed on 2006-03-31. Completion date: 2006-04-30.
$1,296 with Bureau of Prisoners/Federal Prison System for Miscellaneous Ammunition. Taking place in CT. Signed on 2005-02-11. Completion date: 2005-02-24.
Top industries in this zip code by the number of employees in 2005:
Wholesale Trade: Medical, Dental, and Hospital Equipment and Supplies Merchant Wholesalers (20-49 employees: 1 establishment)
Construction: Electrical Contractors (20-49: 1)
Accommodation and Food Services: Full-Service Restaurants (10-19: 1, 1-4: 3)
Accommodation and Food Services: Limited-Service Restaurants (5-9: 2, 1-4: 1)
Health Care and Social Assistance: Offices of Physicians (except Mental Health Specialists) (10-19: 1)
Other Services (except Public Administration): Other Social Advocacy Organizations (10-19: 1)
People in group quarters in 2010:
8 people in nursing facilities/skilled-nursing facilities
4 people in workers' group living quarters and job corps centers
2 people in group homes intended for adults
Fatal accident statistics in 2014:
Fatal accident count: 3
Vehicles involved in fatal accidents: 5
Fatal accidents caused by drunken drivers: 0
Fatalities: 3
Persons involved in fatal accidents: 7
Pedestrians involved in fatal accidents: 0
Fatal accident statistics in 2013:
Fatal accident count: 1
Vehicles involved in fatal accidents: 1
Fatal accidents caused by drunken drivers: 1
Fatalities: 1
Persons involved in fatal accidents: 1
Pedestrians involved in fatal accidents: 0
Home Mortgage Disclosure Act Aggregated Statistics For Year 2009 (Based on 2 partial tracts)
A) FHA, FSA/RHS & VA Home Purchase Loans
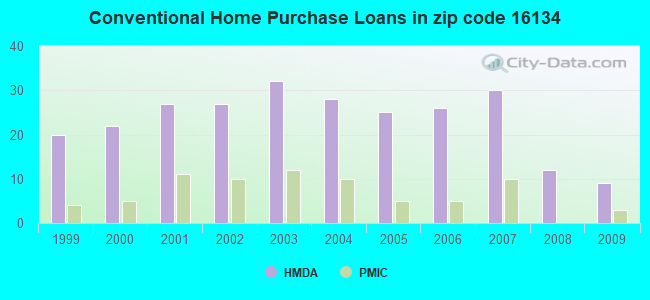
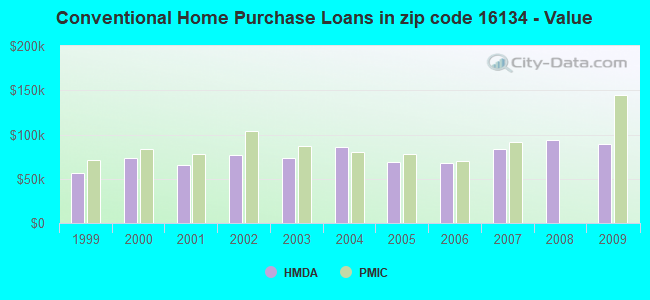
B) Conventional Home Purchase Loans
C) Refinancings
D) Home Improvement Loans
F) Non-occupant Loans on < 5 Family Dwellings (A B C & D)
G) Loans On Manufactured Home Dwelling (A B C & D)
Number
Average Value
Number
Average Value
Number
Average Value
Number
Average Value
Number
Average Value
Number
Average Value
LOANS ORIGINATED
5
$74,786
9
$89,818
45
$66,091
12
$54,974
2
$31,535
5
$20,338
APPLICATIONS APPROVED, NOT ACCEPTED
0
$0
1
$80,450
5
$50,716
1
$48,270
1
$12,870
1
$77,230
APPLICATIONS DENIED
3
$105,763
3
$66,933
14
$104,585
2
$9,010
1
$170,550
1
$186,000
APPLICATIONS WITHDRAWN
1
$37,970
0
$0
7
$84,220
0
$0
0
$0
1
$60,500
FILES CLOSED FOR INCOMPLETENESS
0
$0
0
$0
2
$92,035
0
$0
0
$0
0
$0
Aggregated Statistics For Year 2008 (Based on 2 partial tracts)
A) FHA, FSA/RHS & VA Home Purchase Loans
B) Conventional Home Purchase Loans
C) Refinancings
D) Home Improvement Loans
F) Non-occupant Loans on < 5 Family Dwellings (A B C & D)
G) Loans On Manufactured Home Dwelling (A B C & D)
Number
Average Value
Number
Average Value
Number
Average Value
Number
Average Value
Number
Average Value
Number
Average Value
LOANS ORIGINATED
6
$76,267
12
$93,429
38
$77,960
22
$39,991
4
$75,462
5
$51,616
APPLICATIONS APPROVED, NOT ACCEPTED
1
$47,630
1
$21,880
3
$60,070
1
$59,850
0
$0
0
$0
APPLICATIONS DENIED
0
$0
5
$78,262
24
$96,942
6
$64,682
2
$32,500
3
$66,290
APPLICATIONS WITHDRAWN
1
$37,330
1
$124,210
6
$118,208
1
$16,090
0
$0
0
$0
FILES CLOSED FOR INCOMPLETENESS
0
$0
0
$0
2
$100,400
1
$21,240
0
$0
0
$0
Aggregated Statistics For Year 2007 (Based on 2 partial tracts)
A) FHA, FSA/RHS & VA Home Purchase Loans
B) Conventional Home Purchase Loans
C) Refinancings
D) Home Improvement Loans
F) Non-occupant Loans on < 5 Family Dwellings (A B C & D)
G) Loans On Manufactured Home Dwelling (A B C & D)
Number
Average Value
Number
Average Value
Number
Average Value
Number
Average Value
Number
Average Value
Number
Average Value
LOANS ORIGINATED
5
$84,182
30
$83,732
45
$83,868
22
$35,895
5
$79,548
4
$40,225
APPLICATIONS APPROVED, NOT ACCEPTED
1
$25,100
3
$44,837
8
$91,712
1
$26,390
0
$0
1
$90,750
APPLICATIONS DENIED
0
$0
11
$71,674
38
$79,366
14
$43,443
3
$51,060
3
$74,443
APPLICATIONS WITHDRAWN
0
$0
6
$114,025
11
$94,025
2
$52,455
1
$166,050
0
$0
FILES CLOSED FOR INCOMPLETENESS
0
$0
1
$94,610
3
$97,827
0
$0
0
$0
0
$0
Aggregated Statistics For Year 2006 (Based on 2 partial tracts)
A) FHA, FSA/RHS & VA Home Purchase Loans
B) Conventional Home Purchase Loans
C) Refinancings
D) Home Improvement Loans
F) Non-occupant Loans on < 5 Family Dwellings (A B C & D)
G) Loans On Manufactured Home Dwelling (A B C & D)
Number
Average Value
Number
Average Value
Number
Average Value
Number
Average Value
Number
Average Value
Number
Average Value
LOANS ORIGINATED
3
$70,153
26
$68,271
50
$73,950
21
$28,349
4
$33,468
9
$59,282
APPLICATIONS APPROVED, NOT ACCEPTED
0
$0
5
$71,310
10
$75,108
5
$54,320
1
$5,150
0
$0
APPLICATIONS DENIED
1
$31,540
11
$68,806
55
$84,206
15
$32,223
3
$39,903
6
$61,035
APPLICATIONS WITHDRAWN
0
$0
7
$58,200
30
$88,366
3
$85,383
1
$42,480
1
$81,090
FILES CLOSED FOR INCOMPLETENESS
0
$0
1
$30,890
5
$72,340
2
$59,210
0
$0
0
$0
Aggregated Statistics For Year 2005 (Based on 2 partial tracts)
A) FHA, FSA/RHS & VA Home Purchase Loans
B) Conventional Home Purchase Loans
C) Refinancings
D) Home Improvement Loans
E) Loans on Dwellings For 5+ Families
F) Non-occupant Loans on < 5 Family Dwellings (A B C & D)
G) Loans On Manufactured Home Dwelling (A B C & D)
Number
Average Value
Number
Average Value
Number
Average Value
Number
Average Value
Number
Average Value
Number
Average Value
Number
Average Value
LOANS ORIGINATED
3
$93,537
25
$68,402
51
$72,777
23
$45,416
0
$0
3
$67,793
5
$39,904
APPLICATIONS APPROVED, NOT ACCEPTED
0
$0
1
$47,630
12
$77,392
3
$38,187
0
$0
2
$36,040
1
$142,240
APPLICATIONS DENIED
0
$0
10
$58,117
59
$83,199
12
$44,945
0
$0
2
$91,390
2
$50,200
APPLICATIONS WITHDRAWN
1
$23,810
6
$129,042
33
$95,233
4
$99,435
1
$43,760
2
$128,720
1
$95,250
FILES CLOSED FOR INCOMPLETENESS
0
$0
0
$0
2
$95,895
0
$0
0
$0
0
$0
0
$0
Aggregated Statistics For Year 2004 (Based on 2 partial tracts)
B) Conventional Home Purchase Loans
C) Refinancings
D) Home Improvement Loans
F) Non-occupant Loans on < 5 Family Dwellings (A B C & D)
G) Loans On Manufactured Home Dwelling (A B C & D)
Number
Average Value
Number
Average Value
Number
Average Value
Number
Average Value
Number
Average Value
LOANS ORIGINATED
28
$86,174
72
$77,724
16
$33,869
7
$89,920
5
$52,132
APPLICATIONS APPROVED, NOT ACCEPTED
3
$97,613
21
$69,294
2
$73,370
1
$115,200
3
$97,613
APPLICATIONS DENIED
8
$57,039
50
$77,078
15
$24,285
3
$30,250
8
$58,729
APPLICATIONS WITHDRAWN
3
$102,977
26
$86,837
2
$42,480
0
$0
1
$32,180
FILES CLOSED FOR INCOMPLETENESS
1
$134,510
10
$102,525
1
$9,650
0
$0
0
$0
Aggregated Statistics For Year 2003 (Based on 2 partial tracts)
A) FHA, FSA/RHS & VA Home Purchase Loans
B) Conventional Home Purchase Loans
C) Refinancings
D) Home Improvement Loans
F) Non-occupant Loans on < 5 Family Dwellings (A B C & D)
Number
Average Value
Number
Average Value
Number
Average Value
Number
Average Value
Number
Average Value
LOANS ORIGINATED
0
$0
32
$72,968
140
$70,782
33
$40,410
5
$68,608
APPLICATIONS APPROVED, NOT ACCEPTED
0
$0
5
$69,122
28
$91,253
3
$32,180
0
$0
APPLICATIONS DENIED
1
$93,320
6
$53,740
64
$77,896
7
$24,549
2
$89,780
APPLICATIONS WITHDRAWN
1
$142,880
6
$68,543
27
$85,718
0
$0
0
$0
FILES CLOSED FOR INCOMPLETENESS
0
$0
1
$55,990
3
$99,113
0
$0
0
$0
Aggregated Statistics For Year 2002 (Based on 2 partial tracts)
A) FHA, FSA/RHS & VA Home Purchase Loans
B) Conventional Home Purchase Loans
C) Refinancings
D) Home Improvement Loans
F) Non-occupant Loans on < 5 Family Dwellings (A B C & D)
Number
Average Value
Number
Average Value
Number
Average Value
Number
Average Value
Number
Average Value
LOANS ORIGINATED
2
$67,580
27
$77,399
86
$66,276
15
$38,745
5
$84,956
APPLICATIONS APPROVED, NOT ACCEPTED
0
$0
3
$39,903
23
$68,697
5
$24,200
0
$0
APPLICATIONS DENIED
3
$70,797
8
$35,639
52
$67,788
8
$26,468
1
$67,580
APPLICATIONS WITHDRAWN
1
$50,840
4
$84,472
18
$63,573
2
$37,005
0
$0
FILES CLOSED FOR INCOMPLETENESS
0
$0
0
$0
8
$71,440
1
$12,870
0
$0
Aggregated Statistics For Year 2001 (Based on 2 partial tracts)
A) FHA, FSA/RHS & VA Home Purchase Loans
B) Conventional Home Purchase Loans
C) Refinancings
D) Home Improvement Loans
F) Non-occupant Loans on < 5 Family Dwellings (A B C & D)
Number
Average Value
Number
Average Value
Number
Average Value
Number
Average Value
Number
Average Value
LOANS ORIGINATED
3
$87,317
27
$65,552
110
$59,024
31
$22,879
4
$42,960
APPLICATIONS APPROVED, NOT ACCEPTED
0
$0
3
$87,317
23
$52,523
5
$34,110
0
$0
APPLICATIONS DENIED
0
$0
10
$28,640
53
$57,487
10
$20,080
1
$4,510
APPLICATIONS WITHDRAWN
0
$0
5
$64,618
16
$78,801
1
$18,020
0
$0
FILES CLOSED FOR INCOMPLETENESS
0
$0
1
$31,540
4
$75,462
1
$12,870
0
$0
Aggregated Statistics For Year 2000 (Based on 2 partial tracts)
A) FHA, FSA/RHS & VA Home Purchase Loans
B) Conventional Home Purchase Loans
C) Refinancings
D) Home Improvement Loans
F) Non-occupant Loans on < 5 Family Dwellings (A B C & D)
Number
Average Value
Number
Average Value
Number
Average Value
Number
Average Value
Number
Average Value
LOANS ORIGINATED
3
$70,153
22
$73,253
45
$57,538
24
$21,319
2
$107,480
APPLICATIONS APPROVED, NOT ACCEPTED
0
$0
2
$61,785
15
$50,201
5
$8,366
0
$0
APPLICATIONS DENIED
0
$0
6
$50,630
25
$53,625
12
$17,217
1
$82,380
APPLICATIONS WITHDRAWN
1
$77,230
3
$59,427
9
$47,269
3
$28,747
1
$12,870
FILES CLOSED FOR INCOMPLETENESS
0
$0
1
$99,110
1
$26,390
0
$0
0
$0
Aggregated Statistics For Year 1999 (Based on 1 partial tract)
B) Conventional Home Purchase Loans
C) Refinancings
D) Home Improvement Loans
F) Non-occupant Loans on < 5 Family Dwellings (A B C & D)
Detailed PMIC statistics for the following Tracts:0320.00
2003 - 2018 National Fire Incident Reporting System (NFIRS) incidents
According to the data from the years 2003 - 2018 the average number of fires per year is 29. The highest number of reported fires - 56 took place in 2015, and the least - 9 in 2003. The data has a growing trend.
When looking into fire subcategories, the most incidents belonged to: Structure Fires (69.7%), and Mobile Property/Vehicle Fires (14.1%).
Fire incident types reported to NFIRS in Zip Code 16134


 Nearest zip codes: 16110, 16131, 44428, 44093, 44003, 16424.


 According to the data from the years 2003 - 2018 the average number of fires per year is 29. The highest number of reported fires - 56 took place in 2015, and the least - 9 in 2003. The data has a growing trend.
 When looking into fire subcategories, the most incidents belonged to: Structure Fires (69.7%), and Mobile Property/Vehicle Fires (14.1%).