Estimated zip code population in 2022: 1,601 Zip code population in 2010: 1,533 Zip code population in 2000: 1,607
Houses and condos: 767 Renter-occupied apartments: 123
% of renters here:
19%
State:
31%
March 2022 cost of living index in zip code 16240: 90.6 (less than average, U.S. average is 100)
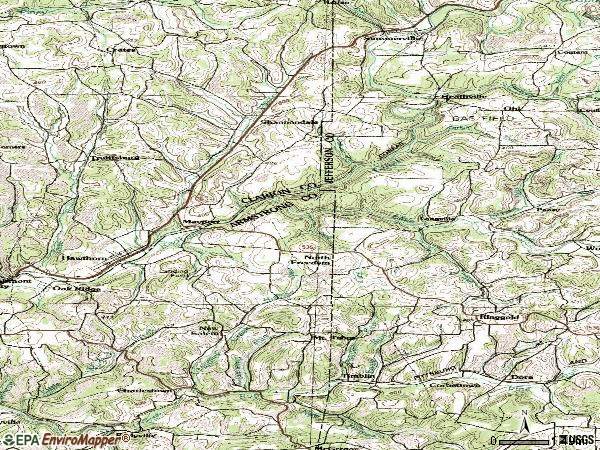
Land area: 53.7 sq. mi. Water area: 0.4 sq. mi.
Population density: 30 people per square mile
(very low).
OSM Map
General Map
Google Map
MSN Map
OSM Map
General Map
Google Map
MSN Map
OSM Map
General Map
Google Map
MSN Map
OSM Map
General Map
Google Map
MSN Map
Please wait while loading the map...
Real estate property taxes paid for housing units in 2022:
This zip code:
1.0% ($1,484)
Pennsylvania:
1.3% ($3,094)
Median real estate property taxes paid for housing units with mortgages in 2022: $1,662 (1.0%) Median real estate property taxes paid for housing units with no mortgage in 2022: $1,262 (1.0%)
Business Search- 14 Million verified businesses
Males: 818
(51.1%)
Females: 783
(48.9%)
For population 25 years and over in 16240:
High school or higher: 89.8%
Bachelor's degree or higher: 12.0%
Graduate or professional degree: 4.6%
Unemployed: 1.7%
Mean travel time to work (commute): 32.5 minutes
For population 15 years and over in 16240:
Never married: 25.6%
Now married: 63.0%
Separated: 2.0%
Widowed: 6.0%
Divorced: 3.4%
Zip code 16240 compared to state average:
Median house value below state average.
Unemployed percentage below state average.
Black race population percentage significantly below state average.
Hispanic race population percentage significantly below state average.
Foreign-born population percentage significantly below state average.
Renting percentage below state average.
Length of stay since moving in significantly above state average.
Number of college students below state average.
Percentage of population with a bachelor's degree or higher significantly below state average.
Averages for the 2020 tax year for zip code 16240, filed in 2021:
Average Adjusted Gross Income (AGI) in 2020: $50,300 (Individual Income Tax Returns)
Here:
$50,300
State:
$75,707
Salary/wage: $45,517 (reported on 73.0% of returns)
Here:
$45,517
State:
$62,806
(% of AGI for various income ranges: 990.0% for AGIs below $25k, 3234.2% for AGIs $25k-50k, 6115.0% for AGIs $50k-75k, 9882.5% for AGIs $75k-100k, 17312.5% for AGIs $100k-200k)
Taxable interest for individuals: $925 (reported on 38.1% of returns)
This zip code:
$925
Pennsylvania:
$1,633
(% of AGI for various income ranges: 36.2% for AGIs below $25k, 28.3% for AGIs $25k-50k, 33.8% for AGIs $50k-75k, 20.0% for AGIs $75k-100k, 265.0% for AGIs $100k-200k)
Ordinary dividends: $2,954 (reported on 20.6% of returns)
Here:
$2,954
State:
$7,382
(% of AGI for various income ranges: 34.6% for AGIs below $25k, 29.2% for AGIs $25k-50k, 111.2% for AGIs $50k-75k, 537.5% for AGIs $100k-200k)
Net capital gain/loss in AGI: +$2,350 (reported on 12.7% of returns)
Here:
+$2,350
State:
+$23,522
(% of AGI for various income ranges: 16.9% for AGIs below $25k, 52.5% for AGIs $25k-50k, 257.5% for AGIs $75k-100k)
Profit/loss from business: +$18,660 (reported on 15.9% of returns)
Here:
+$18,660
State:
+$16,274
(% of AGI for various income ranges: 130.0% for AGIs below $25k, 624.2% for AGIs $25k-50k, 2370.0% for AGIs $75k-100k)
Taxable individual retirement arrangement distribution: $6,822 (reported on 14.3% of returns)
16240:
$6,822
Pennsylvania:
$18,583
(% of AGI for various income ranges: 242.3% for AGIs below $25k, 373.8% for AGIs $50k-75k)
Earned income credit: $1,912 (reported on 12.7% of returns)
Here:
$1,912
State:
$2,100
(% of AGI for various income ranges: 66.2% for AGIs below $25k, 55.8% for AGIs $25k-50k)
Percentage of individuals using paid preparers for their 2020 taxes: 93.7%
Here:
94%
State:
92%
(% for various income ranges: 90.9% for AGIs below $25k, 93.8% for AGIs $25k-50k, 100.0% for AGIs $50k-75k, 85.7% for AGIs $75k-100k, 100.0% for AGIs $100k-200k)
Averages for the 2012 tax year for zip code 16240, filed in 2013:
Average Adjusted Gross Income (AGI) in 2012: $41,971 (Individual Income Tax Returns)
Here:
$41,971
State:
$61,346
Salary/wage: $36,123 (reported on 80.0% of returns)
Here:
$36,123
State:
$51,902
(% of AGI for various income ranges: 65.7% for AGIs below $25k, 74.2% for AGIs $25k-50k, 79.8% for AGIs $50k-75k, 80.2% for AGIs $75k-100k, 48.7% for AGIs $100k-200k)
Taxable interest for individuals: $1,248 (reported on 38.6% of returns)
This zip code:
$1,248
Pennsylvania:
$1,588
(% of AGI for various income ranges: 2.5% for AGIs below $25k, 1.4% for AGIs $25k-50k, 0.1% for AGIs $50k-75k, 0.3% for AGIs $75k-100k, 1.7% for AGIs $100k-200k)
Ordinary dividends: $2,606 (reported on 24.3% of returns)
Here:
$2,606
State:
$5,827
(% of AGI for various income ranges: 1.7% for AGIs below $25k, 1.4% for AGIs $25k-50k, 1.7% for AGIs $50k-75k, 0.5% for AGIs $75k-100k, 2.0% for AGIs $100k-200k)
Net capital gain/loss in AGI: +$771 (reported on 10.0% of returns)
Here:
+$771
State:
+$14,495
Profit/loss from business: +$10,245 (reported on 15.7% of returns)
Here:
+$10,245
State:
+$16,268
(% of AGI for various income ranges: 6.4% for AGIs below $25k, 4.6% for AGIs $25k-50k, 5.6% for AGIs $50k-75k, 4.7% for AGIs $75k-100k)
Taxable individual retirement arrangement distribution: $6,350 (reported on 11.4% of returns)
16240:
$6,350
Pennsylvania:
$14,550
Total itemized deductions: $16,562 (15% of AGI, reported on 11.4% of returns)
Here:
$16,562
State:
$23,538
Here:
15.3% of AGI
State:
18.4% of AGI
Charity contributions: $2,660 (reported on 7.1% of returns)
Here:
$2,660
State:
$4,025
Taxes paid: $5,950 (reported on 11.4% of returns)
16240:
$5,950
State:
$9,982
(% of AGI for various income ranges: 1.8% for AGIs below $25k, 2.2% for AGIs $50k-75k, 3.8% for AGIs $100k-200k)
Earned income credit: $2,060 (reported on 14.3% of returns)
Here:
$2,060
State:
$2,106
(% of AGI for various income ranges: 3.9% for AGIs below $25k, 1.0% for AGIs $25k-50k)
Percentage of individuals using paid preparers for their 2012 taxes: 70.0%
Here:
70%
State:
53%
(% for various income ranges: 64.3% for AGIs below $25k, 68.2% for AGIs $25k-50k, 80.0% for AGIs $50k-75k, 66.7% for AGIs $75k-100k, 100.0% for AGIs $100k-200k)
Averages for the 2004 tax year for zip code 16240, filed in 2005:
Average Adjusted Gross Income (AGI) in 2004: $33,676 (Individual Income Tax Returns)
Here:
$33,676
State:
$48,049
Salary/wage: $29,214 (reported on 81.7% of returns)
Here:
$29,214
State:
$42,646
(% of AGI for various income ranges: 78.4% for AGIs below $10k, 71.1% for AGIs $10k-25k, 80.8% for AGIs $25k-50k, 78.5% for AGIs $50k-75k, 80.3% for AGIs $75k-100k, 37.7% for AGIs over 100k)
Taxable interest for individuals: $988 (reported on 47.2% of returns)
This zip code:
$988
Pennsylvania:
$1,657
(% of AGI for various income ranges: 3.3% for AGIs below $10k, 2.5% for AGIs $10k-25k, 1.6% for AGIs $25k-50k, 0.8% for AGIs $50k-75k, 0.7% for AGIs $75k-100k, 0.9% for AGIs over 100k)
Taxable dividends: $1,190 (reported on 23.9% of returns)
Here:
$1,190
State:
$3,566
(% of AGI for various income ranges: 0.9% for AGIs below $10k, 0.9% for AGIs $10k-25k, 1.0% for AGIs $25k-50k, 1.1% for AGIs $50k-75k, 0.2% for AGIs $75k-100k, 0.6% for AGIs over 100k)
Net capital gain/loss: +$3,429 (reported on 14.9% of returns)
Here:
+$3,429
State:
+$9,716
(% of AGI for various income ranges: -2.2% for AGIs below $10k, 0.4% for AGIs $10k-25k, 0.4% for AGIs $25k-50k, 2.7% for AGIs $50k-75k, 4.3% for AGIs over 100k)
Profit/loss from business: +$8,408 (reported on 17.8% of returns)
Here:
+$8,408
State:
+$14,267
(% of AGI for various income ranges: 4.3% for AGIs below $10k, 9.3% for AGIs $10k-25k, 3.3% for AGIs $25k-50k, 4.3% for AGIs $50k-75k, 9.2% for AGIs $75k-100k)
IRA payment deduction: $2,300 (reported on 2.8% of returns)
16240:
$2,300
Pennsylvania:
$2,903
Total itemized deductions: $13,000 (17% of AGI, reported on 11.4% of returns)
Here:
$13,000
State:
$18,804
Here:
16.8% of AGI
State:
19.5% of AGI
(% of AGI for various income ranges: 4.8% for AGIs $25k-50k, 4.6% for AGIs $50k-75k, 9.0% for AGIs $75k-100k, 4.9% for AGIs over 100k)
Charity contributions deductions: $2,750 (3% of AGI, reported on 9.1% of returns)
Here:
$2,750
State:
$3,337
Here:
3.3% of AGI
State:
3.3% of AGI
(% of AGI for various income ranges: 0.7% for AGIs $25k-50k, 1.0% for AGIs $50k-75k, 1.7% for AGIs $75k-100k, 0.7% for AGIs over 100k)
Total tax: $4,359 (reported on 72.4% of returns)
16240:
$4,359
State:
$8,008
(% of AGI for various income ranges: 2.7% for AGIs below $10k, 4.2% for AGIs $10k-25k, 6.2% for AGIs $25k-50k, 8.2% for AGIs $50k-75k, 11.0% for AGIs $75k-100k, 20.5% for AGIs over 100k)
Earned income credit: $1,377 (reported on 15.1% of returns)
Here:
$1,377
State:
$1,643
Percentage of individuals using paid preparers for their 2004 taxes: 68.9%
Here:
69%
State:
56%
(% for various income ranges: 59.9% for AGIs below $10k, 67.7% for AGIs $10k-25k, 70.7% for AGIs $25k-50k, 72.7% for AGIs $50k-75k, 82.8% for AGIs $75k-100k, 91.7% for AGIs over 100k)
Household received Food Stamps/SNAP in the past 12 months: 117 Household did not receive Food Stamps/SNAP in the past 12 months: 536
Women who had a birth in the past 12 months: 17 (18 now married, 0 unmarried) Women who did not have a birth in the past 12 months: 278 (143 now married, 134 unmarried)
Housing units in zip code 16240 with a mortgage: 244 (23 second mortgage, 20 both second mortgage and home equity loan) Houses without a mortgage: 19
Median monthly owner costs for units with a mortgage: $1,148 Median monthly owner costs for units without a mortgage: $342
Residents with income below the poverty level in 2022:
This zip code:
12.2%
Whole state:
11.8%
Residents with income below 50% of the poverty level in 2022:
This zip code:
9.2%
Whole state:
6.1%
Median number of rooms in houses and condos:
Here:
6.5
State:
6.8
Median number of rooms in apartments:
Here:
5.2
State:
4.3
Notable locations in this zip code not listed on our city pages
Streams, rivers, and creeks: Nye Branch (A), Nolf Run (B), Pine Creek (C), Miller Run (D), Ferguson Run (E), Tarkiln Run (F), Cherry Run (G), Brocious Run (H), Reitz Run (I). Display/hide their locations on the map
In group quarters: 4 (-1 institutionalized population)
Size of family households: 234 2-persons, 58 3-persons, 90 4-persons, 42 5-persons, 4 6-persons, 15 7-or-more-persons
Size of nonfamily households: 174 1-person, 30 2-persons
272 married couples with children.
48 single-parent households (13 men, 35 women).
94.8% of residents of 16240 zip code speak English at home.
4.3% of residents speak other Indo-European language at home (75% very well, 9% well, 16% not well).
0.1% of residents speak Asian or Pacific Island language at home (100% well).
Foreign born population: 3 (0.2%) (100.0% of them are naturalized citizens)
This zip code:
0.2%
Whole state:
7.5%
53%German
9%Pennsylvania German
7%American
6%Irish
5%English
4%Italian
2%European
Year of entry for the foreign-born population
22010 or later
02000 to 2009
01990 to 1999
2Before 1990
Housing units lacking complete plumbing facilities: 8.1% Housing units lacking complete kitchen facilities: 6.1%
77.4%Utility gas
7.2%Bottled, tank, or LP gas
5.8%Fuel oil, kerosene, etc.
4.6%Wood
2.7%Electricity
1.7%No fuel used
0.6%Other fuel
Population in 1990: 1,058. Population change in the 1990s: +549 (+51.9%).
Place of birth for U.S.-born residents:
This state: 1,445
Northeast: 32
Midwest: 42
South: 48
West: 16
71% of the 16240 zip code residents lived in the same house 5 years ago. Out of people who lived in different houses, 55% lived in this county. Out of people who lived in different counties, 50% lived in Pennsylvania.
95% of the 16240 zip code residents lived in the same house 1 year ago. Out of people who lived in different houses, 45% moved from this county. Out of people who lived in different houses, 56% moved from different county within same state.
Private vs. public school enrollment:
Students in private schools in grades 1 to 8 (elementary and middle school): 35
Here:
25.2%
Pennsylvania:
15.7%
Students in private schools in grades 9 to 12 (high school): 1
Here:
1.5%
Pennsylvania:
13.4%
Students in private undergraduate colleges: 3
Here:
8.0%
Pennsylvania:
39.8%
Occupation by median earnings in the past 12 months ($)
55,078Management occupations
54,079Health diagnosing and treating practitioners and other technical occupations
53,844Education, training, and library occupations
52,924Transportation occupations
51,423Construction and extraction occupations
47,992Sales and related occupations
Top industries in this zip code by the number of employees in 2005:
Mining: Crude Petroleum and Natural Gas Extraction (10-19 employees: 1 establishment)
Construction: Poured Concrete Foundation and Structure Contractors (5-9: 1, 1-4: 1)
Administrative and Support and Waste Management and Remediation Services: Janitorial Services (5-9: 1)
Accommodation and Food Services: Snack and Nonalcoholic Beverage Bars (5-9: 1)
Other Services (except Public Administration): Pet Care (except Veterinary) Services (1-4: 2)
People in group quarters in 2010:
3 people in group homes intended for adults
People in group quarters in 2000:
16 people in other noninstitutional group quarters
3 people in homes for the mentally retarded
3 people in religious group quarters
Fatal accident statistics in 2013:
Fatal accident count: 1
Vehicles involved in fatal accidents: 1
Fatal accidents caused by drunken drivers: 1
Fatalities: 1
Persons involved in fatal accidents: 1
Pedestrians involved in fatal accidents: 0
Fatal accident statistics in 2012:
Fatal accident count: 1
Vehicles involved in fatal accidents: 1
Fatal accidents caused by drunken drivers: 0
Fatalities: 1
Persons involved in fatal accidents: 3
Pedestrians involved in fatal accidents: 0
Home Mortgage Disclosure Act Aggregated Statistics For Year 2009 (Based on 2 partial tracts)
A) FHA, FSA/RHS & VA Home Purchase Loans
B) Conventional Home Purchase Loans
C) Refinancings
D) Home Improvement Loans
F) Non-occupant Loans on < 5 Family Dwellings (A B C & D)
G) Loans On Manufactured Home Dwelling (A B C & D)
Number
Average Value
Number
Average Value
Number
Average Value
Number
Average Value
Number
Average Value
Number
Average Value
LOANS ORIGINATED
3
$116,310
7
$77,857
16
$84,745
6
$58,657
2
$39,060
2
$28,920
APPLICATIONS APPROVED, NOT ACCEPTED
0
$0
0
$0
2
$102,350
0
$0
0
$0
0
$0
APPLICATIONS DENIED
1
$69,860
1
$53,340
8
$120,896
2
$11,455
0
$0
1
$118,690
APPLICATIONS WITHDRAWN
0
$0
2
$66,295
3
$89,393
1
$11,270
0
$0
0
$0
FILES CLOSED FOR INCOMPLETENESS
0
$0
0
$0
0
$0
0
$0
0
$0
0
$0
Aggregated Statistics For Year 2008 (Based on 2 partial tracts)
A) FHA, FSA/RHS & VA Home Purchase Loans
B) Conventional Home Purchase Loans
C) Refinancings
D) Home Improvement Loans
G) Loans On Manufactured Home Dwelling (A B C & D)
Number
Average Value
Number
Average Value
Number
Average Value
Number
Average Value
Number
Average Value
LOANS ORIGINATED
1
$132,960
5
$147,912
12
$68,547
9
$32,719
2
$90,330
APPLICATIONS APPROVED, NOT ACCEPTED
0
$0
2
$87,140
2
$98,595
0
$0
0
$0
APPLICATIONS DENIED
1
$63,850
3
$83,383
12
$77,687
5
$61,748
1
$22,910
APPLICATIONS WITHDRAWN
0
$0
1
$46,570
3
$70,487
0
$0
0
$0
FILES CLOSED FOR INCOMPLETENESS
0
$0
0
$0
0
$0
0
$0
0
$0
Aggregated Statistics For Year 2007 (Based on 2 partial tracts)
B) Conventional Home Purchase Loans
C) Refinancings
D) Home Improvement Loans
F) Non-occupant Loans on < 5 Family Dwellings (A B C & D)
G) Loans On Manufactured Home Dwelling (A B C & D)
Number
Average Value
Number
Average Value
Number
Average Value
Number
Average Value
Number
Average Value
LOANS ORIGINATED
6
$81,568
11
$65,798
9
$44,530
1
$65,730
1
$129,210
APPLICATIONS APPROVED, NOT ACCEPTED
1
$48,450
4
$51,550
1
$9,770
0
$0
1
$83,760
APPLICATIONS DENIED
3
$37,937
17
$84,554
6
$36,808
1
$66,480
3
$97,030
APPLICATIONS WITHDRAWN
1
$80,000
5
$84,960
0
$0
0
$0
1
$75,870
FILES CLOSED FOR INCOMPLETENESS
0
$0
2
$54,085
0
$0
0
$0
0
$0
Aggregated Statistics For Year 2006 (Based on 2 partial tracts)
A) FHA, FSA/RHS & VA Home Purchase Loans
B) Conventional Home Purchase Loans
C) Refinancings
D) Home Improvement Loans
F) Non-occupant Loans on < 5 Family Dwellings (A B C & D)
G) Loans On Manufactured Home Dwelling (A B C & D)
Number
Average Value
Number
Average Value
Number
Average Value
Number
Average Value
Number
Average Value
Number
Average Value
LOANS ORIGINATED
1
$42,820
8
$72,021
18
$56,361
8
$19,579
2
$82,070
2
$77,750
APPLICATIONS APPROVED, NOT ACCEPTED
0
$0
2
$25,355
1
$67,610
2
$30,235
0
$0
0
$0
APPLICATIONS DENIED
0
$0
3
$76,747
8
$58,922
6
$44,447
0
$0
1
$52,580
APPLICATIONS WITHDRAWN
0
$0
1
$86,010
5
$52,134
0
$0
0
$0
0
$0
FILES CLOSED FOR INCOMPLETENESS
0
$0
1
$18,030
3
$63,727
0
$0
1
$48,080
0
$0
Aggregated Statistics For Year 2005 (Based on 2 partial tracts)
B) Conventional Home Purchase Loans
C) Refinancings
D) Home Improvement Loans
F) Non-occupant Loans on < 5 Family Dwellings (A B C & D)
Number
Average Value
Number
Average Value
Number
Average Value
Number
Average Value
LOANS ORIGINATED
6
$38,562
19
$58,119
8
$43,100
2
$35,120
APPLICATIONS APPROVED, NOT ACCEPTED
0
$0
3
$53,960
2
$22,350
0
$0
APPLICATIONS DENIED
1
$69,110
9
$74,119
3
$31,173
1
$40,190
APPLICATIONS WITHDRAWN
0
$0
7
$65,999
0
$0
0
$0
FILES CLOSED FOR INCOMPLETENESS
0
$0
1
$51,080
0
$0
0
$0
Aggregated Statistics For Year 2004 (Based on 2 partial tracts)
B) Conventional Home Purchase Loans
C) Refinancings
D) Home Improvement Loans
F) Non-occupant Loans on < 5 Family Dwellings (A B C & D)
G) Loans On Manufactured Home Dwelling (A B C & D)


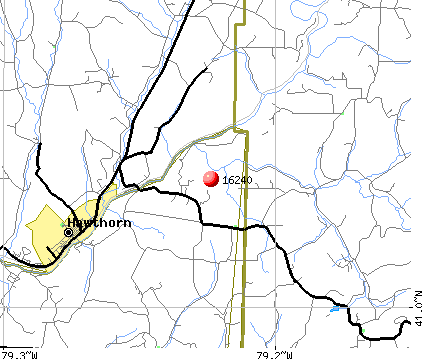 Nearest zip codes: 16230, 15864, 15778, 16224, 16245, 15784.