Estimated zip code population in 2022: 1,928 Zip code population in 2010: 2,089 Zip code population in 2000: 2,089
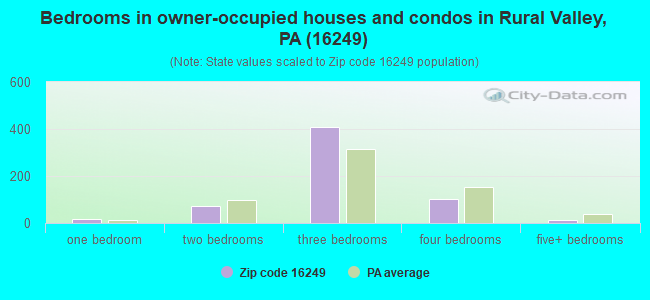
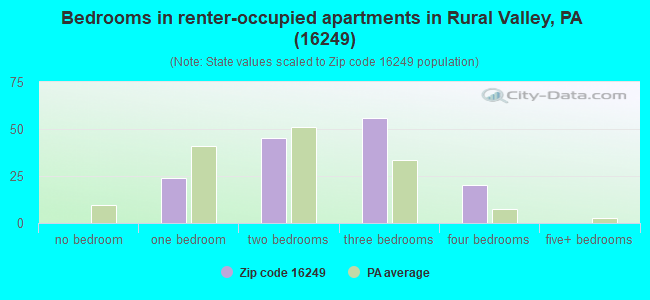
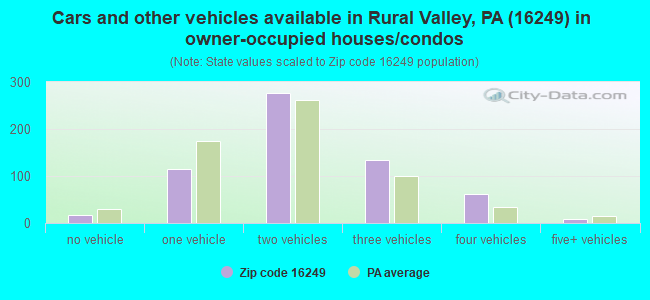
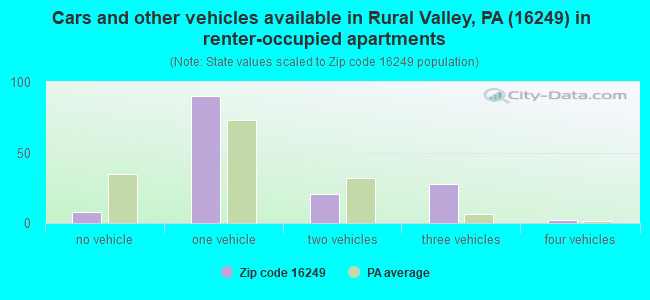
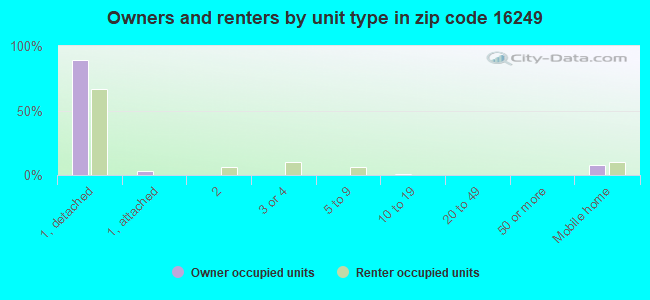
Houses and condos: 925 Renter-occupied apartments: 148
% of renters here:
19%
State:
31%
March 2022 cost of living index in zip code 16249: 91.5 (less than average, U.S. average is 100)
Land area: 27.8 sq. mi. Water area: 0.4 sq. mi.
Population density: 69 people per square mile
(very low).
OSM Map
General Map
Google Map
MSN Map
OSM Map
General Map
Google Map
MSN Map
OSM Map
General Map
Google Map
MSN Map
OSM Map
General Map
Google Map
MSN Map
Please wait while loading the map...
Real estate property taxes paid for housing units in 2022:
This zip code:
1.4% ($2,258)
Pennsylvania:
1.3% ($3,094)
Median real estate property taxes paid for housing units with mortgages in 2022: $2,441 (1.4%) Median real estate property taxes paid for housing units with no mortgage in 2022: $2,162 (1.4%)
Business Search- 14 Million verified businesses
Males: 1,002
(52.0%)
Females: 926
(48.0%)
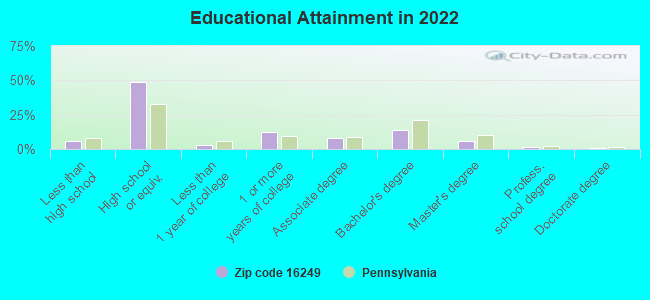
For population 25 years and over in 16249:
High school or higher: 93.1%
Bachelor's degree or higher: 21.8%
Graduate or professional degree: 8.2%
Unemployed: 5.3%
Mean travel time to work (commute): 36.6 minutes
For population 15 years and over in 16249:
Never married: 26.1%
Now married: 58.8%
Separated: 0.5%
Widowed: 6.2%
Divorced: 8.3%
Zip code 16249 compared to state average:
Median house value below state average.
Black race population percentage significantly below state average.
Hispanic race population percentage significantly below state average.
Median age above state average.
Foreign-born population percentage significantly below state average.
Renting percentage below state average.
Length of stay since moving in significantly above state average.
Percentage of population with a bachelor's degree or higher below state average.
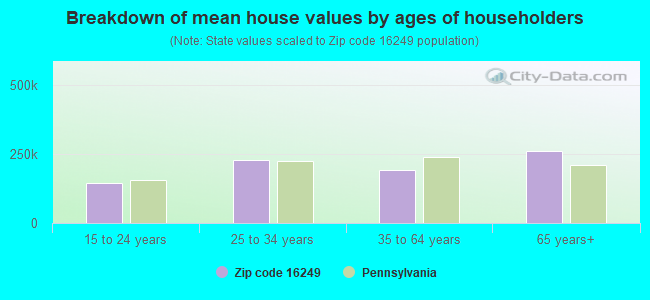
Estimated median house/condo value in 2022: $161,279
16249:
$161,279
Pennsylvania:
$245,500
According to our research of Pennsylvania and other state lists, there were 3 registered sex offenders living in 16249 zip code as of May 20, 2024. The ratio of all residents to sex offenders in zip code 16249 is 647 to 1. The ratio of registered sex offenders to all residents in this zip code is near the state average.
Median resident age:
This zip code:
48.4 years
Pennsylvania median age:
40.9 years
Average household size:
This zip code:
2.5 people
Pennsylvania:
2.4 people
Averages for the 2020 tax year for zip code 16249, filed in 2021:
Average Adjusted Gross Income (AGI) in 2020: $54,843 (Individual Income Tax Returns)
Here:
$54,843
State:
$75,707
Salary/wage: $49,862 (reported on 76.3% of returns)
Here:
$49,862
State:
$62,806
(% of AGI for various income ranges: 1059.0% for AGIs below $25k, 2987.9% for AGIs $25k-50k, 5533.3% for AGIs $50k-75k, 9147.5% for AGIs $75k-100k, 16710.0% for AGIs $100k-200k)
Taxable interest for individuals: $811 (reported on 37.1% of returns)
This zip code:
$811
Pennsylvania:
$1,633
(% of AGI for various income ranges: 30.5% for AGIs below $25k, 17.9% for AGIs $25k-50k, 24.2% for AGIs $50k-75k, 58.8% for AGIs $75k-100k, 131.1% for AGIs $100k-200k)
Ordinary dividends: $2,289 (reported on 18.6% of returns)
Here:
$2,289
State:
$7,382
(% of AGI for various income ranges: 17.6% for AGIs below $25k, 38.9% for AGIs $25k-50k, 27.5% for AGIs $50k-75k, 70.0% for AGIs $75k-100k, 235.6% for AGIs $100k-200k)
Net capital gain/loss in AGI: +$6,017 (reported on 12.4% of returns)
Here:
+$6,017
State:
+$23,522
(% of AGI for various income ranges: 12.4% for AGIs below $25k, 49.5% for AGIs $25k-50k, 125.8% for AGIs $50k-75k, 501.1% for AGIs $100k-200k)
Profit/loss from business: +$3,510 (reported on 10.3% of returns)
Here:
+$3,510
State:
+$16,274
(% of AGI for various income ranges: 39.0% for AGIs below $25k, 415.0% for AGIs $75k-100k)
Taxable individual retirement arrangement distribution: $10,950 (reported on 10.3% of returns)
16249:
$10,950
Pennsylvania:
$18,583
(% of AGI for various income ranges: 60.0% for AGIs below $25k, 229.5% for AGIs $25k-50k, 666.2% for AGIs $75k-100k)
Earned income credit: $1,900 (reported on 13.4% of returns)
Here:
$1,900
State:
$2,100
(% of AGI for various income ranges: 73.8% for AGIs below $25k, 48.4% for AGIs $25k-50k)
Percentage of individuals using paid preparers for their 2020 taxes: 93.8%
Here:
94%
State:
92%
(% for various income ranges: 90.9% for AGIs below $25k, 95.7% for AGIs $25k-50k, 93.3% for AGIs $50k-75k, 91.7% for AGIs $75k-100k, 100.0% for AGIs $100k-200k)
Averages for the 2012 tax year for zip code 16249, filed in 2013:
Average Adjusted Gross Income (AGI) in 2012: $45,668 (Individual Income Tax Returns)
Here:
$45,668
State:
$61,346
Salary/wage: $42,440 (reported on 80.6% of returns)
Here:
$42,440
State:
$51,902
(% of AGI for various income ranges: 66.5% for AGIs below $25k, 76.8% for AGIs $25k-50k, 81.5% for AGIs $50k-75k, 78.0% for AGIs $75k-100k, 70.1% for AGIs $100k-200k)
Taxable interest for individuals: $849 (reported on 41.7% of returns)
This zip code:
$849
Pennsylvania:
$1,588
(% of AGI for various income ranges: 2.5% for AGIs below $25k, 1.4% for AGIs $25k-50k, 0.3% for AGIs $50k-75k, 0.6% for AGIs $75k-100k, 0.3% for AGIs $100k-200k)
Ordinary dividends: $1,824 (reported on 20.4% of returns)
Here:
$1,824
State:
$5,827
(% of AGI for various income ranges: 2.2% for AGIs below $25k, 0.9% for AGIs $25k-50k, 0.2% for AGIs $50k-75k, 0.5% for AGIs $75k-100k, 1.0% for AGIs $100k-200k)
Net capital gain/loss in AGI: +$1,562 (reported on 12.6% of returns)
Here:
+$1,562
State:
+$14,495
(% of AGI for various income ranges: 0.6% for AGIs below $25k, 1.9% for AGIs $50k-75k)
Profit/loss from business: +$3,083 (reported on 11.7% of returns)
Here:
+$3,083
State:
+$16,268
(% of AGI for various income ranges: 2.3% for AGIs below $25k, 1.6% for AGIs $25k-50k, 1.2% for AGIs $75k-100k)
Taxable individual retirement arrangement distribution: $6,673 (reported on 10.7% of returns)
16249:
$6,673
Pennsylvania:
$14,550
(% of AGI for various income ranges: 2.7% for AGIs below $25k, 4.0% for AGIs $25k-50k, 2.8% for AGIs $75k-100k)
Total itemized deductions: $18,831 (18% of AGI, reported on 15.5% of returns)
Here:
$18,831
State:
$23,538
Here:
18.5% of AGI
State:
18.4% of AGI
(% of AGI for various income ranges: 5.7% for AGIs $25k-50k, 6.9% for AGIs $50k-75k, 6.4% for AGIs $75k-100k, 8.8% for AGIs $100k-200k)
Charity contributions: $2,427 (reported on 10.7% of returns)
Here:
$2,427
State:
$4,025
(% of AGI for various income ranges: 0.5% for AGIs $50k-75k, 0.5% for AGIs $75k-100k, 1.2% for AGIs $100k-200k)
Taxes paid: $7,062 (reported on 15.5% of returns)
16249:
$7,062
State:
$9,982
(% of AGI for various income ranges: 1.5% for AGIs $25k-50k, 2.0% for AGIs $50k-75k, 2.3% for AGIs $75k-100k, 4.2% for AGIs $100k-200k)
Earned income credit: $1,943 (reported on 13.6% of returns)
Here:
$1,943
State:
$2,106
(% of AGI for various income ranges: 4.0% for AGIs below $25k, 0.8% for AGIs $25k-50k)
Percentage of individuals using paid preparers for their 2012 taxes: 56.3%
Here:
56%
State:
53%
(% for various income ranges: 50.0% for AGIs below $25k, 59.1% for AGIs $25k-50k, 62.5% for AGIs $50k-75k, 63.6% for AGIs $75k-100k, 60.0% for AGIs $100k-200k)
Averages for the 2004 tax year for zip code 16249, filed in 2005:
Average Adjusted Gross Income (AGI) in 2004: $35,852 (Individual Income Tax Returns)
Here:
$35,852
State:
$48,049
Salary/wage: $33,797 (reported on 83.4% of returns)
Here:
$33,797
State:
$42,646
(% of AGI for various income ranges: 83.4% for AGIs below $10k, 71.2% for AGIs $10k-25k, 81.5% for AGIs $25k-50k, 85.8% for AGIs $50k-75k, 84.5% for AGIs $75k-100k, 61.5% for AGIs over 100k)
Taxable interest for individuals: $1,053 (reported on 54.8% of returns)
This zip code:
$1,053
Pennsylvania:
$1,657
(% of AGI for various income ranges: 10.3% for AGIs below $10k, 3.3% for AGIs $10k-25k, 1.7% for AGIs $25k-50k, 0.9% for AGIs $50k-75k, 0.6% for AGIs $75k-100k, 0.8% for AGIs over 100k)
Taxable dividends: $2,164 (reported on 26.1% of returns)
Here:
$2,164
State:
$3,566
(% of AGI for various income ranges: 3.1% for AGIs below $10k, 1.4% for AGIs $10k-25k, 1.3% for AGIs $25k-50k, 0.2% for AGIs $50k-75k, 0.2% for AGIs $75k-100k, 5.5% for AGIs over 100k)
Net capital gain/loss: +$683 (reported on 14.9% of returns)
Here:
+$683
State:
+$9,716
(% of AGI for various income ranges: 0.8% for AGIs below $10k, 0.5% for AGIs $10k-25k, 0.1% for AGIs $25k-50k, -0.0% for AGIs $50k-75k, 1.1% for AGIs over 100k)
Profit/loss from business: +$2,811 (reported on 13.1% of returns)
Here:
+$2,811
State:
+$14,267
(% of AGI for various income ranges: 9.0% for AGIs below $10k, 3.0% for AGIs $10k-25k, 0.7% for AGIs $25k-50k, -0.1% for AGIs $50k-75k, 1.7% for AGIs $75k-100k)
IRA payment deduction: $2,958 (reported on 2.6% of returns)
16249:
$2,958
Pennsylvania:
$2,903
Total itemized deductions: $17,022 (25% of AGI, reported on 19.1% of returns)
Here:
$17,022
State:
$18,804
Here:
25.0% of AGI
State:
19.5% of AGI
(% of AGI for various income ranges: 4.0% for AGIs $10k-25k, 7.1% for AGIs $25k-50k, 8.6% for AGIs $50k-75k, 8.5% for AGIs $75k-100k, 19.0% for AGIs over 100k)
Charity contributions deductions: $1,614 (2% of AGI, reported on 14.1% of returns)
Here:
$1,614
State:
$3,337
Here:
2.1% of AGI
State:
3.3% of AGI
(% of AGI for various income ranges: 0.5% for AGIs $25k-50k, 0.5% for AGIs $50k-75k, 0.7% for AGIs $75k-100k, 1.6% for AGIs over 100k)
Total tax: $4,278 (reported on 74.0% of returns)
16249:
$4,278
State:
$8,008
(% of AGI for various income ranges: 2.6% for AGIs below $10k, 3.8% for AGIs $10k-25k, 6.2% for AGIs $25k-50k, 8.1% for AGIs $50k-75k, 10.5% for AGIs $75k-100k, 17.9% for AGIs over 100k)
Earned income credit: $1,820 (reported on 14.2% of returns)
Here:
$1,820
State:
$1,643
Percentage of individuals using paid preparers for their 2004 taxes: 60.6%
Here:
61%
State:
56%
(% for various income ranges: 59.6% for AGIs below $10k, 62.5% for AGIs $10k-25k, 60.4% for AGIs $25k-50k, 56.7% for AGIs $50k-75k, 57.9% for AGIs $75k-100k, 75.0% for AGIs over 100k)
Household received Food Stamps/SNAP in the past 12 months: 122 Household did not receive Food Stamps/SNAP in the past 12 months: 644
Women who had a birth in the past 12 months: 20 (14 now married, 6 unmarried) Women who did not have a birth in the past 12 months: 318 (140 now married, 177 unmarried)
Housing units in zip code 16249 with a mortgage: 267 (42 second mortgage, 1 home equity loan, 28 both second mortgage and home equity loan) Houses without a mortgage: 24
Median monthly owner costs for units with a mortgage: $1,255 Median monthly owner costs for units without a mortgage: $457
Residents with income below the poverty level in 2022:
This zip code:
7.3%
Whole state:
11.8%
Residents with income below 50% of the poverty level in 2022:
This zip code:
2.5%
Whole state:
6.1%
Median number of rooms in houses and condos:
Here:
6.4
State:
6.8
Median number of rooms in apartments:
Here:
5.5
State:
4.3
Notable locations in this zip code not listed on our city pages
260 married couples with children.
52 single-parent households (25 men, 27 women).
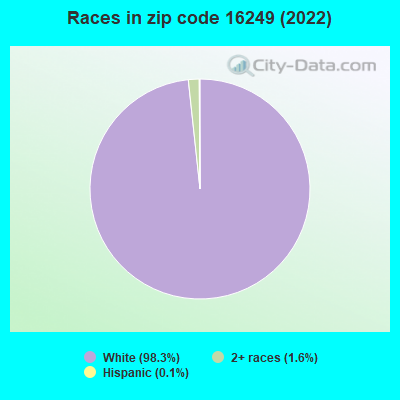
97.4% of residents of 16249 zip code speak English at home.
1.2% of residents speak Spanish at home (100% very well).
0.8% of residents speak other Indo-European language at home (27% very well, 73% well).
Foreign born population: 0 (0.0%)
:
0.0%
Whole state:
7.5%
28%German
18%Italian
15%English
7%American
4%Welsh
3%Ukrainian
3%Scotch-Irish
Housing units lacking complete plumbing facilities: 2.8% Housing units lacking complete kitchen facilities: 3.7%
74.8%Utility gas
8.4%Fuel oil, kerosene, etc.
7.1%Electricity
4.7%Wood
3.9%Bottled, tank, or LP gas
1.5%Other fuel
Population in 1990: 3,499.
Place of birth for U.S.-born residents:
This state: 1,759
Northeast: 38
Midwest: 31
South: 59
West: 22
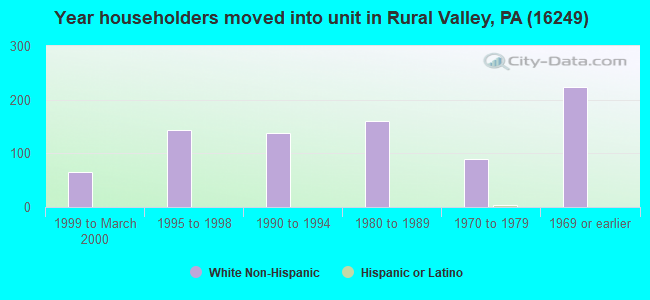
76% of the 16249 zip code residents lived in the same house 5 years ago. Out of people who lived in different houses, 73% lived in this county. Out of people who lived in different counties, 50% lived in Pennsylvania.
97% of the 16249 zip code residents lived in the same house 1 year ago. Out of people who lived in different houses, 69% moved from this county. Out of people who lived in different houses, 42% moved from different county within same state.
Private vs. public school enrollment:
Students in private schools in grades 1 to 8 (elementary and middle school): 3
Here:
1.8%
Pennsylvania:
15.7%
Students in private schools in grades 9 to 12 (high school):
Here:
0.0%
Pennsylvania:
13.4%
Students in private undergraduate colleges: 3
Here:
4.3%
Pennsylvania:
39.8%
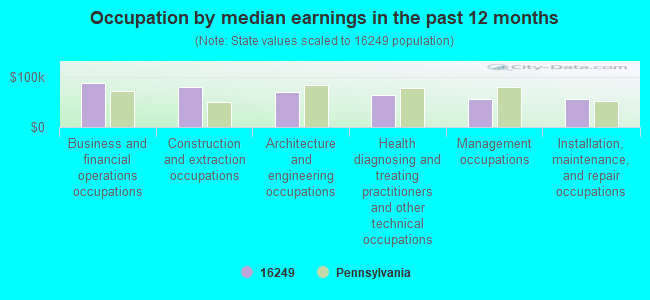
Occupation by median earnings in the past 12 months ($)
88,594Business and financial operations occupations
80,007Construction and extraction occupations
71,354Architecture and engineering occupations
65,346Health diagnosing and treating practitioners and other technical occupations
57,140Management occupations
56,685Installation, maintenance, and repair occupations
Top industries in this zip code by the number of employees in 2005:
Mining: Support Activities for Coal Mining (20-49 employees: 1 establishment)
Mining: Support Activities for Oil and Gas Operations (20-49: 1)
Accommodation and Food Services: Limited-Service Restaurants (10-19: 1)
Construction: Highway, Street, and Bridge Construction (10-19: 1)
Other Services (except Public Administration): Religious Organizations (5-9: 1, 1-4: 2)
Wholesale Trade: Motor Vehicle Parts (Used) Merchant Wholesalers (5-9: 1)
People in group quarters in 2000:
21 people in homes for the mentally retarded
19 people in other noninstitutional group quarters
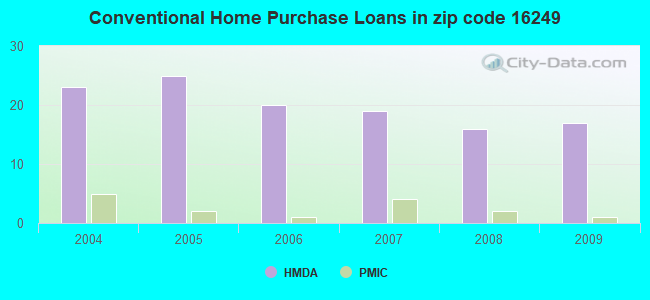
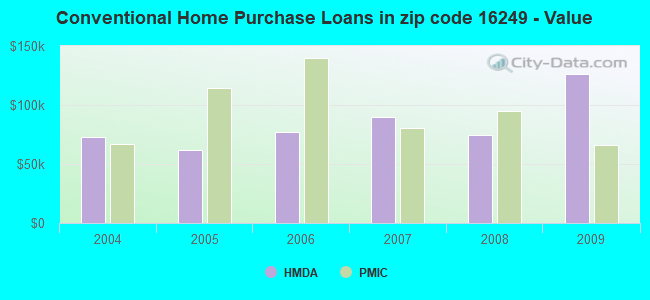
Home Mortgage Disclosure Act Aggregated Statistics For Year 2009 (Based on 4 partial tracts)
A) FHA, FSA/RHS & VA Home Purchase Loans
B) Conventional Home Purchase Loans
C) Refinancings
D) Home Improvement Loans
F) Non-occupant Loans on < 5 Family Dwellings (A B C & D)
G) Loans On Manufactured Home Dwelling (A B C & D)
Number
Average Value
Number
Average Value
Number
Average Value
Number
Average Value
Number
Average Value
Number
Average Value
LOANS ORIGINATED
5
$87,008
17
$126,236
33
$98,865
16
$39,093
4
$51,948
6
$57,767
APPLICATIONS APPROVED, NOT ACCEPTED
0
$0
1
$65,520
3
$95,037
1
$12,110
0
$0
1
$109,680
APPLICATIONS DENIED
1
$290,300
4
$92,015
28
$99,155
6
$29,752
0
$0
3
$68,850
APPLICATIONS WITHDRAWN
0
$0
2
$106,470
11
$117,996
0
$0
1
$57,490
3
$92,273
FILES CLOSED FOR INCOMPLETENESS
1
$39,880
0
$0
2
$94,725
1
$32,050
0
$0
0
$0
Aggregated Statistics For Year 2008 (Based on 4 partial tracts)
A) FHA, FSA/RHS & VA Home Purchase Loans
B) Conventional Home Purchase Loans
C) Refinancings
D) Home Improvement Loans
F) Non-occupant Loans on < 5 Family Dwellings (A B C & D)
G) Loans On Manufactured Home Dwelling (A B C & D)
Number
Average Value
Number
Average Value
Number
Average Value
Number
Average Value
Number
Average Value
Number
Average Value
LOANS ORIGINATED
9
$79,982
16
$74,605
33
$97,732
20
$33,582
3
$36,607
6
$57,320
APPLICATIONS APPROVED, NOT ACCEPTED
0
$0
2
$59,030
4
$54,282
0
$0
0
$0
1
$40,120
APPLICATIONS DENIED
3
$55,483
5
$72,166
38
$91,586
15
$49,279
1
$53,980
8
$75,650
APPLICATIONS WITHDRAWN
1
$75,490
3
$34,423
11
$132,304
4
$120,770
1
$42,730
1
$125,350
FILES CLOSED FOR INCOMPLETENESS
0
$0
1
$37,030
3
$108,897
0
$0
0
$0
0
$0
Aggregated Statistics For Year 2007 (Based on 4 partial tracts)
A) FHA, FSA/RHS & VA Home Purchase Loans
B) Conventional Home Purchase Loans
C) Refinancings
D) Home Improvement Loans
F) Non-occupant Loans on < 5 Family Dwellings (A B C & D)
G) Loans On Manufactured Home Dwelling (A B C & D)
Number
Average Value
Number
Average Value
Number
Average Value
Number
Average Value
Number
Average Value
Number
Average Value
LOANS ORIGINATED
3
$115,140
19
$90,245
32
$70,402
24
$35,152
1
$31,700
11
$65,318
APPLICATIONS APPROVED, NOT ACCEPTED
0
$0
2
$102,200
7
$75,057
2
$13,530
0
$0
1
$80,280
APPLICATIONS DENIED
0
$0
3
$66,073
51
$76,896
23
$33,970
1
$40,600
7
$61,227
APPLICATIONS WITHDRAWN
1
$16,380
4
$135,675
20
$92,188
1
$48,780
1
$158,820
1
$38,970
FILES CLOSED FOR INCOMPLETENESS
0
$0
0
$0
4
$121,252
1
$21,370
0
$0
0
$0
Aggregated Statistics For Year 2006 (Based on 4 partial tracts)
A) FHA, FSA/RHS & VA Home Purchase Loans
B) Conventional Home Purchase Loans
C) Refinancings
D) Home Improvement Loans
F) Non-occupant Loans on < 5 Family Dwellings (A B C & D)
G) Loans On Manufactured Home Dwelling (A B C & D)
Number
Average Value
Number
Average Value
Number
Average Value
Number
Average Value
Number
Average Value
Number
Average Value
LOANS ORIGINATED
2
$84,395
20
$76,726
47
$62,516
28
$35,472
0
$0
7
$84,626
APPLICATIONS APPROVED, NOT ACCEPTED
0
$0
4
$99,608
10
$85,905
6
$22,553
0
$0
0
$0
APPLICATIONS DENIED
0
$0
8
$121,658
51
$77,019
18
$33,167
3
$109,597
1
$132,250
APPLICATIONS WITHDRAWN
0
$0
5
$78,380
20
$85,800
1
$20,660
1
$69,800
2
$56,650
FILES CLOSED FOR INCOMPLETENESS
0
$0
1
$71,300
4
$84,650
1
$7,120
0
$0
0
$0
Aggregated Statistics For Year 2005 (Based on 4 partial tracts)
A) FHA, FSA/RHS & VA Home Purchase Loans
B) Conventional Home Purchase Loans
C) Refinancings
D) Home Improvement Loans
E) Loans on Dwellings For 5+ Families
F) Non-occupant Loans on < 5 Family Dwellings (A B C & D)
G) Loans On Manufactured Home Dwelling (A B C & D)
Number
Average Value
Number
Average Value
Number
Average Value
Number
Average Value
Number
Average Value
Number
Average Value
Number
Average Value
LOANS ORIGINATED
2
$56,885
25
$62,078
50
$66,921
27
$32,874
1
$58,400
2
$53,875
6
$47,852
APPLICATIONS APPROVED, NOT ACCEPTED
0
$0
1
$72,460
10
$64,737
4
$21,982
0
$0
1
$64,810
1
$72,460
APPLICATIONS DENIED
1
$39,170
11
$62,560
56
$69,227
22
$26,651
1
$162,380
2
$21,720
6
$24,930
APPLICATIONS WITHDRAWN
1
$29,200
4
$97,838
24
$83,912
3
$88,423
1
$7,120
1
$68,450
2
$55,105
FILES CLOSED FOR INCOMPLETENESS
0
$0
1
$143,690
4
$90,362
0
$0
0
$0
0
$0
0
$0
Aggregated Statistics For Year 2004 (Based on 4 partial tracts)
A) FHA, FSA/RHS & VA Home Purchase Loans
B) Conventional Home Purchase Loans
C) Refinancings
D) Home Improvement Loans
F) Non-occupant Loans on < 5 Family Dwellings (A B C & D)
G) Loans On Manufactured Home Dwelling (A B C & D)


 Nearest zip codes: 16244, 16263, 16250, 15736, 15732, 15774.