Estimated zip code population in 2022: 437 Zip code population in 2010: 564 Zip code population in 2000: 529
Houses and condos: 259 Renter-occupied apartments: 19
% of renters here:
9%
State:
31%
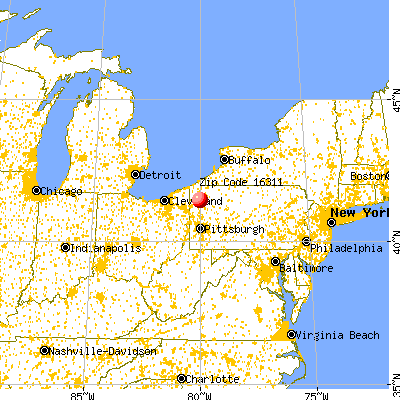
March 2022 cost of living index in zip code 16311: 90.5 (less than average, U.S. average is 100)
Land area: 14.7 sq. mi. Water area: 0.1 sq. mi.
Population density: 30 people per square mile
(very low).
OSM Map
General Map
Google Map
MSN Map
OSM Map
General Map
Google Map
MSN Map
OSM Map
General Map
Google Map
MSN Map
OSM Map
General Map
Google Map
MSN Map
Please wait while loading the map...
Real estate property taxes paid for housing units in 2022:
This zip code:
1.2% ($1,588)
Pennsylvania:
1.3% ($3,094)
Median real estate property taxes paid for housing units with mortgages in 2022: $2,206 (1.2%) Median real estate property taxes paid for housing units with no mortgage in 2022: $1,363 (1.1%)
Business Search- 14 Million verified businesses
Males: 205
(47.0%)
Females: 231
(53.0%)
For population 25 years and over in 16311:
High school or higher: 81.1%
Bachelor's degree or higher: 14.7%
Graduate or professional degree: 7.4%
Mean travel time to work (commute): 37.6 minutes
For population 15 years and over in 16311:
Never married: 21.9%
Now married: 56.9%
Separated: 1.5%
Widowed: 7.8%
Divorced: 11.9%
Zip code 16311 compared to state average:
Median house value below state average.
Unemployed percentage significantly below state average.
Black race population percentage significantly below state average.
Hispanic race population percentage significantly below state average.
Median age significantly above state average.
Foreign-born population percentage significantly below state average.
Renting percentage significantly below state average.
Length of stay since moving in above state average.
Number of college students below state average.
Percentage of population with a bachelor's degree or higher below state average.
Estimated median house/condo value in 2022: $134,037
16311:
$134,037
Pennsylvania:
$245,500
According to our research of Pennsylvania and other state lists, there was 1 registered sex offender living in 16311 zip code as of May 23, 2024. The ratio of all residents to sex offenders in zip code 16311 is 562 to 1. The ratio of registered sex offenders to all residents in this zip code is near the state average.
Median resident age:
This zip code:
52.4 years
Pennsylvania median age:
40.9 years
Average household size:
This zip code:
2.1 people
Pennsylvania:
2.4 people
Averages for the 2020 tax year for zip code 16311, filed in 2021:
Average Adjusted Gross Income (AGI) in 2020: $48,825 (Individual Income Tax Returns)
Here:
$48,825
State:
$75,707
Salary/wage: $42,488 (reported on 66.7% of returns)
Here:
$42,488
State:
$62,806
(% of AGI for various income ranges: 877.5% for AGIs below $25k, 3577.5% for AGIs $25k-50k, 6550.0% for AGIs $50k-75k, 5056.7% for AGIs $75k-100k)
Taxable interest for individuals: $138 (reported on 33.3% of returns)
This zip code:
$138
Pennsylvania:
$1,633
(% of AGI for various income ranges: 10.0% for AGIs below $25k, 7.5% for AGIs $25k-50k, 13.3% for AGIs $75k-100k)
Ordinary dividends: $1,500 (reported on 16.7% of returns)
Here:
$1,500
State:
$7,382
(% of AGI for various income ranges: 300.0% for AGIs $50k-75k)
Net capital gain/loss in AGI: +$2,375 (reported on 16.7% of returns)
Here:
+$2,375
State:
+$23,522
(% of AGI for various income ranges: 237.5% for AGIs $25k-50k)
Profit/loss from business: +$17,660 (reported on 20.8% of returns)
Here:
+$17,660
State:
+$16,274
(% of AGI for various income ranges: 2207.5% for AGIs $25k-50k)
Taxable individual retirement arrangement distribution: $8,950 (reported on 8.3% of returns)
16311:
$8,950
Pennsylvania:
$18,583
(% of AGI for various income ranges: 447.5% for AGIs below $25k)
Percentage of individuals using paid preparers for their 2020 taxes: 87.5%
Here:
88%
State:
92%
(% for various income ranges: 87.5% for AGIs below $25k, 83.3% for AGIs $25k-50k, 75.0% for AGIs $50k-75k, 100.0% for AGIs $75k-100k, 100.0% for AGIs $100k-200k)
Averages for the 2012 tax year for zip code 16311, filed in 2013:
Average Adjusted Gross Income (AGI) in 2012: $41,236 (Individual Income Tax Returns)
Here:
$41,236
State:
$61,346
Salary/wage: $36,522 (reported on 81.8% of returns)
Here:
$36,522
State:
$51,902
(% of AGI for various income ranges: 64.2% for AGIs below $25k, 71.8% for AGIs $25k-50k, 75.2% for AGIs $50k-75k, 74.2% for AGIs $75k-100k)
Taxable interest for individuals: $200 (reported on 31.8% of returns)
This zip code:
$200
Pennsylvania:
$1,588
Ordinary dividends: $1,075 (reported on 18.2% of returns)
Here:
$1,075
State:
$5,827
Profit/loss from business: +$7,175 (reported on 18.2% of returns)
Here:
+$7,175
State:
+$16,268
Total itemized deductions: $12,767 (20% of AGI, reported on 13.6% of returns)
Here:
$12,767
State:
$23,538
Here:
20.0% of AGI
State:
18.4% of AGI
Taxes paid: $5,000 (reported on 13.6% of returns)
16311:
$5,000
State:
$9,982
Earned income credit: $2,167 (reported on 13.6% of returns)
Here:
$2,167
State:
$2,106
(% of AGI for various income ranges: 5.9% for AGIs below $25k)
Percentage of individuals using paid preparers for their 2012 taxes: 63.6%
Here:
64%
State:
53%
(% for various income ranges: 66.7% for AGIs below $25k, 57.1% for AGIs $25k-50k, 133.3% for AGIs $50k-75k)
Averages for the 2004 tax year for zip code 16311, filed in 2005:
Average Adjusted Gross Income (AGI) in 2004: $31,876 (Individual Income Tax Returns)
Here:
$31,876
State:
$48,049
Salary/wage: $30,332 (reported on 82.9% of returns)
Here:
$30,332
State:
$42,646
(% of AGI for various income ranges: 92.2% for AGIs below $10k, 66.7% for AGIs $10k-25k, 84.9% for AGIs $25k-50k, 82.0% for AGIs $50k-75k, 75.2% for AGIs $75k-100k)
Taxable interest for individuals: $430 (reported on 45.4% of returns)
This zip code:
$430
Pennsylvania:
$1,657
(% of AGI for various income ranges: 4.7% for AGIs below $10k, 1.5% for AGIs $10k-25k, 0.2% for AGIs $25k-50k, 0.4% for AGIs $50k-75k, 0.4% for AGIs $75k-100k)
Taxable dividends: $304 (reported on 18.3% of returns)
Here:
$304
State:
$3,566
Profit/loss from business: +$4,889 (reported on 17.9% of returns)
Here:
+$4,889
State:
+$14,267
Total itemized deductions: $11,667 (17% of AGI, reported on 9.6% of returns)
Here:
$11,667
State:
$18,804
Here:
16.8% of AGI
State:
19.5% of AGI
Charity contributions deductions: $750 (1% of AGI, reported on 4.8% of returns)
Here:
$750
State:
$3,337
Here:
1.0% of AGI
State:
3.3% of AGI
Total tax: $3,579 (reported on 75.7% of returns)
16311:
$3,579
State:
$8,008
(% of AGI for various income ranges: 2.6% for AGIs below $10k, 4.9% for AGIs $10k-25k, 7.1% for AGIs $25k-50k, 7.8% for AGIs $50k-75k, 14.2% for AGIs $75k-100k)
Earned income credit: $1,943 (reported on 13.9% of returns)
Here:
$1,943
State:
$1,643
Percentage of individuals using paid preparers for their 2004 taxes: 57.8%
Here:
58%
State:
56%
(% for various income ranges: 49.0% for AGIs below $10k, 60.8% for AGIs $10k-25k, 64.2% for AGIs $25k-50k, 42.9% for AGIs $50k-75k, 73.7% for AGIs $75k-100k)
Size of family households: 88 2-persons, 14 3-persons, 5 4-persons, 3 5-persons, 8 6-persons, 5 7-or-more-persons
Size of nonfamily households: 77 1-person, 11 2-persons
67 married couples with children.
1 single-parent households (1 women).
93.1% of residents of 16311 zip code speak English at home.
6.6% of residents speak other Indo-European language at home (29% very well, 61% well, 11% not well).
Foreign born population: 0 (0.0%)
:
0.0%
Whole state:
7.5%
25%German
16%American
10%Irish
9%English
9%Swiss
6%Scotch-Irish
4%Pennsylvania German
Year of entry for the foreign-born population
02010 or later
02000 to 2009
01990 to 1999
5Before 1990
Housing units lacking complete plumbing facilities: 1.7% Housing units lacking complete kitchen facilities: 2.5%
43.7%Utility gas
15.0%Fuel oil, kerosene, etc.
13.6%Wood
13.1%Electricity
9.2%Bottled, tank, or LP gas
6.8%Other fuel
Population in 1990: 282. Population change in the 1990s: +247 (+87.6%).
Place of birth for U.S.-born residents:
This state: 365
Northeast: 26
Midwest: 23
South: 11
West: 2
72% of the 16311 zip code residents lived in the same house 5 years ago. Out of people who lived in different houses, 38% lived in this county. Out of people who lived in different counties, 50% lived in Pennsylvania.
93% of the 16311 zip code residents lived in the same house 1 year ago. Out of people who lived in different houses, 9% moved from this county. Out of people who lived in different houses, 26% moved from different county within same state. Out of people who lived in different houses, 65% moved from different state.
Private vs. public school enrollment:
Students in private schools in grades 1 to 8 (elementary and middle school):
Here:
0.0%
Pennsylvania:
15.7%
Students in private schools in grades 9 to 12 (high school): 5
Here:
63.9%
Pennsylvania:
13.4%
Students in private undergraduate colleges: 2
Here:
60.4%
Pennsylvania:
39.8%
Occupation by median earnings in the past 12 months ($)
78,661Health diagnosing and treating practitioners and other technical occupations
73,703Education, training, and library occupations
67,455Management occupations
51,674Transportation occupations
45,542Construction and extraction occupations
44,976Production occupations
Top industries in this zip code by the number of employees in 2005:
Mining: Crude Petroleum and Natural Gas Extraction (50-99 employees: 1 establishment)
Information: Data Processing, Hosting, and Related Services (1-4: 1)
Other Services (except Public Administration): Civic and Social Organizations (1-4: 1)
Home Mortgage Disclosure Act Aggregated Statistics For Year 2009 (Based on 2 partial tracts)
A) FHA, FSA/RHS & VA Home Purchase Loans
B) Conventional Home Purchase Loans
C) Refinancings
D) Home Improvement Loans
F) Non-occupant Loans on < 5 Family Dwellings (A B C & D)
G) Loans On Manufactured Home Dwelling (A B C & D)
Number
Average Value
Number
Average Value
Number
Average Value
Number
Average Value
Number
Average Value
Number
Average Value
LOANS ORIGINATED
2
$118,155
7
$110,729
24
$109,440
4
$51,852
1
$83,440
3
$93,273
APPLICATIONS APPROVED, NOT ACCEPTED
0
$0
0
$0
2
$96,405
0
$0
0
$0
0
$0
APPLICATIONS DENIED
0
$0
2
$118,605
13
$116,472
1
$147,510
0
$0
1
$106,980
APPLICATIONS WITHDRAWN
0
$0
1
$39,340
3
$144,927
0
$0
0
$0
0
$0
FILES CLOSED FOR INCOMPLETENESS
0
$0
0
$0
0
$0
0
$0
0
$0
0
$0
Aggregated Statistics For Year 2008 (Based on 2 partial tracts)
A) FHA, FSA/RHS & VA Home Purchase Loans
B) Conventional Home Purchase Loans
C) Refinancings
D) Home Improvement Loans
F) Non-occupant Loans on < 5 Family Dwellings (A B C & D)
G) Loans On Manufactured Home Dwelling (A B C & D)
Number
Average Value
Number
Average Value
Number
Average Value
Number
Average Value
Number
Average Value
Number
Average Value
LOANS ORIGINATED
1
$47,080
8
$92,418
19
$88,741
8
$52,746
2
$90,145
3
$54,137
APPLICATIONS APPROVED, NOT ACCEPTED
0
$0
1
$100,130
1
$102,210
1
$38,740
0
$0
0
$0
APPLICATIONS DENIED
0
$0
3
$101,520
16
$112,607
6
$40,230
1
$42,320
2
$70,180
APPLICATIONS WITHDRAWN
0
$0
0
$0
7
$123,584
1
$123,970
0
$0
0
$0
FILES CLOSED FOR INCOMPLETENESS
0
$0
1
$110,860
1
$188,040
0
$0
0
$0
0
$0
Aggregated Statistics For Year 2007 (Based on 2 partial tracts)
A) FHA, FSA/RHS & VA Home Purchase Loans
B) Conventional Home Purchase Loans
C) Refinancings
D) Home Improvement Loans
F) Non-occupant Loans on < 5 Family Dwellings (A B C & D)
G) Loans On Manufactured Home Dwelling (A B C & D)
Number
Average Value
Number
Average Value
Number
Average Value
Number
Average Value
Number
Average Value
Number
Average Value
LOANS ORIGINATED
1
$67,940
12
$93,199
20
$72,786
14
$34,206
2
$88,655
5
$41,720
APPLICATIONS APPROVED, NOT ACCEPTED
0
$0
1
$69,140
4
$83,738
1
$7,750
1
$25,330
1
$72,410
APPLICATIONS DENIED
0
$0
5
$71,698
25
$91,224
7
$40,911
2
$77,330
3
$64,467
APPLICATIONS WITHDRAWN
0
$0
1
$157,340
6
$104,002
0
$0
0
$0
1
$41,720
FILES CLOSED FOR INCOMPLETENESS
0
$0
1
$71,820
3
$93,273
0
$0
0
$0
0
$0
Aggregated Statistics For Year 2006 (Based on 2 partial tracts)
B) Conventional Home Purchase Loans
C) Refinancings
D) Home Improvement Loans
F) Non-occupant Loans on < 5 Family Dwellings (A B C & D)
G) Loans On Manufactured Home Dwelling (A B C & D)
Number
Average Value
Number
Average Value
Number
Average Value
Number
Average Value
Number
Average Value
LOANS ORIGINATED
14
$91,954
21
$74,443
11
$42,939
1
$139,170
4
$47,382
APPLICATIONS APPROVED, NOT ACCEPTED
3
$73,407
3
$88,903
1
$39,340
0
$0
1
$106,390
APPLICATIONS DENIED
6
$76,238
25
$87,314
6
$43,062
1
$46,190
2
$85,975
APPLICATIONS WITHDRAWN
1
$52,150
8
$82,770
0
$0
0
$0
1
$77,480
FILES CLOSED FOR INCOMPLETENESS
0
$0
1
$144,530
0
$0
0
$0
0
$0
Aggregated Statistics For Year 2005 (Based on 2 partial tracts)
A) FHA, FSA/RHS & VA Home Purchase Loans
B) Conventional Home Purchase Loans
C) Refinancings
D) Home Improvement Loans
F) Non-occupant Loans on < 5 Family Dwellings (A B C & D)
G) Loans On Manufactured Home Dwelling (A B C & D)
Number
Average Value
Number
Average Value
Number
Average Value
Number
Average Value
Number
Average Value
Number
Average Value
LOANS ORIGINATED
2
$105,640
12
$80,634
25
$72,486
13
$33,858
2
$71,670
4
$48,202
APPLICATIONS APPROVED, NOT ACCEPTED
0
$0
2
$82,100
4
$68,762
2
$23,540
0
$0
1
$67,940
APPLICATIONS DENIED
0
$0
5
$73,010
30
$84,235
6
$16,787
1
$47,080
5
$63,116
APPLICATIONS WITHDRAWN
0
$0
2
$62,280
11
$105,329
2
$70,180
0
$0
1
$24,730
FILES CLOSED FOR INCOMPLETENESS
0
$0
0
$0
4
$87,910
0
$0
0
$0
0
$0
Aggregated Statistics For Year 2004 (Based on 2 partial tracts)
A) FHA, FSA/RHS & VA Home Purchase Loans
B) Conventional Home Purchase Loans
C) Refinancings
D) Home Improvement Loans
F) Non-occupant Loans on < 5 Family Dwellings (A B C & D)
G) Loans On Manufactured Home Dwelling (A B C & D)
Number
Average Value
Number
Average Value
Number
Average Value
Number
Average Value
Number
Average Value
Number
Average Value
LOANS ORIGINATED
0
$0
13
$79,635
31
$78,768
8
$28,980
2
$58,260
4
$52,300
APPLICATIONS APPROVED, NOT ACCEPTED
0
$0
2
$86,720
6
$77,977
2
$26,375
0
$0
1
$74,200
APPLICATIONS DENIED
1
$53,940
5
$74,142
27
$93,947
5
$24,734
2
$26,075
3
$36,257
APPLICATIONS WITHDRAWN
0
$0
3
$94,663
17
$89,277
1
$33,380
0
$0
1
$59,600
FILES CLOSED FOR INCOMPLETENESS
0
$0
1
$102,810
6
$84,732
1
$60,790
0
$0
0
$0
Aggregated Statistics For Year 2003 (Based on 2 partial tracts)
B) Conventional Home Purchase Loans
C) Refinancings
D) Home Improvement Loans
F) Non-occupant Loans on < 5 Family Dwellings (A B C & D)
Number
Average Value
Number
Average Value
Number
Average Value
Number
Average Value
LOANS ORIGINATED
15
$81,553
60
$67,025
9
$41,720
3
$46,587
APPLICATIONS APPROVED, NOT ACCEPTED
2
$67,495
12
$66,131
1
$32,780
0
$0
APPLICATIONS DENIED
3
$38,043
34
$71,511
3
$15,893
1
$56,920
APPLICATIONS WITHDRAWN
1
$119,800
11
$97,175
0
$0
0
$0
FILES CLOSED FOR INCOMPLETENESS
0
$0
0
$0
0
$0
0
$0
Aggregated Statistics For Year 2002 (Based on 2 partial tracts)
A) FHA, FSA/RHS & VA Home Purchase Loans
B) Conventional Home Purchase Loans
C) Refinancings
D) Home Improvement Loans
F) Non-occupant Loans on < 5 Family Dwellings (A B C & D)
Number
Average Value
Number
Average Value
Number
Average Value
Number
Average Value
Number
Average Value
LOANS ORIGINATED
1
$77,180
10
$74,768
35
$73,436
8
$33,450
1
$100,720
APPLICATIONS APPROVED, NOT ACCEPTED
0
$0
1
$63,180
7
$73,010
0
$0
1
$81,650
APPLICATIONS DENIED
0
$0
5
$35,044
22
$83,562
3
$42,317
0
$0
APPLICATIONS WITHDRAWN
0
$0
1
$91,780
12
$70,179
1
$11,320
0
$0
FILES CLOSED FOR INCOMPLETENESS
0
$0
0
$0
4
$81,950
1
$17,880
0
$0
Aggregated Statistics For Year 2001 (Based on 2 partial tracts)
A) FHA, FSA/RHS & VA Home Purchase Loans
B) Conventional Home Purchase Loans
C) Refinancings
D) Home Improvement Loans
F) Non-occupant Loans on < 5 Family Dwellings (A B C & D)
Number
Average Value
Number
Average Value
Number
Average Value
Number
Average Value
Number
Average Value
LOANS ORIGINATED
1
$107,280
12
$63,996
39
$67,363
12
$30,743
1
$42,910
APPLICATIONS APPROVED, NOT ACCEPTED
0
$0
2
$72,860
9
$63,043
3
$36,853
0
$0
APPLICATIONS DENIED
0
$0
11
$42,262
25
$68,659
4
$19,520
0
$0
APPLICATIONS WITHDRAWN
0
$0
0
$0
9
$78,606
1
$36,060
0
$0
FILES CLOSED FOR INCOMPLETENESS
0
$0
0
$0
3
$71,520
0
$0
0
$0
Aggregated Statistics For Year 2000 (Based on 2 partial tracts)
A) FHA, FSA/RHS & VA Home Purchase Loans
B) Conventional Home Purchase Loans
C) Refinancings
D) Home Improvement Loans
F) Non-occupant Loans on < 5 Family Dwellings (A B C & D)
Number
Average Value
Number
Average Value
Number
Average Value
Number
Average Value
Number
Average Value
LOANS ORIGINATED
3
$63,970
25
$59,838
21
$49,738
12
$26,472
2
$62,135
APPLICATIONS APPROVED, NOT ACCEPTED
0
$0
4
$45,742
7
$59,047
3
$30,397
0
$0
APPLICATIONS DENIED
0
$0
10
$47,829
22
$57,650
6
$18,873
0
$0
APPLICATIONS WITHDRAWN
0
$0
1
$101,020
12
$63,896
4
$23,690
0
$0
FILES CLOSED FOR INCOMPLETENESS
0
$0
1
$44,400
3
$70,427
0
$0
0
$0
Aggregated Statistics For Year 1999 (Based on 1 partial tract)


 Nearest zip codes: 16314, 16362, 16145, 16153, 16114, 16151.


