Estimated zip code population in 2022: 1,722 Zip code population in 2010: 1,968 Zip code population in 2000: 1,622
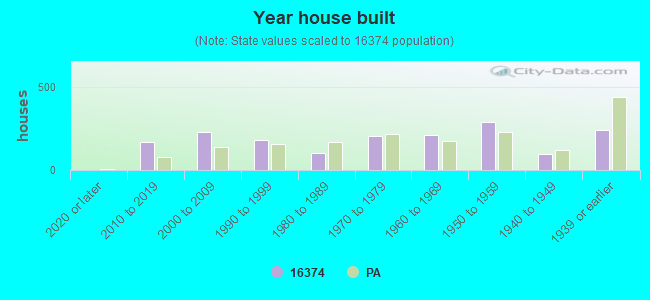
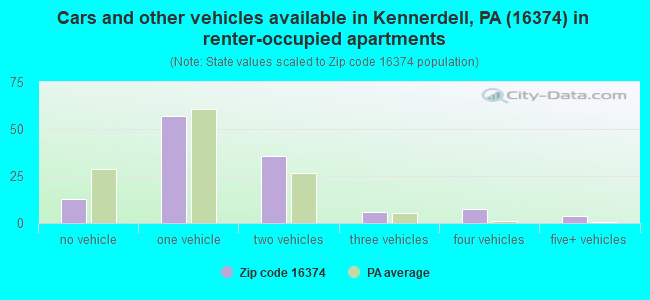
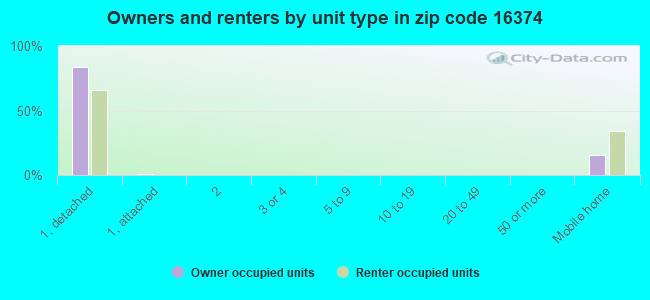
Houses and condos: 1,716 Renter-occupied apartments: 121
% of renters here:
15%
State:
31%
March 2022 cost of living index in zip code 16374: 91.0 (less than average, U.S. average is 100)
Land area: 71.3 sq. mi. Water area: 0.5 sq. mi.
Population density: 24 people per square mile
(very low).
OSM Map
General Map
Google Map
MSN Map
OSM Map
General Map
Google Map
MSN Map
OSM Map
General Map
Google Map
MSN Map
OSM Map
General Map
Google Map
MSN Map
Please wait while loading the map...
Real estate property taxes paid for housing units in 2022:
This zip code:
1.1% ($1,368)
Pennsylvania:
1.3% ($3,094)
Median real estate property taxes paid for housing units with mortgages in 2022: $1,559 (1.2%) Median real estate property taxes paid for housing units with no mortgage in 2022: $1,256 (1.0%)
Business Search- 14 Million verified businesses
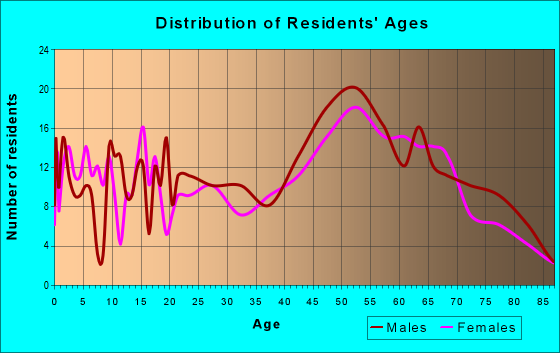
Males: 891
(51.7%)
Females: 831
(48.3%)
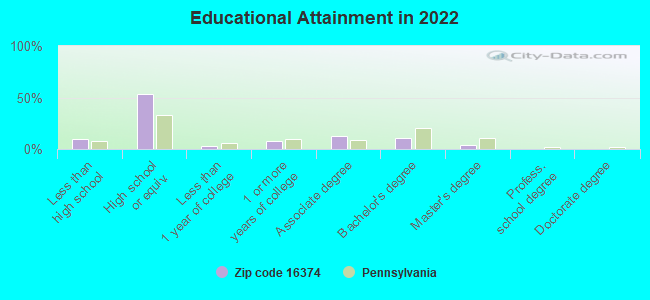
For population 25 years and over in 16374:
High school or higher: 89.3%
Bachelor's degree or higher: 15.0%
Graduate or professional degree: 4.3%
Unemployed: 1.0%
Mean travel time to work (commute): 34.4 minutes
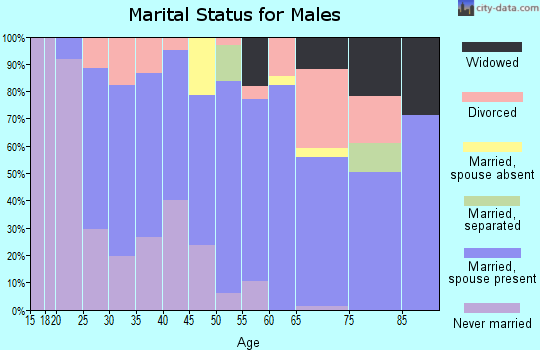
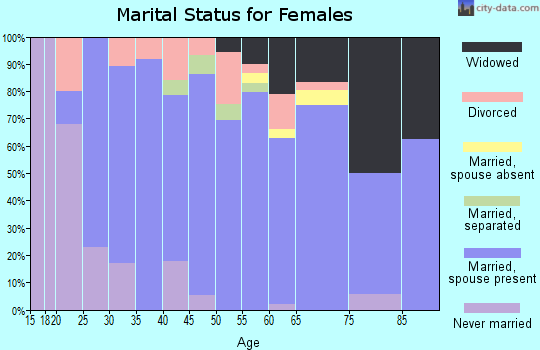
For population 15 years and over in 16374:
Never married: 19.8%
Now married: 57.2%
Separated: 2.7%
Widowed: 7.3%
Divorced: 12.9%
Zip code 16374 compared to state average:
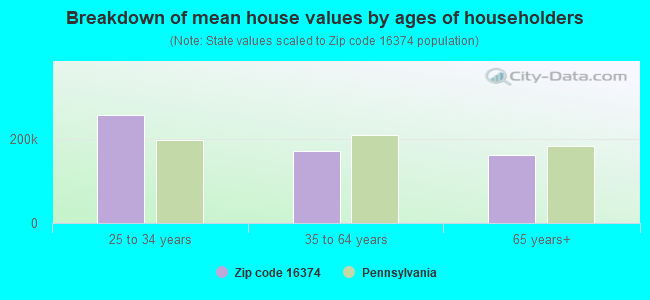
Median house value below state average.
Unemployed percentage significantly below state average.
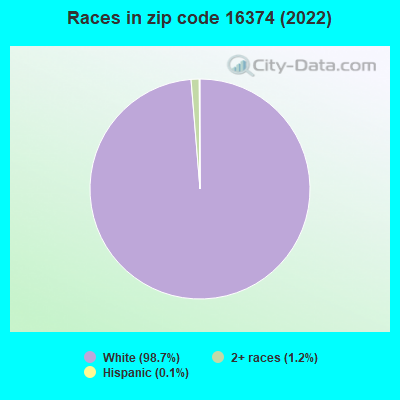
Black race population percentage significantly below state average.
Hispanic race population percentage significantly below state average.
Median age significantly above state average.
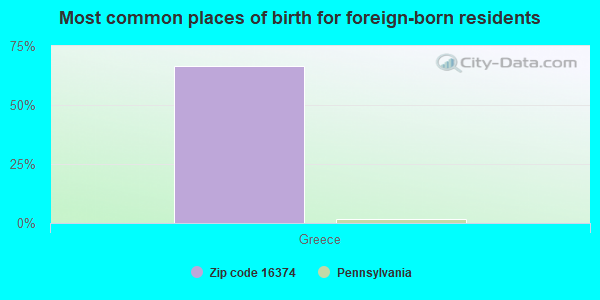
Foreign-born population percentage significantly below state average.
Renting percentage below state average.
Length of stay since moving in significantly above state average.
Number of rooms per house below state average.
Number of college students significantly below state average.
Percentage of population with a bachelor's degree or higher below state average.
Estimated median house/condo value in 2022: $123,835
16374:
$123,835
Pennsylvania:
$245,500
According to our research of Pennsylvania and other state lists, there were 3 registered sex offenders living in 16374 zip code as of May 20, 2024. The ratio of all residents to sex offenders in zip code 16374 is 669 to 1. The ratio of registered sex offenders to all residents in this zip code is near the state average.
Median resident age:
This zip code:
56.4 years
Pennsylvania median age:
40.9 years
Average household size:
This zip code:
2.1 people
Pennsylvania:
2.4 people
Averages for the 2020 tax year for zip code 16374, filed in 2021:
Average Adjusted Gross Income (AGI) in 2020: $55,495 (Individual Income Tax Returns)
Here:
$55,495
State:
$75,707
Salary/wage: $46,261 (reported on 70.9% of returns)
Here:
$46,261
State:
$62,806
(% of AGI for various income ranges: 1092.6% for AGIs below $25k, 2854.7% for AGIs $25k-50k, 5386.0% for AGIs $50k-75k, 8123.3% for AGIs $75k-100k, 13073.8% for AGIs $100k-200k)
Taxable interest for individuals: $781 (reported on 30.2% of returns)
This zip code:
$781
Pennsylvania:
$1,633
(% of AGI for various income ranges: 11.6% for AGIs below $25k, 33.2% for AGIs $25k-50k, 31.0% for AGIs $50k-75k, 30.0% for AGIs $75k-100k, 86.2% for AGIs $100k-200k)
Ordinary dividends: $2,528 (reported on 20.9% of returns)
Here:
$2,528
State:
$7,382
(% of AGI for various income ranges: 22.6% for AGIs below $25k, 32.1% for AGIs $25k-50k, 80.0% for AGIs $50k-75k, 283.3% for AGIs $75k-100k, 126.2% for AGIs $100k-200k)
Net capital gain/loss in AGI: +$8,238 (reported on 18.6% of returns)
Here:
+$8,238
State:
+$23,522
(% of AGI for various income ranges: 3.2% for AGIs below $25k, 41.6% for AGIs $25k-50k, 103.0% for AGIs $50k-75k, 278.3% for AGIs $75k-100k, 1203.8% for AGIs $100k-200k)
Profit/loss from business: +$11,892 (reported on 15.1% of returns)
Here:
+$11,892
State:
+$16,274
(% of AGI for various income ranges: 47.4% for AGIs below $25k, 88.9% for AGIs $25k-50k, 426.0% for AGIs $50k-75k, 1435.0% for AGIs $75k-100k)
Taxable individual retirement arrangement distribution: $14,257 (reported on 16.3% of returns)
16374:
$14,257
Pennsylvania:
$18,583
(% of AGI for various income ranges: 108.9% for AGIs below $25k, 196.3% for AGIs $25k-50k, 502.0% for AGIs $50k-75k, 1142.5% for AGIs $100k-200k)
Earned income credit: $2,230 (reported on 11.6% of returns)
Here:
$2,230
State:
$2,100
(% of AGI for various income ranges: 65.3% for AGIs below $25k, 52.1% for AGIs $25k-50k)
Percentage of individuals using paid preparers for their 2020 taxes: 93.0%
Here:
93%
State:
92%
(% for various income ranges: 92.3% for AGIs below $25k, 95.8% for AGIs $25k-50k, 93.3% for AGIs $50k-75k, 88.9% for AGIs $75k-100k, 91.7% for AGIs $100k-200k)
Averages for the 2012 tax year for zip code 16374, filed in 2013:
Average Adjusted Gross Income (AGI) in 2012: $47,402 (Individual Income Tax Returns)
Here:
$47,402
State:
$61,346
Salary/wage: $39,108 (reported on 74.1% of returns)
Here:
$39,108
State:
$51,902
(% of AGI for various income ranges: 67.4% for AGIs below $25k, 63.4% for AGIs $25k-50k, 75.6% for AGIs $50k-75k, 71.6% for AGIs $75k-100k, 42.0% for AGIs $100k-200k)
Taxable interest for individuals: $726 (reported on 31.8% of returns)
This zip code:
$726
Pennsylvania:
$1,588
(% of AGI for various income ranges: 0.8% for AGIs below $25k, 0.4% for AGIs $25k-50k, 0.3% for AGIs $50k-75k, 0.4% for AGIs $75k-100k, 0.6% for AGIs $100k-200k)
Ordinary dividends: $1,807 (reported on 16.5% of returns)
Here:
$1,807
State:
$5,827
(% of AGI for various income ranges: 1.3% for AGIs below $25k, 1.4% for AGIs $25k-50k, 0.5% for AGIs $50k-75k, 0.3% for AGIs $75k-100k, 0.2% for AGIs $100k-200k)
Net capital gain/loss in AGI: +$1,275 (reported on 9.4% of returns)
Here:
+$1,275
State:
+$14,495
(% of AGI for various income ranges: 0.4% for AGIs $50k-75k, 0.6% for AGIs $100k-200k)
Profit/loss from business: +$8,983 (reported on 14.1% of returns)
Here:
+$8,983
State:
+$16,268
(% of AGI for various income ranges: 3.7% for AGIs below $25k, 6.3% for AGIs $25k-50k, 1.9% for AGIs $50k-75k, 3.9% for AGIs $75k-100k)
Taxable individual retirement arrangement distribution: $12,520 (reported on 11.8% of returns)
16374:
$12,520
Pennsylvania:
$14,550
(% of AGI for various income ranges: 4.4% for AGIs below $25k, 6.4% for AGIs $25k-50k, 8.2% for AGIs $75k-100k)
Total itemized deductions: $20,364 (16% of AGI, reported on 12.9% of returns)
Here:
$20,364
State:
$23,538
Here:
15.6% of AGI
State:
18.4% of AGI
(% of AGI for various income ranges: 4.1% for AGIs $25k-50k, 6.0% for AGIs $50k-75k, 5.8% for AGIs $75k-100k, 7.7% for AGIs $100k-200k)
Charity contributions: $3,262 (reported on 9.4% of returns)
Here:
$3,262
State:
$4,025
Taxes paid: $7,655 (reported on 12.9% of returns)
16374:
$7,655
State:
$9,982
(% of AGI for various income ranges: 1.6% for AGIs below $25k, 1.6% for AGIs $50k-75k, 1.9% for AGIs $75k-100k, 4.0% for AGIs $100k-200k)
Earned income credit: $1,727 (reported on 12.9% of returns)
Here:
$1,727
State:
$2,106
(% of AGI for various income ranges: 3.2% for AGIs below $25k, 0.9% for AGIs $25k-50k)
Percentage of individuals using paid preparers for their 2012 taxes: 58.8%
Here:
59%
State:
53%
(% for various income ranges: 50.0% for AGIs below $25k, 59.1% for AGIs $25k-50k, 71.4% for AGIs $50k-75k, 62.5% for AGIs $75k-100k, 71.4% for AGIs $100k-200k)
Averages for the 2004 tax year for zip code 16374, filed in 2005:
Average Adjusted Gross Income (AGI) in 2004: $34,238 (Individual Income Tax Returns)
Here:
$34,238
State:
$48,049
Salary/wage: $31,974 (reported on 79.2% of returns)
Here:
$31,974
State:
$42,646
(% of AGI for various income ranges: 85.4% for AGIs below $10k, 64.2% for AGIs $10k-25k, 71.6% for AGIs $25k-50k, 76.7% for AGIs $50k-75k, 81.9% for AGIs $75k-100k, 70.2% for AGIs over 100k)
Taxable interest for individuals: $703 (reported on 49.0% of returns)
This zip code:
$703
Pennsylvania:
$1,657
(% of AGI for various income ranges: 7.9% for AGIs below $10k, 1.5% for AGIs $10k-25k, 1.0% for AGIs $25k-50k, 0.7% for AGIs $50k-75k, 0.5% for AGIs $75k-100k, 0.4% for AGIs over 100k)
Taxable dividends: $1,222 (reported on 22.7% of returns)
Here:
$1,222
State:
$3,566
(% of AGI for various income ranges: 1.9% for AGIs below $10k, 2.0% for AGIs $10k-25k, 1.0% for AGIs $25k-50k, 0.5% for AGIs $50k-75k, 0.3% for AGIs $75k-100k, 0.5% for AGIs over 100k)
Net capital gain/loss: +$2,000 (reported on 13.0% of returns)
Here:
+$2,000
State:
+$9,716
(% of AGI for various income ranges: 2.8% for AGIs below $10k, -0.2% for AGIs $10k-25k, 0.5% for AGIs $25k-50k, 0.0% for AGIs $50k-75k, 3.4% for AGIs $75k-100k)
Profit/loss from business: +$8,309 (reported on 17.5% of returns)
Here:
+$8,309
State:
+$14,267
(% of AGI for various income ranges: 11.9% for AGIs below $10k, 4.9% for AGIs $10k-25k, 5.4% for AGIs $25k-50k, 5.5% for AGIs $50k-75k, 2.5% for AGIs $75k-100k)
IRA payment deduction: $2,375 (reported on 2.1% of returns)
16374:
$2,375
Pennsylvania:
$2,903
Total itemized deductions: $15,213 (22% of AGI, reported on 15.7% of returns)
Here:
$15,213
State:
$18,804
Here:
22.2% of AGI
State:
19.5% of AGI
(% of AGI for various income ranges: 8.7% for AGIs $10k-25k, 4.2% for AGIs $25k-50k, 6.3% for AGIs $50k-75k, 10.0% for AGIs $75k-100k, 9.9% for AGIs over 100k)
Charity contributions deductions: $1,923 (3% of AGI, reported on 11.7% of returns)
Here:
$1,923
State:
$3,337
Here:
2.6% of AGI
State:
3.3% of AGI
(% of AGI for various income ranges: 0.5% for AGIs $10k-25k, 0.3% for AGIs $25k-50k, 0.3% for AGIs $50k-75k, 1.7% for AGIs $75k-100k, 0.9% for AGIs over 100k)
Total tax: $4,408 (reported on 72.6% of returns)
16374:
$4,408
State:
$8,008
(% of AGI for various income ranges: 3.3% for AGIs below $10k, 4.1% for AGIs $10k-25k, 6.6% for AGIs $25k-50k, 9.2% for AGIs $50k-75k, 10.2% for AGIs $75k-100k, 18.8% for AGIs over 100k)
Earned income credit: $1,554 (reported on 15.6% of returns)
Here:
$1,554
State:
$1,643
Percentage of individuals using paid preparers for their 2004 taxes: 62.3%
Here:
62%
State:
56%
(% for various income ranges: 60.5% for AGIs below $10k, 63.9% for AGIs $10k-25k, 59.9% for AGIs $25k-50k, 68.2% for AGIs $50k-75k, 59.6% for AGIs $75k-100k, 64.0% for AGIs over 100k)
Household received Food Stamps/SNAP in the past 12 months: 99 Household did not receive Food Stamps/SNAP in the past 12 months: 713
Women who had a birth in the past 12 months: 20 (21 now married, 0 unmarried) Women who did not have a birth in the past 12 months: 219 (109 now married, 109 unmarried)
Housing units in zip code 16374 with a mortgage: 254 (12 second mortgage, 12 both second mortgage and home equity loan) Houses without a mortgage: 40
Median monthly owner costs for units with a mortgage: $1,095 Median monthly owner costs for units without a mortgage: $387
Residents with income below the poverty level in 2022:
This zip code:
8.0%
Whole state:
11.8%
Residents with income below 50% of the poverty level in 2022:
This zip code:
5.5%
Whole state:
6.1%
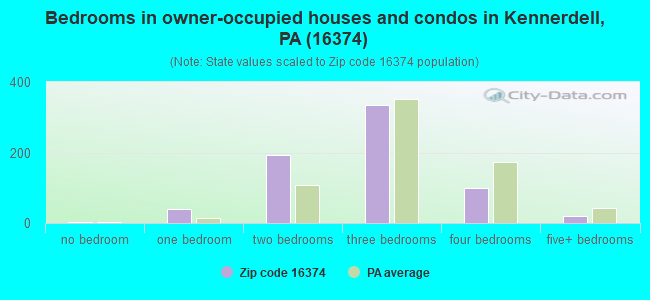
Median number of rooms in houses and condos:
Here:
5.4
State:
6.8
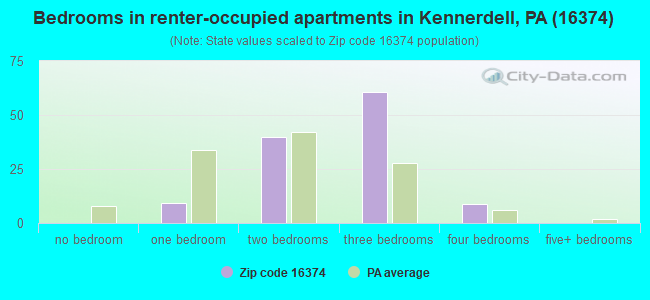
Median number of rooms in apartments:
Here:
5.4
State:
4.3
Notable locations in this zip code not listed on our city pages
Notable locations in zip code 16374: Keefer Mill (A), Grove City College Outting Club (B), Emlenton Spur (C), Carl (D), Rockland Township Volunteer Fire Department (E). Display/hide their locations on the map
Cemeteries: Bickle Cemetery (1), Melat Cemetery (2), Farren Cemetery (3), Shaffer Cemetery (4), Rockland Cemetery (5), Pine Hill Cemetery (6). Display/hide their locations on the map
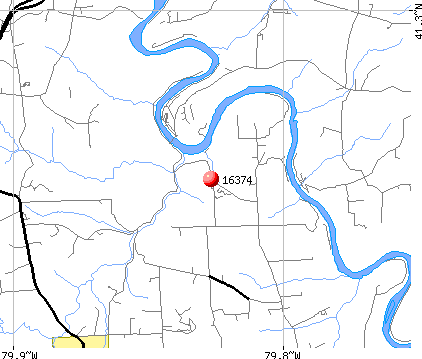
Streams, rivers, and creeks: Trout Run (A), Barricks Run (B), Mill Creek (C), Dennison Run (D), Snyder Run (E), Scrubgrass Creek (F), Whitherup Run (G), Bullion Run (H), Roberts Run (I). Display/hide their locations on the map
Size of family households: 310 2-persons, 108 3-persons, 72 4-persons, 11 5-persons, 8 7-or-more-persons
Size of nonfamily households: 248 1-person, 55 2-persons
206 married couples with children.
53 single-parent households (6 men, 47 women).
95.9% of residents of 16374 zip code speak English at home.
4.0% of residents speak other Indo-European language at home (56% very well, 35% well, 8% not well, 2% not at all).
Foreign born population: 3 (0.2%) (100.0% of them are naturalized citizens)
This zip code:
0.2%
Whole state:
7.5%
67%Greece
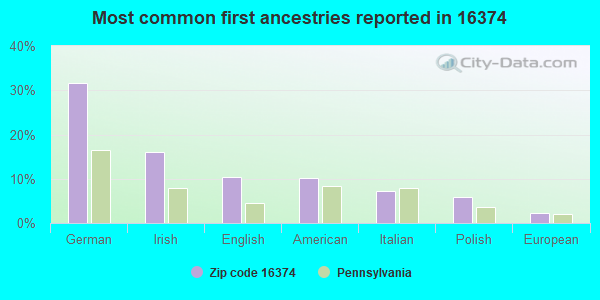
32%German
16%Irish
10%English
10%American
7%Italian
6%Polish
2%European
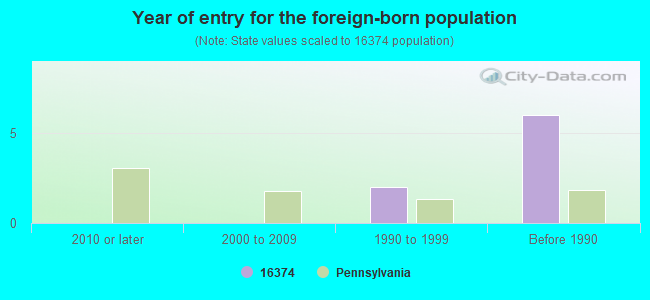
Year of entry for the foreign-born population
02010 or later
02000 to 2009
21990 to 1999
6Before 1990
Housing units lacking complete plumbing facilities: 8.1% Housing units lacking complete kitchen facilities: 6.4%
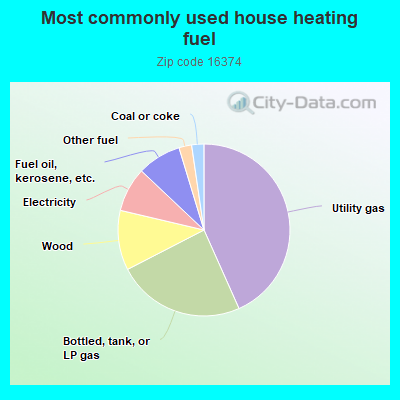
43.5%Utility gas
24.2%Bottled, tank, or LP gas
11.3%Wood
8.4%Electricity
8.3%Fuel oil, kerosene, etc.
2.4%Other fuel
2.3%Coal or coke
Population in 1990: 1,318. Population change in the 1990s: +304 (+23.1%).
Place of birth for U.S.-born residents:
This state: 1,553
Northeast: 16
Midwest: 40
South: 68
West: 20
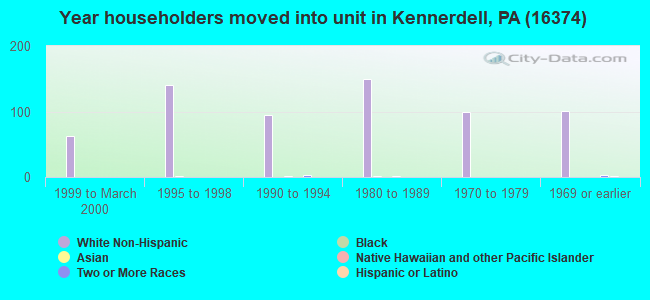
76% of the 16374 zip code residents lived in the same house 5 years ago. Out of people who lived in different houses, 46% lived in this county. Out of people who lived in different counties, 50% lived in Pennsylvania.
97% of the 16374 zip code residents lived in the same house 1 year ago. Out of people who lived in different houses, 51% moved from this county. Out of people who lived in different houses, 28% moved from different county within same state. Out of people who lived in different houses, 26% moved from different state. Out of people who lived in different houses, 4% moved from abroad.
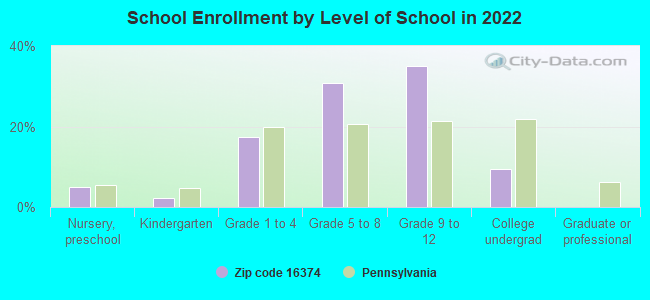
Private vs. public school enrollment:
Students in private schools in grades 1 to 8 (elementary and middle school): 33
Here:
31.2%
Pennsylvania:
15.7%
Students in private schools in grades 9 to 12 (high school): 6
Here:
8.6%
Pennsylvania:
13.4%
Students in private undergraduate colleges: 2
Here:
13.5%
Pennsylvania:
39.8%
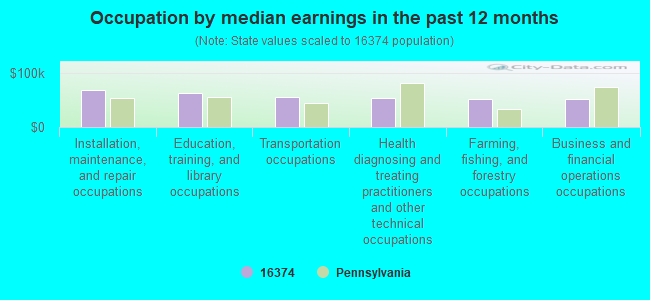
Occupation by median earnings in the past 12 months ($)
68,385Installation, maintenance, and repair occupations
61,690Education, training, and library occupations
54,590Transportation occupations
53,669Health diagnosing and treating practitioners and other technical occupations
51,431Farming, fishing, and forestry occupations
50,656Business and financial operations occupations
Top industries in this zip code by the number of employees in 2005:
Administrative and Support and Waste Management and Remediation Services: Office Administrative Services (20-49 employees: 1 establishment)
Health Care and Social Assistance: Other Residential Care Facilities (10-19: 1)
Accommodation and Food Services: Limited-Service Restaurants (5-9: 1, 1-4: 1)
Construction: Commercial and Institutional Building Construction (5-9: 1)
Accommodation and Food Services: Snack and Nonalcoholic Beverage Bars (5-9: 1)
People in group quarters in 2000:
8 people in homes or halfway houses for drug/alcohol abuse
Fatal accident statistics in 2013:
Fatal accident count: 1
Vehicles involved in fatal accidents: 2
Fatal accidents caused by drunken drivers: 1
Fatalities: 1
Persons involved in fatal accidents: 4
Pedestrians involved in fatal accidents: 0
Fatal accident statistics in 2012:
Fatal accident count: 1
Vehicles involved in fatal accidents: 1
Fatal accidents caused by drunken drivers: 1
Fatalities: 1
Persons involved in fatal accidents: 1
Pedestrians involved in fatal accidents: 0
Most common first names in zip code 16374 among deceased individuals
Name
Count
Lived (average)
Robert
15
71.3 years
William
13
72.4 years
John
13
72.8 years
Charles
12
75.6 years
Mary
11
78.0 years
James
11
68.8 years
George
10
75.3 years
Helen
9
76.3 years
Joseph
9
76.8 years
Richard
7
77.3 years
Most common last names in zip code 16374 among deceased individuals
Last name
Count
Lived (average)
Bell
8
81.9 years
Smith
8
80.4 years
Miller
6
67.8 years
Brown
5
82.4 years
Sweetapple
5
74.4 years
Snyder
5
76.8 years
Carner
5
81.6 years
Shaffer
5
76.2 years
Witherup
4
78.7 years
Cox
4
85.7 years
Discuss Kennerdell, Pennsylvania (PA) on our hugely popular Pennsylvania forum.
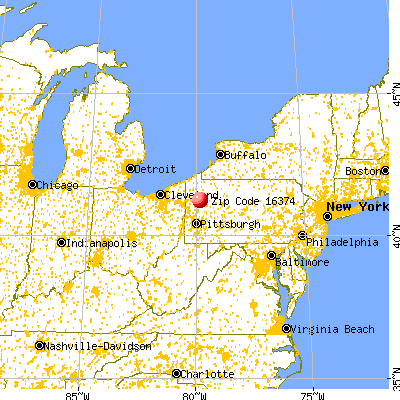


 Nearest zip codes: 16372, 16030, 16373, 16342, 16323, 16038.