Estimated zip code population in 2022: 3,280 Zip code population in 2010: 3,269 Zip code population in 2000: 3,384
Houses and condos: 1,511 Renter-occupied apartments: 210
% of renters here:
17%
State:
31%
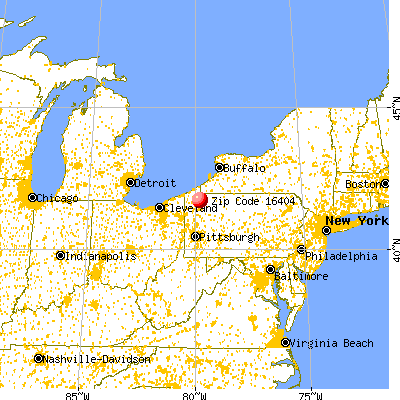
March 2022 cost of living index in zip code 16404: 91.7 (less than average, U.S. average is 100)
Land area: 90.2 sq. mi. Water area: 0.1 sq. mi.
Population density: 36 people per square mile
(very low).
OSM Map
General Map
Google Map
MSN Map
OSM Map
General Map
Google Map
MSN Map
OSM Map
General Map
Google Map
MSN Map
OSM Map
General Map
Google Map
MSN Map
Please wait while loading the map...
Real estate property taxes paid for housing units in 2022:
This zip code:
1.1% ($1,698)
Pennsylvania:
1.3% ($3,094)
Median real estate property taxes paid for housing units with mortgages in 2022: $1,806 (1.2%) Median real estate property taxes paid for housing units with no mortgage in 2022: $1,590 (1.1%)
Business Search- 14 Million verified businesses
Males: 1,707
(52.0%)
Females: 1,573
(48.0%)
For population 25 years and over in 16404:
High school or higher: 79.8%
Bachelor's degree or higher: 12.6%
Graduate or professional degree: 3.4%
Unemployed: 6.9%
Mean travel time to work (commute): 27.9 minutes
For population 15 years and over in 16404:
Never married: 25.6%
Now married: 56.1%
Separated: 1.1%
Widowed: 7.1%
Divorced: 10.1%
Zip code 16404 compared to state average:
Median house value below state average.
Black race population percentage significantly below state average.
Hispanic race population percentage significantly below state average.
Foreign-born population percentage significantly below state average.
Renting percentage below state average.
Length of stay since moving in significantly above state average.
Number of college students below state average.
Percentage of population with a bachelor's degree or higher significantly below state average.
Averages for the 2020 tax year for zip code 16404, filed in 2021:
Average Adjusted Gross Income (AGI) in 2020: $46,563 (Individual Income Tax Returns)
Here:
$46,563
State:
$75,707
Salary/wage: $41,886 (reported on 74.0% of returns)
Here:
$41,886
State:
$62,806
(% of AGI for various income ranges: 1012.7% for AGIs below $25k, 3354.8% for AGIs $25k-50k, 5861.3% for AGIs $50k-75k, 8990.0% for AGIs $75k-100k, 18298.3% for AGIs $100k-200k)
Taxable interest for individuals: $794 (reported on 27.5% of returns)
This zip code:
$794
Pennsylvania:
$1,633
(% of AGI for various income ranges: 15.0% for AGIs below $25k, 5.9% for AGIs $25k-50k, 30.0% for AGIs $50k-75k, 11.1% for AGIs $75k-100k, 281.7% for AGIs $100k-200k)
Ordinary dividends: $3,188 (reported on 12.2% of returns)
Here:
$3,188
State:
$7,382
(% of AGI for various income ranges: 23.3% for AGIs below $25k, 14.5% for AGIs $25k-50k, 21.3% for AGIs $50k-75k, 610.0% for AGIs $100k-200k)
Net capital gain/loss in AGI: +$6,736 (reported on 10.7% of returns)
Here:
+$6,736
State:
+$23,522
(% of AGI for various income ranges: 14.0% for AGIs below $25k, 32.1% for AGIs $25k-50k, 33.3% for AGIs $50k-75k, 24.4% for AGIs $75k-100k, 1226.7% for AGIs $100k-200k)
Profit/loss from business: +$18,893 (reported on 22.1% of returns)
Here:
+$18,893
State:
+$16,274
(% of AGI for various income ranges: 265.3% for AGIs below $25k, 610.3% for AGIs $25k-50k, 727.3% for AGIs $50k-75k, 805.6% for AGIs $75k-100k, 1828.3% for AGIs $100k-200k)
Taxable individual retirement arrangement distribution: $11,446 (reported on 9.9% of returns)
16404:
$11,446
Pennsylvania:
$18,583
(% of AGI for various income ranges: 85.0% for AGIs below $25k, 110.0% for AGIs $25k-50k, 162.0% for AGIs $50k-75k, 745.6% for AGIs $75k-100k)
Earned income credit: $2,345 (reported on 16.8% of returns)
Here:
$2,345
State:
$2,100
(% of AGI for various income ranges: 90.7% for AGIs below $25k, 84.1% for AGIs $25k-50k)
Percentage of individuals using paid preparers for their 2020 taxes: 93.1%
Here:
93%
State:
92%
(% for various income ranges: 93.5% for AGIs below $25k, 92.5% for AGIs $25k-50k, 95.0% for AGIs $50k-75k, 92.3% for AGIs $75k-100k, 91.7% for AGIs $100k-200k)
Averages for the 2012 tax year for zip code 16404, filed in 2013:
Average Adjusted Gross Income (AGI) in 2012: $41,344 (Individual Income Tax Returns)
Here:
$41,344
State:
$61,346
Salary/wage: $35,618 (reported on 76.3% of returns)
Here:
$35,618
State:
$51,902
(% of AGI for various income ranges: 66.5% for AGIs below $25k, 74.0% for AGIs $25k-50k, 76.0% for AGIs $50k-75k, 75.7% for AGIs $75k-100k, 44.3% for AGIs $100k-200k)
Taxable interest for individuals: $932 (reported on 29.6% of returns)
This zip code:
$932
Pennsylvania:
$1,588
(% of AGI for various income ranges: 1.0% for AGIs below $25k, 1.1% for AGIs $25k-50k, 0.3% for AGIs $50k-75k, 0.4% for AGIs $75k-100k, 0.6% for AGIs $100k-200k)
Ordinary dividends: $3,041 (reported on 12.6% of returns)
Here:
$3,041
State:
$5,827
(% of AGI for various income ranges: 1.2% for AGIs below $25k, 0.6% for AGIs $25k-50k, 1.9% for AGIs $50k-75k, 0.6% for AGIs $75k-100k, 0.5% for AGIs $100k-200k)
Net capital gain/loss in AGI: +$10,179 (reported on 10.4% of returns)
Here:
+$10,179
State:
+$14,495
(% of AGI for various income ranges: 0.5% for AGIs below $25k, 0.5% for AGIs $25k-50k, 1.7% for AGIs $75k-100k, 7.9% for AGIs $100k-200k)
Profit/loss from business: +$15,462 (reported on 21.5% of returns)
Here:
+$15,462
State:
+$16,268
(% of AGI for various income ranges: 15.4% for AGIs below $25k, 9.7% for AGIs $25k-50k, 6.6% for AGIs $50k-75k, 15.3% for AGIs $75k-100k)
Taxable individual retirement arrangement distribution: $8,836 (reported on 8.1% of returns)
16404:
$8,836
Pennsylvania:
$14,550
(% of AGI for various income ranges: 2.6% for AGIs below $25k, 1.5% for AGIs $25k-50k, 5.0% for AGIs $50k-75k)
Total itemized deductions: $16,056 (16% of AGI, reported on 11.9% of returns)
Here:
$16,056
State:
$23,538
Here:
16.2% of AGI
State:
18.4% of AGI
(% of AGI for various income ranges: 4.8% for AGIs $25k-50k, 4.8% for AGIs $50k-75k, 5.3% for AGIs $75k-100k, 6.1% for AGIs $100k-200k)
Charity contributions: $3,333 (reported on 6.7% of returns)
Here:
$3,333
State:
$4,025
(% of AGI for various income ranges: 1.0% for AGIs below $25k, 1.1% for AGIs $50k-75k, 0.7% for AGIs $100k-200k)
Taxes paid: $5,900 (reported on 11.9% of returns)
16404:
$5,900
State:
$9,982
(% of AGI for various income ranges: 1.0% for AGIs $25k-50k, 1.5% for AGIs $50k-75k, 2.1% for AGIs $75k-100k, 3.1% for AGIs $100k-200k)
Earned income credit: $2,142 (reported on 17.8% of returns)
Here:
$2,142
State:
$2,106
(% of AGI for various income ranges: 5.0% for AGIs below $25k, 1.1% for AGIs $25k-50k)
Percentage of individuals using paid preparers for their 2012 taxes: 56.3%
Here:
56%
State:
53%
(% for various income ranges: 51.7% for AGIs below $25k, 57.9% for AGIs $25k-50k, 57.9% for AGIs $50k-75k, 70.0% for AGIs $75k-100k, 62.5% for AGIs $100k-200k)
Averages for the 2004 tax year for zip code 16404, filed in 2005:
Average Adjusted Gross Income (AGI) in 2004: $29,273 (Individual Income Tax Returns)
Here:
$29,273
State:
$48,049
Salary/wage: $27,494 (reported on 77.2% of returns)
Here:
$27,494
State:
$42,646
(% of AGI for various income ranges: 78.8% for AGIs below $10k, 69.9% for AGIs $10k-25k, 73.3% for AGIs $25k-50k, 80.8% for AGIs $50k-75k, 70.2% for AGIs $75k-100k, 42.0% for AGIs over 100k)
Taxable interest for individuals: $872 (reported on 43.5% of returns)
This zip code:
$872
Pennsylvania:
$1,657
(% of AGI for various income ranges: 9.0% for AGIs below $10k, 1.5% for AGIs $10k-25k, 1.3% for AGIs $25k-50k, 0.6% for AGIs $50k-75k, 0.7% for AGIs $75k-100k, 1.1% for AGIs over 100k)
Taxable dividends: $1,546 (reported on 15.4% of returns)
Here:
$1,546
State:
$3,566
(% of AGI for various income ranges: 3.3% for AGIs below $10k, 0.8% for AGIs $10k-25k, 0.6% for AGIs $25k-50k, 0.2% for AGIs $50k-75k, 2.9% for AGIs $75k-100k)
Net capital gain/loss: +$6,312 (reported on 13.3% of returns)
Here:
+$6,312
State:
+$9,716
(% of AGI for various income ranges: -1.8% for AGIs below $10k, 0.7% for AGIs $10k-25k, 1.5% for AGIs $25k-50k, 1.0% for AGIs $50k-75k, 4.8% for AGIs $75k-100k, 21.7% for AGIs over 100k)
Profit/loss from business: +$12,687 (reported on 24.3% of returns)
Here:
+$12,687
State:
+$14,267
(% of AGI for various income ranges: 13.1% for AGIs below $10k, 13.9% for AGIs $10k-25k, 10.7% for AGIs $25k-50k, 6.2% for AGIs $50k-75k, 22.0% for AGIs $75k-100k)
IRA payment deduction: $3,174 (reported on 1.7% of returns)
16404:
$3,174
Pennsylvania:
$2,903
Total itemized deductions: $14,224 (24% of AGI, reported on 11.7% of returns)
Here:
$14,224
State:
$18,804
Here:
23.9% of AGI
State:
19.5% of AGI
(% of AGI for various income ranges: 3.4% for AGIs $10k-25k, 5.2% for AGIs $25k-50k, 6.3% for AGIs $50k-75k, 8.1% for AGIs $75k-100k, 10.5% for AGIs over 100k)
Charity contributions deductions: $3,076 (5% of AGI, reported on 7.9% of returns)
Here:
$3,076
State:
$3,337
Here:
4.9% of AGI
State:
3.3% of AGI
Total tax: $3,182 (reported on 67.8% of returns)
16404:
$3,182
State:
$8,008
(% of AGI for various income ranges: 4.1% for AGIs below $10k, 4.3% for AGIs $10k-25k, 5.9% for AGIs $25k-50k, 8.3% for AGIs $50k-75k, 9.5% for AGIs $75k-100k, 17.2% for AGIs over 100k)
Earned income credit: $1,671 (reported on 17.8% of returns)
Here:
$1,671
State:
$1,643
Percentage of individuals using paid preparers for their 2004 taxes: 65.0%
Here:
65%
State:
56%
(% for various income ranges: 62.6% for AGIs below $10k, 59.2% for AGIs $10k-25k, 70.0% for AGIs $25k-50k, 67.1% for AGIs $50k-75k, 67.3% for AGIs $75k-100k, 88.9% for AGIs over 100k)
Household received Food Stamps/SNAP in the past 12 months: 214 Household did not receive Food Stamps/SNAP in the past 12 months: 1,003
Women who had a birth in the past 12 months: 57 (42 now married, 14 unmarried) Women who did not have a birth in the past 12 months: 598 (246 now married, 351 unmarried)
Housing units in zip code 16404 with a mortgage: 392 (46 second mortgage, 33 both second mortgage and home equity loan) Houses without a mortgage: 32
Median monthly owner costs for units with a mortgage: $977 Median monthly owner costs for units without a mortgage: $464
Residents with income below the poverty level in 2022:
This zip code:
19.9%
Whole state:
11.8%
Residents with income below 50% of the poverty level in 2022:
This zip code:
12.3%
Whole state:
6.1%
Median number of rooms in houses and condos:
Here:
6.2
State:
6.8
Median number of rooms in apartments:
Here:
4.8
State:
4.3
Notable locations in this zip code not listed on our city pages
Notable locations in zip code 16404: Green Acres Golf Course (A), Grays Mills Station (B), Brimstone Corners (C), Clements Corners (D), Cloverdale Corners (E), Crabs Corners (F), Koochogey Corners (G), Mageetown Corners (H), Markley Corners (I), McGinnet Corners (J), Morehead Corners (K), Moss Grove Corners (L), Smith Corners (M), Steuben Corners (N), Dannart Corners (O), Tryonville Station (P), Whitman Corners (Q), Drake Corners (R), Centerville Volunteer Fire Department (S). Display/hide their locations on the map
Churches in zip code 16404 include: Highway Tabernacle (A), Gilson Ridge Church (B), Fink Ridge Church (C), Oil Creek Chapel (D), Immaculate Conception Church (E). Display/hide their locations on the map
Streams, rivers, and creeks: Twomile Creek (A), Mosey Run (B), Federal Run (C), East Branch Oil Creek (D), Marsh Run (E), Dolly Run (F), DeWolfe Run (G), Britton Run (H), Bloomfield Run (I). Display/hide their locations on the map
568 married couples with children.
144 single-parent households (103 men, 41 women).
86.2% of residents of 16404 zip code speak English at home.
0.3% of residents speak Spanish at home (100% well).
14.0% of residents speak other Indo-European language at home (39% very well, 45% well, 16% not well).
0.3% of residents speak Asian or Pacific Island language at home (78% very well, 11% well, 11% not well).
Foreign born population: 14 (0.4%) (29.4% of them are naturalized citizens)
This zip code:
0.4%
Whole state:
7.5%
64%Honduras
14%United Kingdom, excluding England and Scotland
14%Thailand
7%Sweden
7%Japan
27%English
21%German
17%American
7%Irish
5%European
3%Italian
3%Pennsylvania German
Year of entry for the foreign-born population
12010 or later
12000 to 2009
21990 to 1999
11Before 1990
Facilities with environmental interests located in this zip code:
AEP CENTERVILLE (ERIE STREET in CENTERVILLE, PA)
AIR MINOR (AIRS/AFS) STATE MASTER (Pennsylvania database) - AFS-15-0277720-25, AIR PROGRAM Business SIC classification: PREPARED FEEDS AND FEED INGREDIENTS FOR ANIMALS AND FOWLS, EXCEPT DOGS AND CATS Alternative names: AGWAY INC, AGWAY INC/CENTERVILLE
Housing units lacking complete plumbing facilities: 11.6% Housing units lacking complete kitchen facilities: 10.5%
34.8%Bottled, tank, or LP gas
19.3%Wood
14.5%Fuel oil, kerosene, etc.
13.8%Electricity
8.6%Utility gas
5.8%Other fuel
3.3%Coal or coke
Population in 1990: 2,119. Population change in the 1990s: +1,265 (+59.7%).
Place of birth for U.S.-born residents:
This state: 2,733
Northeast: 130
Midwest: 233
South: 97
West: 51
70% of the 16404 zip code residents lived in the same house 5 years ago. Out of people who lived in different houses, 56% lived in this county. Out of people who lived in different counties, 50% lived in Pennsylvania.
94% of the 16404 zip code residents lived in the same house 1 year ago. Out of people who lived in different houses, 82% moved from this county. Out of people who lived in different houses, 14% moved from different county within same state. Out of people who lived in different houses, 6% moved from different state.
Private vs. public school enrollment:
Students in private schools in grades 1 to 8 (elementary and middle school): 134
Here:
36.7%
Pennsylvania:
15.7%
Students in private schools in grades 9 to 12 (high school): 18
Here:
12.7%
Pennsylvania:
13.4%
Students in private undergraduate colleges: 15
Here:
39.6%
Pennsylvania:
39.8%
Occupation by median earnings in the past 12 months ($)
69,418Architecture and engineering occupations
56,620Construction and extraction occupations
51,007Health diagnosing and treating practitioners and other technical occupations
47,498Farming, fishing, and forestry occupations
46,414Management occupations
45,395Health technologists and technicians
Top industries in this zip code by the number of employees in 2005:
Wholesale Trade: Automobile and Other Motor Vehicle Merchant Wholesalers (10-19 employees: 1 establishment)
Accommodation and Food Services: Full-Service Restaurants (5-9: 2)
Health Care and Social Assistance: Home Health Care Services (5-9: 1)
Construction: Oil and Gas Pipeline and Related Structures Construction (5-9: 1)
Other Services (except Public Administration): Religious Organizations (1-4: 3)
People in group quarters in 2000:
15 people in nursing homes
Fatal accident statistics in 2013:
Fatal accident count: 3
Vehicles involved in fatal accidents: 4
Fatal accidents caused by drunken drivers: 0
Fatalities: 3
Persons involved in fatal accidents: 3
Pedestrians involved in fatal accidents: 0
Fatal accident statistics in 2012:
Fatal accident count: 1
Vehicles involved in fatal accidents: 1
Fatal accidents caused by drunken drivers: 0
Fatalities: 1
Persons involved in fatal accidents: 1
Pedestrians involved in fatal accidents: 0
2007 - 2018 National Fire Incident Reporting System (NFIRS) incidents
Based on the data from the years 2007 - 2018 the average number of fire incidents per year is 9. The highest number of reported fires - 26 took place in 2018, and the least - 0 in 2010. The data has an increasing trend.
When looking into fire subcategories, the most reports belonged to: Structure Fires (73.6%), and Outside Fires (12.3%).
Fire incident types reported to NFIRS in Zip Code 16404


 Nearest zip codes: 16328, 16360, 16434, 16354, 16438, 16327.


 Based on the data from the years 2007 - 2018 the average number of fire incidents per year is 9. The highest number of reported fires - 26 took place in 2018, and the least - 0 in 2010. The data has an increasing trend.
 When looking into fire subcategories, the most reports belonged to: Structure Fires (73.6%), and Outside Fires (12.3%).