Estimated zip code population in 2022: 1,786 Zip code population in 2010: 2,036 Zip code population in 2000: 1,698
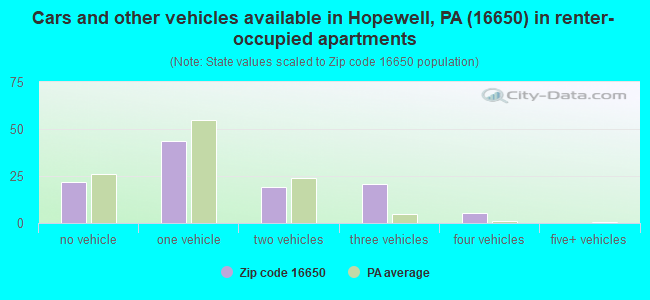
Houses and condos: 938 Renter-occupied apartments: 111
% of renters here:
16%
State:
31%
March 2022 cost of living index in zip code 16650: 91.3 (less than average, U.S. average is 100)
Land area: 44.9 sq. mi. Water area: 0.4 sq. mi.
Population density: 40 people per square mile
(very low).
OSM Map
General Map
Google Map
MSN Map
OSM Map
General Map
Google Map
MSN Map
OSM Map
General Map
Google Map
MSN Map
OSM Map
General Map
Google Map
MSN Map
Please wait while loading the map...
Real estate property taxes paid for housing units in 2022:
This zip code:
0.6% ($963)
Pennsylvania:
1.3% ($3,094)
Median real estate property taxes paid for housing units with mortgages in 2022: $1,060 (0.5%) Median real estate property taxes paid for housing units with no mortgage in 2022: $823 (0.7%)
Business Search- 14 Million verified businesses
Males: 937
(52.5%)
Females: 849
(47.5%)
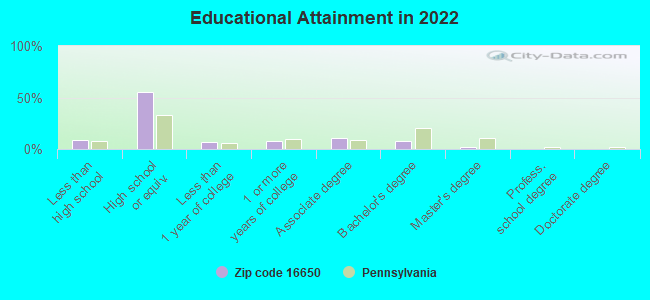
For population 25 years and over in 16650:
High school or higher: 89.5%
Bachelor's degree or higher: 10.6%
Graduate or professional degree: 3.1%
Unemployed: 6.1%
Mean travel time to work (commute): 31.5 minutes
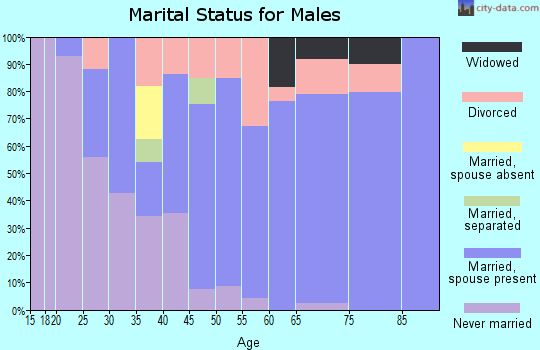
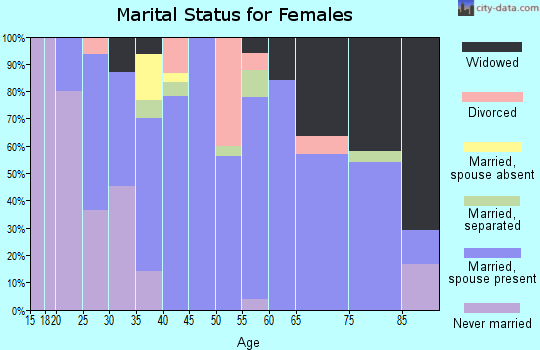
For population 15 years and over in 16650:
Never married: 23.9%
Now married: 60.4%
Separated: 1.0%
Widowed: 4.9%
Divorced: 9.8%
Zip code 16650 compared to state average:
Median house value below state average.
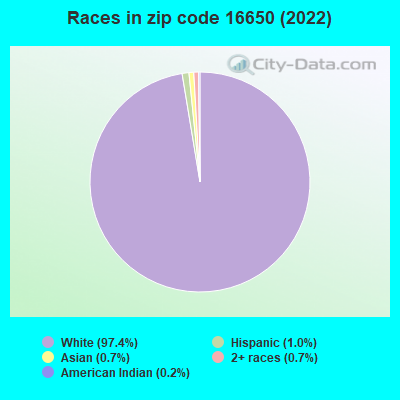
Black race population percentage significantly below state average.
Hispanic race population percentage significantly below state average.
Median age above state average.
Foreign-born population percentage significantly below state average.
Renting percentage below state average.
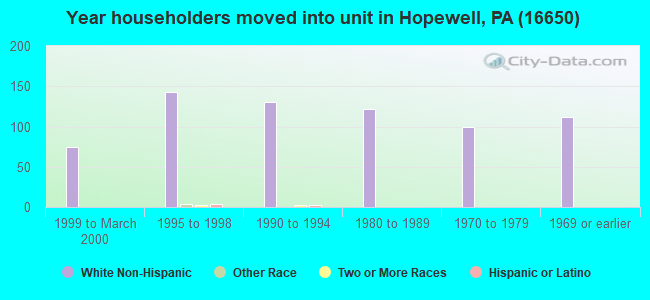
Length of stay since moving in significantly above state average.
Number of college students below state average.
Percentage of population with a bachelor's degree or higher significantly below state average.
Averages for the 2020 tax year for zip code 16650, filed in 2021:
Average Adjusted Gross Income (AGI) in 2020: $49,607 (Individual Income Tax Returns)
Here:
$49,607
State:
$75,707
Salary/wage: $44,647 (reported on 78.6% of returns)
Here:
$44,647
State:
$62,806
(% of AGI for various income ranges: 1026.0% for AGIs below $25k, 3361.7% for AGIs $25k-50k, 5984.0% for AGIs $50k-75k, 7837.1% for AGIs $75k-100k, 16490.0% for AGIs $100k-200k)
Taxable interest for individuals: $682 (reported on 20.2% of returns)
This zip code:
$682
Pennsylvania:
$1,633
(% of AGI for various income ranges: 12.0% for AGIs below $25k, 35.6% for AGIs $25k-50k, 10.0% for AGIs $50k-75k, 11.4% for AGIs $75k-100k, 16.7% for AGIs $100k-200k)
Ordinary dividends: $778 (reported on 10.7% of returns)
Here:
$778
State:
$7,382
(% of AGI for various income ranges: 16.0% for AGIs below $25k, 9.4% for AGIs $25k-50k, 30.0% for AGIs $75k-100k)
Net capital gain/loss in AGI: +$775 (reported on 9.5% of returns)
Here:
+$775
State:
+$23,522
(% of AGI for various income ranges: 31.1% for AGIs $25k-50k, 8.6% for AGIs $75k-100k)
Profit/loss from business: +$14,510 (reported on 11.9% of returns)
Here:
+$14,510
State:
+$16,274
(% of AGI for various income ranges: 110.5% for AGIs below $25k, 101.7% for AGIs $25k-50k, 293.0% for AGIs $50k-75k, 1077.1% for AGIs $75k-100k)
Taxable individual retirement arrangement distribution: $14,675 (reported on 9.5% of returns)
16650:
$14,675
Pennsylvania:
$18,583
(% of AGI for various income ranges: 117.5% for AGIs below $25k, 188.9% for AGIs $25k-50k, 599.0% for AGIs $50k-75k)
Earned income credit: $2,075 (reported on 14.3% of returns)
Here:
$2,075
State:
$2,100
(% of AGI for various income ranges: 74.5% for AGIs below $25k, 55.6% for AGIs $25k-50k)
Percentage of individuals using paid preparers for their 2020 taxes: 91.7%
Here:
92%
State:
92%
(% for various income ranges: 89.7% for AGIs below $25k, 91.3% for AGIs $25k-50k, 92.3% for AGIs $50k-75k, 88.9% for AGIs $75k-100k, 100.0% for AGIs $100k-200k)
Averages for the 2012 tax year for zip code 16650, filed in 2013:
Average Adjusted Gross Income (AGI) in 2012: $41,258 (Individual Income Tax Returns)
Here:
$41,258
State:
$61,346
Salary/wage: $36,694 (reported on 82.7% of returns)
Here:
$36,694
State:
$51,902
(% of AGI for various income ranges: 62.1% for AGIs below $25k, 81.3% for AGIs $25k-50k, 77.3% for AGIs $50k-75k, 78.3% for AGIs $75k-100k, 62.6% for AGIs $100k-200k)
Taxable interest for individuals: $638 (reported on 25.9% of returns)
This zip code:
$638
Pennsylvania:
$1,588
(% of AGI for various income ranges: 0.9% for AGIs below $25k, 0.4% for AGIs $25k-50k, 0.5% for AGIs $50k-75k, 0.3% for AGIs $75k-100k)
Ordinary dividends: $730 (reported on 12.3% of returns)
Here:
$730
State:
$5,827
(% of AGI for various income ranges: 0.5% for AGIs below $25k, 0.3% for AGIs $50k-75k, 0.5% for AGIs $75k-100k)
Net capital gain/loss in AGI: +$4,683 (reported on 7.4% of returns)
Here:
+$4,683
State:
+$14,495
Profit/loss from business: +$8,069 (reported on 16.0% of returns)
Here:
+$8,069
State:
+$16,268
(% of AGI for various income ranges: 13.1% for AGIs below $25k, 2.9% for AGIs $25k-50k, 3.0% for AGIs $50k-75k)
Taxable individual retirement arrangement distribution: $9,862 (reported on 9.9% of returns)
16650:
$9,862
Pennsylvania:
$14,550
Total itemized deductions: $17,450 (23% of AGI, reported on 14.8% of returns)
Here:
$17,450
State:
$23,538
Here:
22.9% of AGI
State:
18.4% of AGI
(% of AGI for various income ranges: 6.8% for AGIs $25k-50k, 10.5% for AGIs $50k-75k, 9.6% for AGIs $100k-200k)
Charity contributions: $2,400 (reported on 9.9% of returns)
Here:
$2,400
State:
$4,025
(% of AGI for various income ranges: 0.9% for AGIs below $25k, 0.7% for AGIs $50k-75k, 1.4% for AGIs $100k-200k)
Taxes paid: $4,508 (reported on 14.8% of returns)
16650:
$4,508
State:
$9,982
(% of AGI for various income ranges: 1.2% for AGIs $25k-50k, 2.5% for AGIs $50k-75k, 3.4% for AGIs $100k-200k)
Earned income credit: $1,839 (reported on 22.2% of returns)
Here:
$1,839
State:
$2,106
(% of AGI for various income ranges: 5.2% for AGIs below $25k, 1.4% for AGIs $25k-50k)
Percentage of individuals using paid preparers for their 2012 taxes: 64.2%
Here:
64%
State:
53%
(% for various income ranges: 58.8% for AGIs below $25k, 66.7% for AGIs $25k-50k, 71.4% for AGIs $50k-75k, 71.4% for AGIs $75k-100k, 60.0% for AGIs $100k-200k)
Averages for the 2004 tax year for zip code 16650, filed in 2005:
Average Adjusted Gross Income (AGI) in 2004: $30,828 (Individual Income Tax Returns)
Here:
$30,828
State:
$48,049
Salary/wage: $29,128 (reported on 85.8% of returns)
Here:
$29,128
State:
$42,646
(% of AGI for various income ranges: 86.5% for AGIs below $10k, 75.1% for AGIs $10k-25k, 80.9% for AGIs $25k-50k, 93.1% for AGIs $50k-75k, 84.8% for AGIs $75k-100k, 43.5% for AGIs over 100k)
Taxable interest for individuals: $1,022 (reported on 33.9% of returns)
This zip code:
$1,022
Pennsylvania:
$1,657
(% of AGI for various income ranges: 5.1% for AGIs below $10k, 2.7% for AGIs $10k-25k, 1.0% for AGIs $25k-50k, 0.6% for AGIs $50k-75k, 0.7% for AGIs $75k-100k)
Taxable dividends: $657 (reported on 12.8% of returns)
Here:
$657
State:
$3,566
(% of AGI for various income ranges: 0.3% for AGIs $10k-25k, 0.3% for AGIs $25k-50k, 0.3% for AGIs $50k-75k, 0.2% for AGIs $75k-100k)
Net capital gain/loss: +$4,879 (reported on 8.2% of returns)
Here:
+$4,879
State:
+$9,716
(% of AGI for various income ranges: 1.9% for AGIs below $10k, 0.4% for AGIs $25k-50k, -0.0% for AGIs $50k-75k, 14.9% for AGIs $75k-100k)
Profit/loss from business: +$4,156 (reported on 12.0% of returns)
Here:
+$4,156
State:
+$14,267
(% of AGI for various income ranges: -11.0% for AGIs below $10k, 6.0% for AGIs $10k-25k, 2.5% for AGIs $25k-50k, 0.2% for AGIs $50k-75k)
IRA payment deduction: $600 (reported on 1.2% of returns)
16650:
$600
Pennsylvania:
$2,903
Total itemized deductions: $13,732 (24% of AGI, reported on 15.9% of returns)
Here:
$13,732
State:
$18,804
Here:
24.1% of AGI
State:
19.5% of AGI
(% of AGI for various income ranges: 3.1% for AGIs $10k-25k, 6.0% for AGIs $25k-50k, 10.1% for AGIs $50k-75k, 19.3% for AGIs $75k-100k)
Charity contributions deductions: $1,671 (3% of AGI, reported on 9.5% of returns)
Here:
$1,671
State:
$3,337
Here:
2.6% of AGI
State:
3.3% of AGI
Total tax: $3,177 (reported on 72.8% of returns)
16650:
$3,177
State:
$8,008
(% of AGI for various income ranges: 4.1% for AGIs below $10k, 4.4% for AGIs $10k-25k, 5.8% for AGIs $25k-50k, 8.8% for AGIs $50k-75k, 10.0% for AGIs $75k-100k, 15.3% for AGIs over 100k)
Earned income credit: $1,474 (reported on 21.6% of returns)
Here:
$1,474
State:
$1,643
Percentage of individuals using paid preparers for their 2004 taxes: 63.6%
Here:
64%
State:
56%
(% for various income ranges: 55.2% for AGIs below $10k, 65.5% for AGIs $10k-25k, 65.0% for AGIs $25k-50k, 65.5% for AGIs $50k-75k, 77.3% for AGIs $75k-100k, 76.9% for AGIs over 100k)
Household received Food Stamps/SNAP in the past 12 months: 98 Household did not receive Food Stamps/SNAP in the past 12 months: 605
Women who had a birth in the past 12 months: 20 (10 now married, 8 unmarried) Women who did not have a birth in the past 12 months: 380 (206 now married, 172 unmarried)
Housing units in zip code 16650 with a mortgage: 325 (60 second mortgage, 60 both second mortgage and home equity loan) Houses without a mortgage: 32
Median monthly owner costs for units with a mortgage: $1,210 Median monthly owner costs for units without a mortgage: $384
Residents with income below the poverty level in 2022:
This zip code:
18.4%
Whole state:
11.8%
Residents with income below 50% of the poverty level in 2022:
This zip code:
7.2%
Whole state:
6.1%
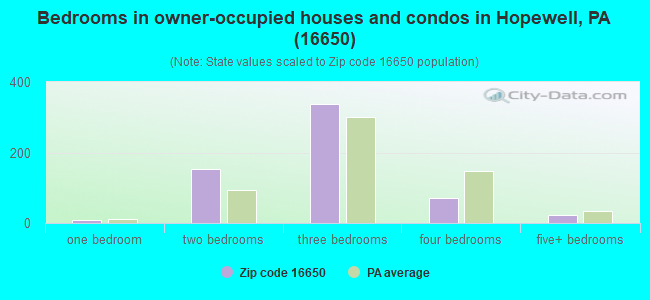
Median number of rooms in houses and condos:
Here:
6.3
State:
6.8
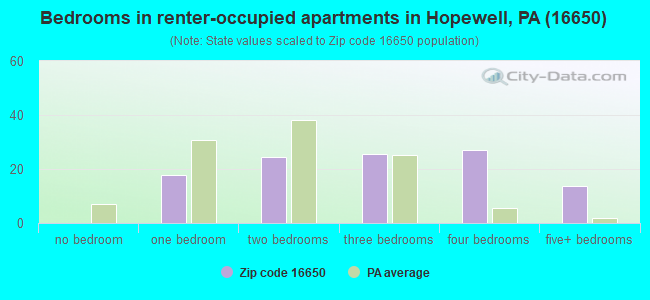
Median number of rooms in apartments:
Here:
6.1
State:
4.3
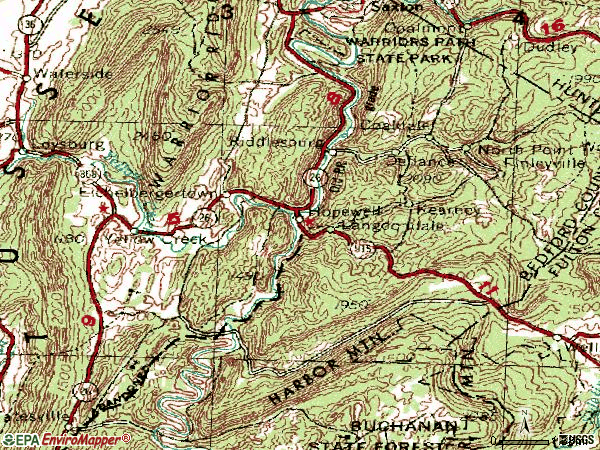
Notable locations in this zip code not listed on our city pages
Churches in zip code 16650 include: Bedford Church (A), Grace Church (B), Saint Pauls Church (C), Sherman Valley Church (D). Display/hide their locations on the map
Streams, rivers, and creeks: Yellow Creek (A), Maple Run (B), Longs Run (C), Sherman Valley Run (D), Sandy Run (E), Bank Run (F), Pipers Run (G), Kimber Run (H). Display/hide their locations on the map
Size of family households: 242 2-persons, 116 3-persons, 118 4-persons, 14 5-persons, 15 6-persons
Size of nonfamily households: 173 1-person, 17 2-persons
289 married couples with children.
62 single-parent households (11 men, 51 women).
98.9% of residents of 16650 zip code speak English at home.
0.2% of residents speak Spanish at home (100% very well).
0.2% of residents speak other Indo-European language at home (100% very well).
0.1% of residents speak Asian or Pacific Island language at home (100% very well).
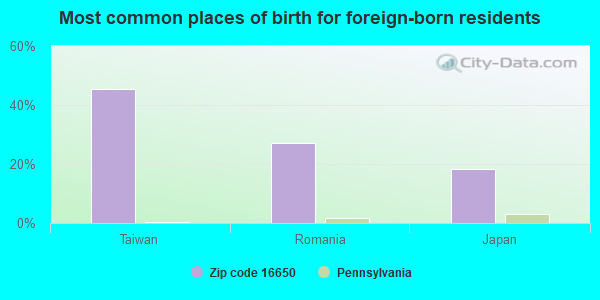
Foreign born population: 11 (0.7%) (100.0% of them are naturalized citizens)
This zip code:
0.7%
Whole state:
7.5%
45%Taiwan
27%Romania
18%Japan
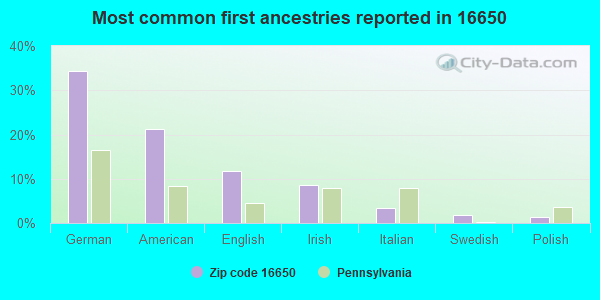
34%German
21%American
12%English
9%Irish
3%Italian
2%Swedish
1%Polish
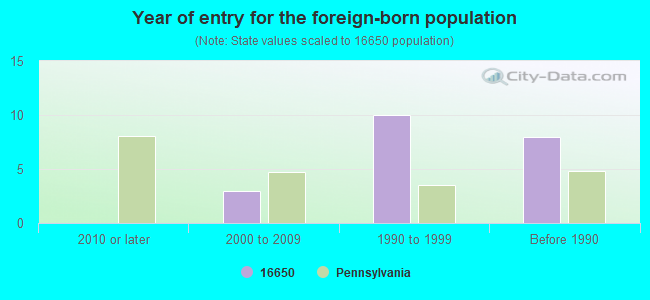
Year of entry for the foreign-born population
02010 or later
32000 to 2009
101990 to 1999
8Before 1990
Facilities with environmental interests located in this zip code:
BEDFORD-FULTON-HUNTINGDON SWA LANDFILL (TOWNSHIP ROAD 549 in HOPEWELL, PA)
CRITERIA AND HAZARDOUS AIR POLLUTANT INVENTORY (Inventory of air pollution sources) Business SIC classification: REFUSE SYSTEMS Business NAICS classification: SOLID WASTE LANDFILL.
Housing units lacking complete plumbing facilities: 8.7% Housing units lacking complete kitchen facilities: 5.8%
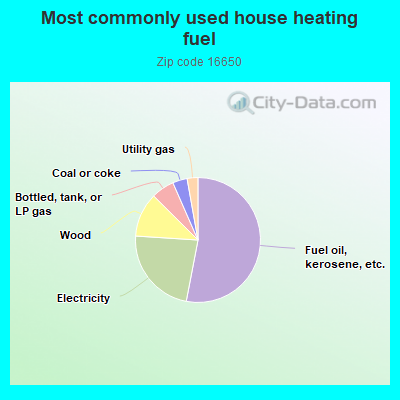
53.3%Fuel oil, kerosene, etc.
23.1%Electricity
11.5%Wood
6.0%Bottled, tank, or LP gas
3.8%Coal or coke
2.8%Utility gas
Population in 1990: 2,440.
Place of birth for U.S.-born residents:
This state: 1,615
Northeast: 39
Midwest: 24
South: 63
West: 3
72% of the 16650 zip code residents lived in the same house 5 years ago. Out of people who lived in different houses, 69% lived in this county. Out of people who lived in different counties, 50% lived in Pennsylvania.
95% of the 16650 zip code residents lived in the same house 1 year ago. Out of people who lived in different houses, 50% moved from this county. Out of people who lived in different houses, 26% moved from different county within same state. Out of people who lived in different houses, 19% moved from different state. Out of people who lived in different houses, 8% moved from abroad.
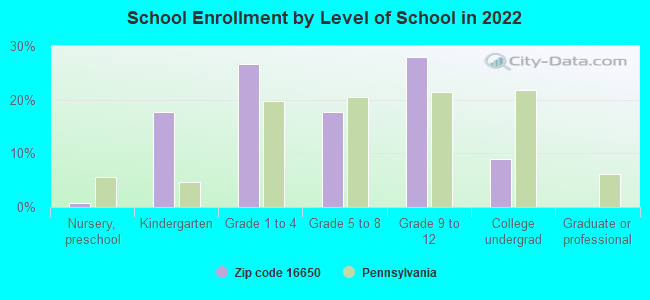
Private vs. public school enrollment:
Students in private schools in grades 1 to 8 (elementary and middle school):
Here:
0.0%
Pennsylvania:
15.7%
Students in private schools in grades 9 to 12 (high school): 8
Here:
8.1%
Pennsylvania:
13.4%
Students in private undergraduate colleges:
Here:
0.0%
Pennsylvania:
39.8%
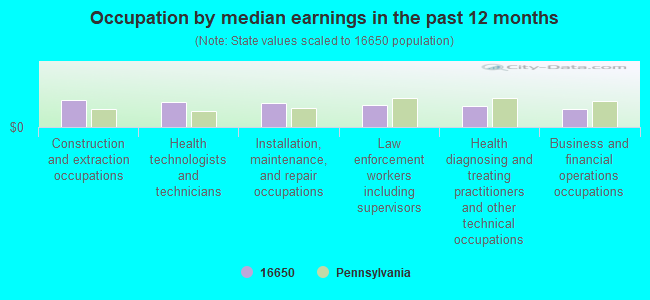
Occupation by median earnings in the past 12 months ($)
74,334Construction and extraction occupations
69,959Health technologists and technicians
67,149Installation, maintenance, and repair occupations
61,090Law enforcement workers including supervisors
57,214Health diagnosing and treating practitioners and other technical occupations
48,212Business and financial operations occupations
Companies with federal contracts located in this zip code:
WASTE SYSTEMS INTERNATIONAL IN (995 LANDFILL ROAD in HOPEWELL, PA; small business) : $93,110 in 7 contractsfrom 2000 to 2003
Contracts for Trash/Garbage Collection Services - Including Portable Sanitation Services by U.S. Army Corps of Engineers - civil program financing only, Army Signed by year:2000: $40,504; 2001: $0; 2002: $51,706; 2003: $900; 2004: $0; 2005: $0; 2006: $0.
Biggest contracts:
$53,615 with U.S. Army Corps of Engineers - civil program financing only for Trash/Garbage Collection Services - Including Portable Sanitation Services. Signed on 2003-01-15. Completion date: 2003-12-31.
$50,626, same as above.Signed on 2002-01-17. Completion date: 2003-12-31.
$40,504, same as above.Signed on 2000-03-13. Completion date: 2003-12-31.
$1,080 with Army for Trash/Garbage Collection Services - Including Portable Sanitation Services. Signed on 2002-10-01. Completion date: 2003-09-30.
KOUNTRY KETTLE RESTAURANT (2841 RAYSTOWN RD in HOPEWELL, PA; small business) : $2,640 in 2 contractsin 2003
$4,620 with Army for Dairy Foods and Eggs. Signed on 2003-06-04. Completion date: 2003-07-25.
-$1,980, same as above.Signed on 2003-08-27. Completion date: 2003-07-25.
NORTHEAST WASTE SERVICES (995 LANDFILL RD in HOPEWELL, PA)
$2,000 with Public Buildings Service for Trash/Garbage Collection Services - Including Portable Sanitation Services. Signed on 2000-08-15. Completion date: 2000-09-15.
Top industries in this zip code by the number of employees in 2005:
Construction: Other Building Equipment Contractors (20-49 employees: 1 establishment)
Administrative and Support and Waste Management and Remediation Services: Remediation Services (20-49: 1)
Accommodation and Food Services: Full-Service Restaurants (10-19: 2)
Administrative and Support and Waste Management and Remediation Services: Solid Waste Collection (10-19: 1, 5-9: 1)
Other Services (except Public Administration): Religious Organizations (1-4: 2)
Arts, Entertainment, and Recreation: Fitness and Recreational Sports Centers (1-4: 1)
Health Care and Social Assistance: Offices of Physicians (except Mental Health Specialists) (1-4: 1)
Fatal accident statistics in 2012:
Fatal accident count: 1
Vehicles involved in fatal accidents: 1
Fatal accidents caused by drunken drivers: 1
Fatalities: 1
Persons involved in fatal accidents: 1
Pedestrians involved in fatal accidents: 0
Fatal accident statistics in 2011:
Fatal accident count: 1
Vehicles involved in fatal accidents: 1
Fatal accidents caused by drunken drivers: 1
Fatalities: 1
Persons involved in fatal accidents: 1
Pedestrians involved in fatal accidents: 0
Most common first names in zip code 16650 among deceased individuals
Name
Count
Lived (average)
John
26
76.1 years
William
20
71.9 years
Robert
20
71.5 years
Mary
18
81.4 years
James
16
70.8 years
Charles
13
77.5 years
Chester
8
73.7 years
David
8
74.5 years
Samuel
8
69.9 years
George
8
68.2 years
Most common last names in zip code 16650 among deceased individuals
Last name
Count
Lived (average)
Steele
14
76.7 years
Dodson
13
75.7 years
Young
12
79.2 years
Fluke
11
79.4 years
Kline
10
68.9 years
Ritchey
10
81.3 years
Hall
9
87.8 years
Pittman
9
71.1 years
Thomas
9
79.1 years
Zimmerman
9
80.9 years
Discuss Hopewell, Pennsylvania (PA) on our hugely popular Pennsylvania forum.
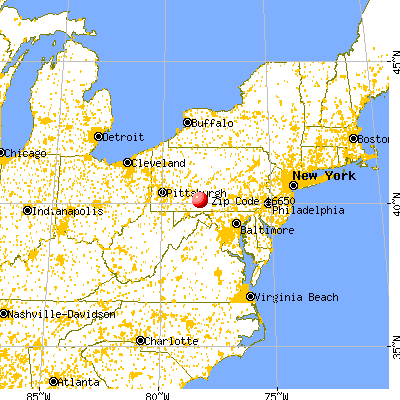


 Nearest zip codes: 16633, 16672, 16695, 16679, 16659, 16678.