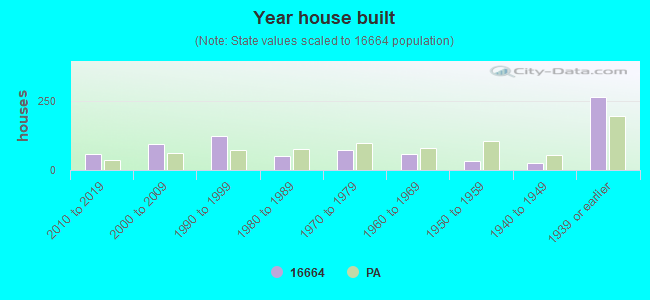
Estimated zip code population in 2022: 2,190 Zip code population in 2010: 2,104 Zip code population in 2000: 1,912
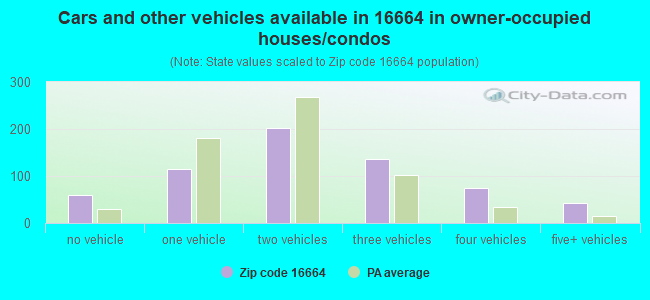
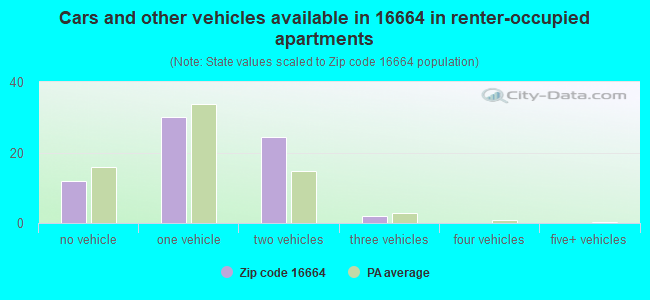
Houses and condos: 779 Renter-occupied apartments: 68
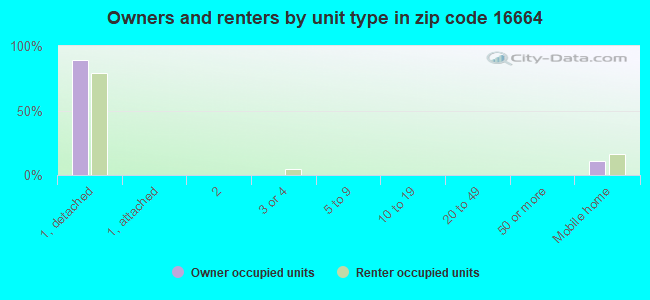
% of renters here:
10%
State:
31%
March 2022 cost of living index in zip code 16664: 90.9 (less than average, U.S. average is 100)
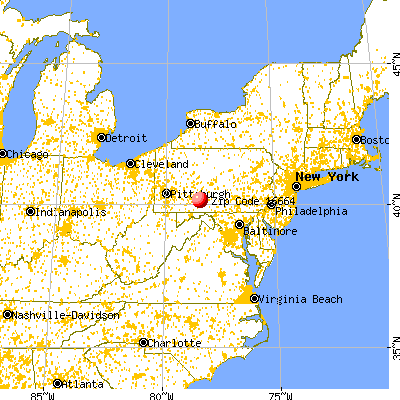
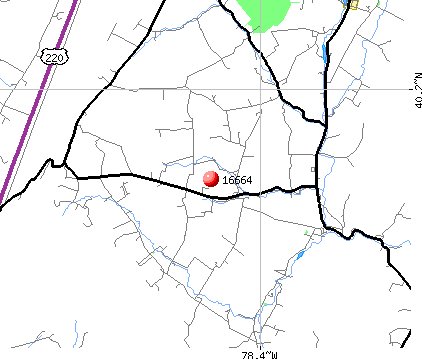
Land area: 40.9 sq. mi. Water area: 0.0 sq. mi.
Population density: 54 people per square mile
(very low).
OSM Map
General Map
Google Map
MSN Map
OSM Map
General Map
Google Map
MSN Map
OSM Map
General Map
Google Map
MSN Map
OSM Map
General Map
Google Map
MSN Map
Please wait while loading the map...
Real estate property taxes paid for housing units in 2022:
This zip code:
0.7% ($1,382)
Pennsylvania:
1.3% ($3,094)
Median real estate property taxes paid for housing units with mortgages in 2022: $1,425 (0.7%) Median real estate property taxes paid for housing units with no mortgage in 2022: $1,303 (0.8%)
Business Search- 14 Million verified businesses
Males: 1,086
(49.6%)
Females: 1,103
(50.4%)
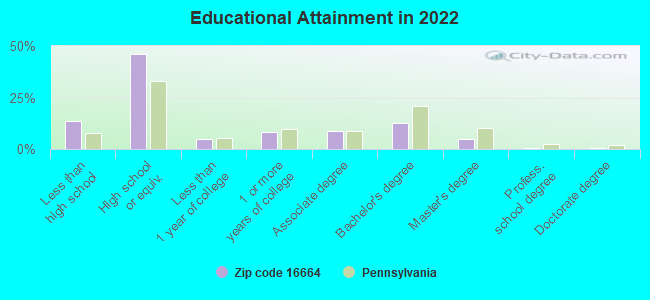
For population 25 years and over in 16664:
High school or higher: 84.3%
Bachelor's degree or higher: 17.9%
Graduate or professional degree: 5.7%
Unemployed: 2.0%
Mean travel time to work (commute): 24.9 minutes
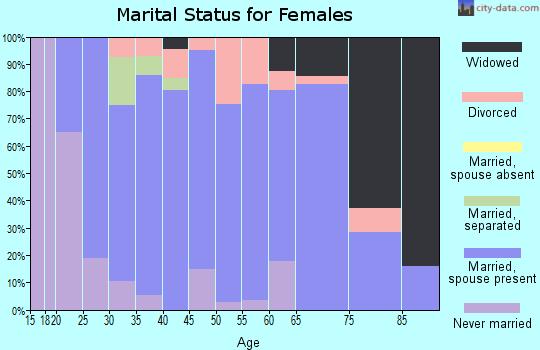
For population 15 years and over in 16664:
Never married: 26.3%
Now married: 60.0%
Separated: 1.4%
Widowed: 3.0%
Divorced: 9.3%
Zip code 16664 compared to state average:
Unemployed percentage below state average.
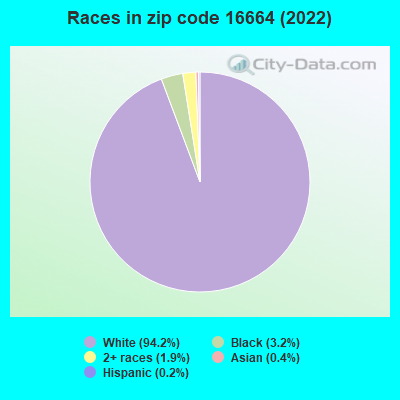
Black race population percentage significantly below state average.
Hispanic race population percentage significantly below state average.
Median age below state average.
Foreign-born population percentage significantly below state average.
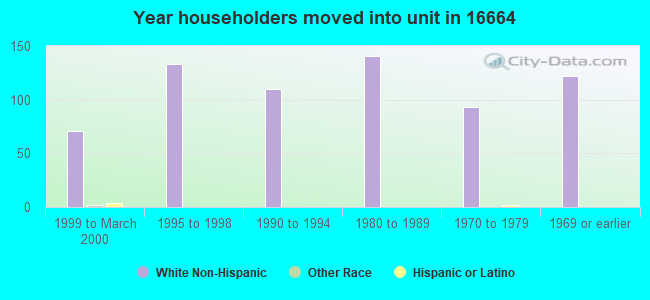
Renting percentage significantly below state average.
Length of stay since moving in significantly above state average.
Number of college students significantly below state average.
Percentage of population with a bachelor's degree or higher significantly below state average.
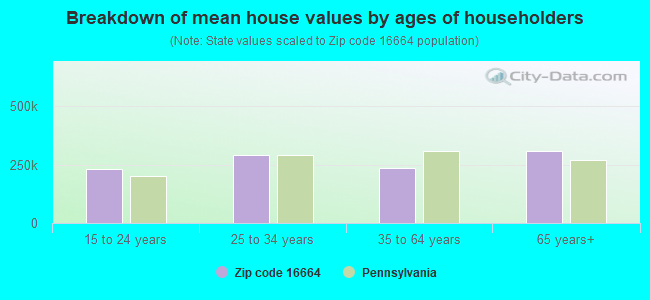
Estimated median house/condo value in 2022: $185,916
16664:
$185,916
Pennsylvania:
$245,500
According to our research of Pennsylvania and other state lists, there was 1 registered sex offender living in 16664 zip code as of May 20, 2024. The ratio of all residents to sex offenders in zip code 16664 is 1,984 to 1. The ratio of registered sex offenders to all residents in this zip code is much lower than the state average.
Median resident age:
This zip code:
35.4 years
Pennsylvania median age:
40.9 years
Average household size:
This zip code:
3.1 people
Pennsylvania:
2.4 people
Averages for the 2020 tax year for zip code 16664, filed in 2021:
Average Adjusted Gross Income (AGI) in 2020: $56,665 (Individual Income Tax Returns)
Here:
$56,665
State:
$75,707
Salary/wage: $47,312 (reported on 77.3% of returns)
Here:
$47,312
State:
$62,806
(% of AGI for various income ranges: 1353.8% for AGIs below $25k, 3952.5% for AGIs $25k-50k, 5708.2% for AGIs $50k-75k, 9100.0% for AGIs $75k-100k, 16341.4% for AGIs $100k-200k)
Taxable interest for individuals: $1,032 (reported on 28.4% of returns)
This zip code:
$1,032
Pennsylvania:
$1,633
(% of AGI for various income ranges: 49.2% for AGIs below $25k, 21.2% for AGIs $25k-50k, 40.9% for AGIs $50k-75k, 70.0% for AGIs $75k-100k, 94.3% for AGIs $100k-200k)
Ordinary dividends: $1,015 (reported on 14.8% of returns)
Here:
$1,015
State:
$7,382
(% of AGI for various income ranges: 20.8% for AGIs below $25k, 8.8% for AGIs $25k-50k, 28.2% for AGIs $50k-75k, 20.0% for AGIs $75k-100k, 65.7% for AGIs $100k-200k)
Net capital gain/loss in AGI: +$7,886 (reported on 15.9% of returns)
Here:
+$7,886
State:
+$23,522
(% of AGI for various income ranges: 56.9% for AGIs below $25k, 143.8% for AGIs $25k-50k, 190.9% for AGIs $50k-75k, 247.1% for AGIs $75k-100k, 595.7% for AGIs $100k-200k)
Profit/loss from business: +$13,906 (reported on 20.5% of returns)
Here:
+$13,906
State:
+$16,274
(% of AGI for various income ranges: 266.9% for AGIs below $25k, 455.0% for AGIs $25k-50k, 231.8% for AGIs $50k-75k, 881.4% for AGIs $75k-100k, 794.3% for AGIs $100k-200k)
Taxable individual retirement arrangement distribution: $15,412 (reported on 9.1% of returns)
16664:
$15,412
Pennsylvania:
$18,583
(% of AGI for various income ranges: 142.3% for AGIs below $25k, 175.6% for AGIs $25k-50k, 1095.7% for AGIs $75k-100k)
Earned income credit: $2,280 (reported on 11.4% of returns)
Here:
$2,280
State:
$2,100
(% of AGI for various income ranges: 71.5% for AGIs below $25k, 84.4% for AGIs $25k-50k)
Percentage of individuals using paid preparers for their 2020 taxes: 96.6%
Here:
97%
State:
92%
(% for various income ranges: 92.0% for AGIs below $25k, 95.8% for AGIs $25k-50k, 100.0% for AGIs $50k-75k, 100.0% for AGIs $75k-100k, 100.0% for AGIs $100k-200k)
Averages for the 2012 tax year for zip code 16664, filed in 2013:
Average Adjusted Gross Income (AGI) in 2012: $47,972 (Individual Income Tax Returns)
Here:
$47,972
State:
$61,346
Salary/wage: $40,964 (reported on 77.9% of returns)
Here:
$40,964
State:
$51,902
(% of AGI for various income ranges: 59.3% for AGIs below $25k, 73.8% for AGIs $25k-50k, 69.6% for AGIs $50k-75k, 77.3% for AGIs $75k-100k, 53.5% for AGIs $100k-200k)
Taxable interest for individuals: $952 (reported on 36.0% of returns)
This zip code:
$952
Pennsylvania:
$1,588
(% of AGI for various income ranges: 2.4% for AGIs below $25k, 1.2% for AGIs $25k-50k, 0.5% for AGIs $50k-75k, 0.2% for AGIs $75k-100k, 0.4% for AGIs $100k-200k)
Ordinary dividends: $450 (reported on 16.3% of returns)
Here:
$450
State:
$5,827
(% of AGI for various income ranges: 0.2% for AGIs below $25k, 0.2% for AGIs $25k-50k, 0.1% for AGIs $50k-75k, 0.2% for AGIs $100k-200k)
Net capital gain/loss in AGI: +$10,960 (reported on 17.4% of returns)
Here:
+$10,960
State:
+$14,495
(% of AGI for various income ranges: 6.6% for AGIs below $25k, 2.1% for AGIs $25k-50k, 2.9% for AGIs $50k-75k, 2.6% for AGIs $75k-100k, 6.4% for AGIs $100k-200k)
Profit/loss from business: +$10,389 (reported on 20.9% of returns)
Here:
+$10,389
State:
+$16,268
(% of AGI for various income ranges: 18.2% for AGIs below $25k, 6.6% for AGIs $25k-50k, 2.8% for AGIs $50k-75k, 4.8% for AGIs $75k-100k)
Taxable individual retirement arrangement distribution: $8,857 (reported on 8.1% of returns)
16664:
$8,857
Pennsylvania:
$14,550
Total itemized deductions: $19,050 (20% of AGI, reported on 18.6% of returns)
Here:
$19,050
State:
$23,538
Here:
20.0% of AGI
State:
18.4% of AGI
(% of AGI for various income ranges: 4.8% for AGIs $25k-50k, 7.2% for AGIs $50k-75k, 8.0% for AGIs $75k-100k, 11.2% for AGIs $100k-200k)
Charity contributions: $4,325 (reported on 14.0% of returns)
Here:
$4,325
State:
$4,025
(% of AGI for various income ranges: 1.9% for AGIs $50k-75k, 0.9% for AGIs $75k-100k, 2.2% for AGIs $100k-200k)
Taxes paid: $5,394 (reported on 18.6% of returns)
16664:
$5,394
State:
$9,982
(% of AGI for various income ranges: 1.0% for AGIs $25k-50k, 1.5% for AGIs $50k-75k, 2.3% for AGIs $75k-100k, 3.9% for AGIs $100k-200k)
Earned income credit: $2,250 (reported on 11.6% of returns)
Here:
$2,250
State:
$2,106
(% of AGI for various income ranges: 4.2% for AGIs below $25k, 0.9% for AGIs $25k-50k)
Percentage of individuals using paid preparers for their 2012 taxes: 69.8%
Here:
70%
State:
53%
(% for various income ranges: 65.6% for AGIs below $25k, 66.7% for AGIs $25k-50k, 75.0% for AGIs $50k-75k, 70.0% for AGIs $75k-100k, 85.7% for AGIs $100k-200k)
Averages for the 2004 tax year for zip code 16664, filed in 2005:
Average Adjusted Gross Income (AGI) in 2004: $34,239 (Individual Income Tax Returns)
Here:
$34,239
State:
$48,049
Salary/wage: $33,015 (reported on 79.6% of returns)
Here:
$33,015
State:
$42,646
(% of AGI for various income ranges: 92.7% for AGIs below $10k, 64.8% for AGIs $10k-25k, 78.2% for AGIs $25k-50k, 80.0% for AGIs $50k-75k, 77.1% for AGIs $75k-100k, 72.5% for AGIs over 100k)
Taxable interest for individuals: $955 (reported on 42.9% of returns)
This zip code:
$955
Pennsylvania:
$1,657
(% of AGI for various income ranges: 6.0% for AGIs below $10k, 3.1% for AGIs $10k-25k, 1.3% for AGIs $25k-50k, 0.4% for AGIs $50k-75k, 0.7% for AGIs $75k-100k, 0.3% for AGIs over 100k)
Taxable dividends: $288 (reported on 20.6% of returns)
Here:
$288
State:
$3,566
(% of AGI for various income ranges: 1.5% for AGIs below $10k, 0.3% for AGIs $10k-25k, 0.1% for AGIs $25k-50k, 0.2% for AGIs $50k-75k, 0.1% for AGIs $75k-100k, 0.1% for AGIs over 100k)
Net capital gain/loss: +$3,979 (reported on 17.4% of returns)
Here:
+$3,979
State:
+$9,716
(% of AGI for various income ranges: 3.2% for AGIs below $10k, 4.0% for AGIs $10k-25k, 2.4% for AGIs $25k-50k, 0.9% for AGIs $50k-75k, 1.4% for AGIs $75k-100k, 2.3% for AGIs over 100k)
Profit/loss from business: +$6,121 (reported on 20.0% of returns)
Here:
+$6,121
State:
+$14,267
(% of AGI for various income ranges: 17.9% for AGIs below $10k, 8.2% for AGIs $10k-25k, 3.6% for AGIs $25k-50k, 3.4% for AGIs $50k-75k)
Profit/loss from farming: +$5,382 (reported on 10.8% of returns)
Here:
+$5,382
State:
+$274
(% of AGI for various income ranges: -0.2% for AGIs below $10k, 4.4% for AGIs $10k-25k, 1.5% for AGIs $25k-50k, 2.3% for AGIs $50k-75k)
IRA payment deduction: $2,214 (reported on 3.4% of returns)
16664:
$2,214
Pennsylvania:
$2,903
Total itemized deductions: $14,132 (22% of AGI, reported on 18.3% of returns)
Here:
$14,132
State:
$18,804
Here:
22.1% of AGI
State:
19.5% of AGI
(% of AGI for various income ranges: 8.2% for AGIs $25k-50k, 8.4% for AGIs $50k-75k, 10.3% for AGIs $75k-100k, 10.2% for AGIs over 100k)
Charity contributions deductions: $3,194 (5% of AGI, reported on 15.0% of returns)
Here:
$3,194
State:
$3,337
Here:
4.8% of AGI
State:
3.3% of AGI
(% of AGI for various income ranges: 1.2% for AGIs $25k-50k, 1.6% for AGIs $50k-75k, 2.4% for AGIs $75k-100k, 2.1% for AGIs over 100k)
Total tax: $3,557 (reported on 72.9% of returns)
16664:
$3,557
State:
$8,008
(% of AGI for various income ranges: 4.5% for AGIs below $10k, 4.7% for AGIs $10k-25k, 6.0% for AGIs $25k-50k, 7.7% for AGIs $50k-75k, 9.0% for AGIs $75k-100k, 15.0% for AGIs over 100k)
Earned income credit: $1,470 (reported on 12.1% of returns)
Here:
$1,470
State:
$1,643
Percentage of individuals using paid preparers for their 2004 taxes: 65.2%
Here:
65%
State:
56%
(% for various income ranges: 57.6% for AGIs below $10k, 67.8% for AGIs $10k-25k, 68.1% for AGIs $25k-50k, 65.0% for AGIs $50k-75k, 63.6% for AGIs $75k-100k, 70.0% for AGIs over 100k)
Likely homosexual households (counted as self-reported same-sex unmarried-partner households)
Lesbian couples: 0.0% of all households
Gay men: 0.3% of all households
Household received Food Stamps/SNAP in the past 12 months: 76 Household did not receive Food Stamps/SNAP in the past 12 months: 624
Women who had a birth in the past 12 months: 20 (19 now married, 1 unmarried) Women who did not have a birth in the past 12 months: 415 (224 now married, 189 unmarried)
Housing units in zip code 16664 with a mortgage: 367 (60 second mortgage, 1 home equity loan, 45 both second mortgage and home equity loan) Houses without a mortgage: 22
Median monthly owner costs for units with a mortgage: $1,235 Median monthly owner costs for units without a mortgage: $420
Residents with income below the poverty level in 2022:
This zip code:
14.2%
Whole state:
11.8%
Residents with income below 50% of the poverty level in 2022:
This zip code:
10.4%
Whole state:
6.1%
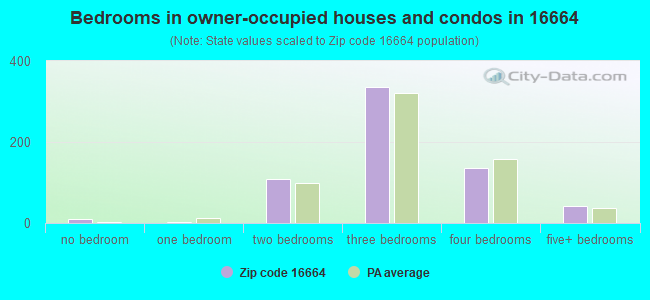
Median number of rooms in houses and condos:
Here:
7.0
State:
6.8
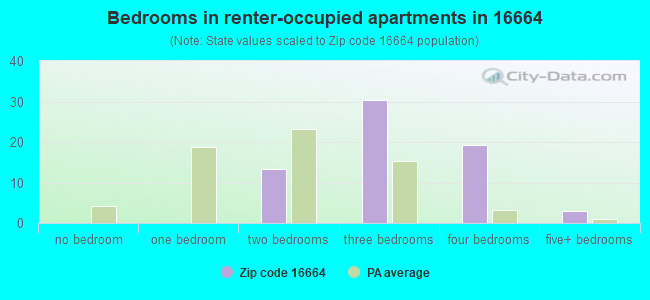
Median number of rooms in apartments:
Here:
6.2
State:
4.3
Notable locations in this zip code not listed on our city pages
Churches in zip code 16664 include: Holsinger Church (A), Barley Church (B), Koontz Church (C), Saint Johns Church (D). Display/hide their locations on the map
Size of family households: 226 2-persons, 84 3-persons, 111 4-persons, 46 5-persons, 28 6-persons, 29 7-or-more-persons
Size of nonfamily households: 124 1-person, 46 2-persons, 2 3-persons
505 married couples with children.
68 single-parent households (30 men, 38 women).
86.0% of residents of 16664 zip code speak English at home.
0.2% of residents speak Spanish at home (100% very well).
13.1% of residents speak other Indo-European language at home (50% very well, 46% well, 3% not well).
0.4% of residents speak Asian or Pacific Island language at home (100% not well).
Foreign born population: 9 (0.4%) (0.0% of them are naturalized citizens)
:
0.4%
Whole state:
7.5%
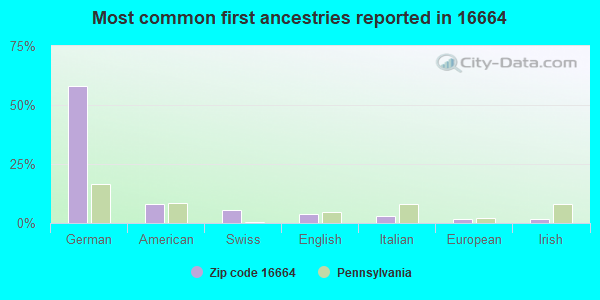
58%German
8%American
6%Swiss
4%English
3%Italian
2%European
2%Irish
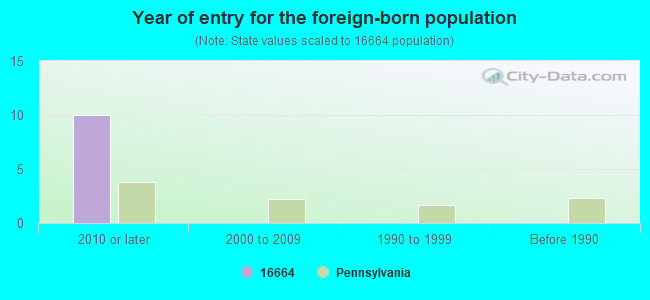
Year of entry for the foreign-born population
102010 or later
02000 to 2009
01990 to 1999
0Before 1990
Facilities with environmental interests located in this zip code:
BRATTON RES (275 GUYER CORNER RD in NEW ENTERPRISE, PA)
STATE MASTER (Pennsylvania database) - PCS-668755, National Pollutant Discharge Elimination System Permit National Pollutant Discharge Elimination System NON-MAJOR (Tracking pollutant discharge elimination systems) - permit Business SIC classification: PRIVATE HOUSEHOLDS Alternative names: BRATTON, WILLIAM, WILLIAM BRATTON
Housing units lacking complete plumbing facilities: 1.2% Housing units lacking complete kitchen facilities: 0.6%
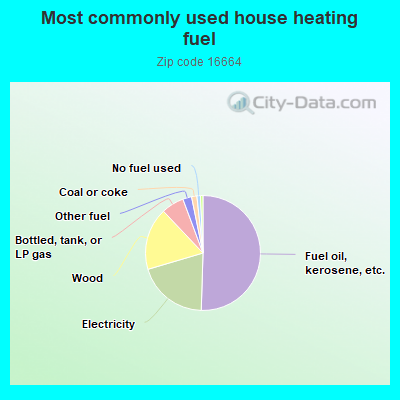
50.7%Fuel oil, kerosene, etc.
20.0%Electricity
17.6%Wood
6.4%Bottled, tank, or LP gas
2.5%Other fuel
1.5%Coal or coke
1.0%No fuel used
0.7%Utility gas
Population in 1990: 1,898. Population change in the 1990s: +14 (+0.7%).
Place of birth for U.S.-born residents:
This state: 1,948
Northeast: 14
Midwest: 30
South: 153
West: 16
72% of the 16664 zip code residents lived in the same house 5 years ago. Out of people who lived in different houses, 59% lived in this county. Out of people who lived in different counties, 50% lived in Pennsylvania.
97% of the 16664 zip code residents lived in the same house 1 year ago. Out of people who lived in different houses, 98% moved from this county. Out of people who lived in different houses, 7% moved from different state.
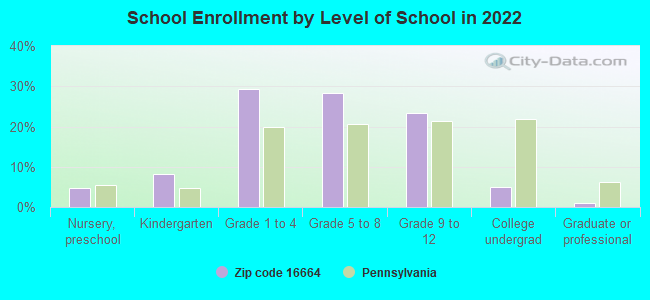
Private vs. public school enrollment:
Students in private schools in grades 1 to 8 (elementary and middle school): 145
Here:
49.1%
Pennsylvania:
15.7%
Students in private schools in grades 9 to 12 (high school): 8
Here:
7.4%
Pennsylvania:
13.4%
Students in private undergraduate colleges: 5
Here:
22.8%
Pennsylvania:
39.8%
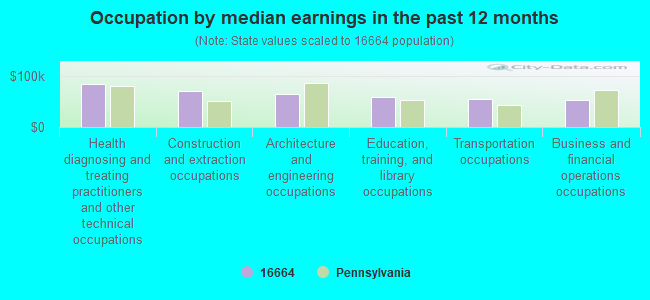
Occupation by median earnings in the past 12 months ($)
83,988Health diagnosing and treating practitioners and other technical occupations
70,863Construction and extraction occupations
64,219Architecture and engineering occupations
57,537Education, training, and library occupations
54,007Transportation occupations
52,137Business and financial operations occupations
Companies with federal contracts located in this zip code:
NEW ENTERPRISE STONE & LIME CO (3912 BRUMBAUGH RD in NEW ENTERPRISE, PA) : $1,655,123 in 17 contractsfrom 2002 to 2005
Contracts for Maintenance, Repair or Alteration of Real Property -- Highways, Roads, Streets, Bridges, and Railways (includes resurfacing), Maintenance, Repair or Alteration of Real Property -- Office Buildings, Maintenance, Repair or Alteration of Real Property -- Other Non-Building Facilities, Mineral Construction Materials, Bulk by U.S. Army Corps of Engineers - civil program financing only, Army, Forest Service Signed by year:2000: $0; 2001: $0; 2002: $947,217; 2003: $496,317; 2004: $123,363; 2005: $88,226; 2006: $0.
Biggest contracts:
$447,203 with U.S. Army Corps of Engineers - civil program financing only for Maintenance, Repair or Alteration of Real Property -- Highways, Roads, Streets, Bridges, and Railways (includes resurfacing). Signed on 2002-09-27. Completion date: 2002-08-15.
$267,000 with U.S. Army Corps of Engineers - civil program financing only for Maintenance, Repair or Alteration of Real Property -- Office Buildings. Signed on 2002-09-12. Completion date: 2002-09-09.
$250,216 with U.S. Army Corps of Engineers - civil program financing only for Maintenance, Repair or Alteration of Real Property -- Highways, Roads, Streets, Bridges, and Railways (includes resurfacing). Signed on 2003-05-29. Completion date: 2002-08-15.
$246,101, same as above.Signed on 2003-08-08. Completion date: 2003-09-06.
CLAYCOMB EXCAVATING (1086 LAFAYETTE RD in NEW ENTERPRISE, PA; small business) : $93,596 in 7 contractsfrom 2004 to 2006
Contracts for Forest Tree Planting Services, Seedling Production/Transplanting Services, Other Natural Resources and Conservation Services by Army, U.S. Army Corps of Engineers - civil program financing only Signed by year:2000: $0; 2001: $0; 2002: $0; 2003: $0; 2004: $79,348; 2005: $0; 2006: $14,248.
Biggest contracts:
$23,974 with Army for Forest Tree Planting Services. Signed on 2004-04-08. Completion date: 2004-05-31.
$23,974 with U.S. Army Corps of Engineers - civil program financing only for Forest Tree Planting Services. Signed on 2004-04-08. Completion date: 2004-05-31.
$14,248 with Army for Seedling Production/Transplanting Services. Signed on 2006-02-17. Completion date: 2006-05-31.
$9,390 with Army for Forest Tree Planting Services. Signed on 2004-05-05. Completion date: 2004-05-31.
Top industries in this zip code by the number of employees in 2005:
Construction: Highway, Street, and Bridge Construction (250-499 employees: 1 establishment, 20-49 employees: 1 establishment)
Management of Companies and Enterprises: Corporate, Subsidiary, and Regional Managing Offices (100-249: 1)
Utilities: Electric Power Distribution (10-19: 1)
Construction: Water and Sewer Line and Related Structures Construction (10-19: 1)
Construction: Site Preparation Contractors (5-9: 1, 1-4: 1)
Wholesale Trade: Other Farm Product Raw Material Merchant Wholesalers (5-9: 1)
Construction: Plumbing, Heating, and Air-Conditioning Contractors (5-9: 1)
People in group quarters in 2000:
8 people in other noninstitutional group quarters
Most common first names in zip code 16664 among deceased individuals
Name
Count
Lived (average)
John
13
71.6 years
Mary
12
80.4 years
James
10
71.7 years
William
9
74.7 years
Charles
7
73.3 years
Harry
6
72.9 years
Carl
6
77.5 years
Helen
6
76.5 years
Ada
5
78.4 years
Ruth
5
84.8 years
Most common last names in zip code 16664 among deceased individuals


 Nearest zip codes: 16659, 16695, 16682, 16655, 16667, 16670.