Estimated zip code population in 2022: 2,735 Zip code population in 2010: 2,997 Zip code population in 2000: 3,187
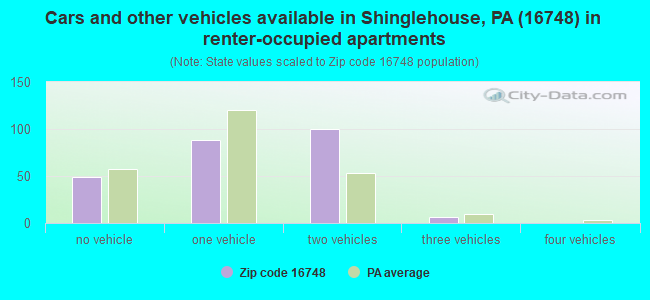
Houses and condos: 1,548 Renter-occupied apartments: 243
% of renters here:
23%
State:
31%
March 2022 cost of living index in zip code 16748: 90.3 (less than average, U.S. average is 100)
Land area: 103.2 sq. mi. Water area: 0.2 sq. mi.
Population density: 26 people per square mile
(very low).
OSM Map
General Map
Google Map
MSN Map
OSM Map
General Map
Google Map
MSN Map
OSM Map
General Map
Google Map
MSN Map
OSM Map
General Map
Google Map
MSN Map
Please wait while loading the map...
Real estate property taxes paid for housing units in 2022:
This zip code:
1.4% ($1,438)
Pennsylvania:
1.3% ($3,094)
Median real estate property taxes paid for housing units with mortgages in 2022: $1,441 (1.2%) Median real estate property taxes paid for housing units with no mortgage in 2022: $1,435 (1.5%)
Business Search- 14 Million verified businesses
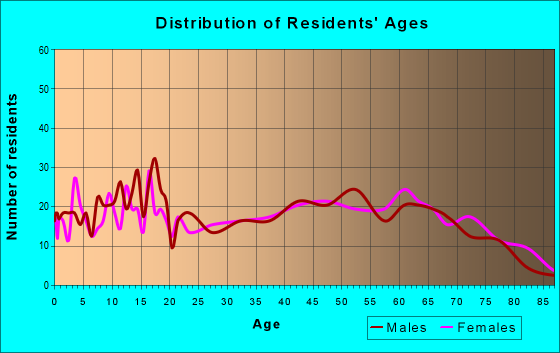
Males: 1,386
(50.7%)
Females: 1,348
(49.3%)
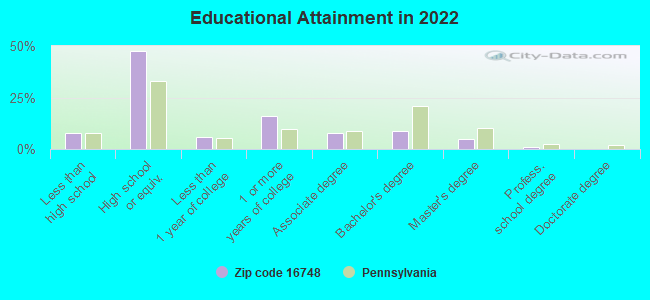
For population 25 years and over in 16748:
High school or higher: 91.2%
Bachelor's degree or higher: 14.8%
Graduate or professional degree: 5.9%
Unemployed: 5.8%
Mean travel time to work (commute): 25.3 minutes
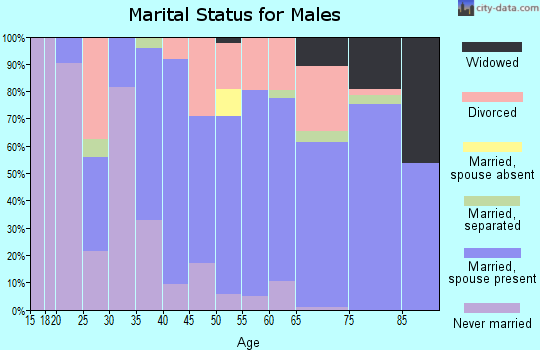
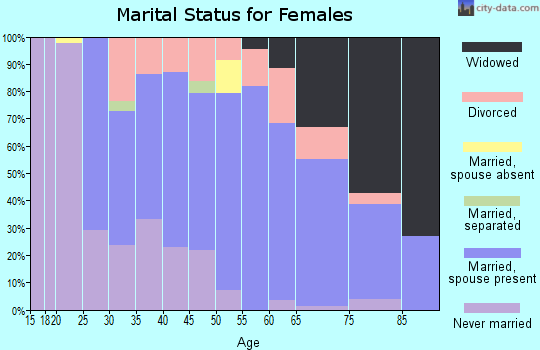
For population 15 years and over in 16748:
Never married: 24.0%
Now married: 56.4%
Separated: 0.7%
Widowed: 9.7%
Divorced: 9.1%
Zip code 16748 compared to state average:
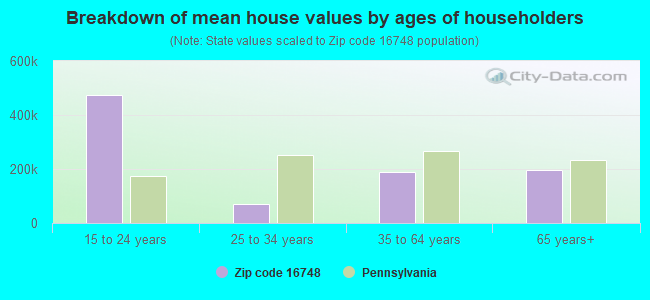
Median house value significantly below state average.
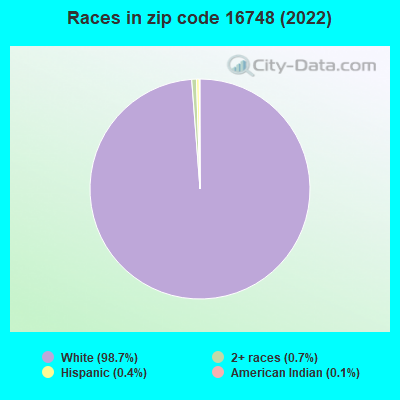
Black race population percentage significantly below state average.
Hispanic race population percentage significantly below state average.
Median age above state average.
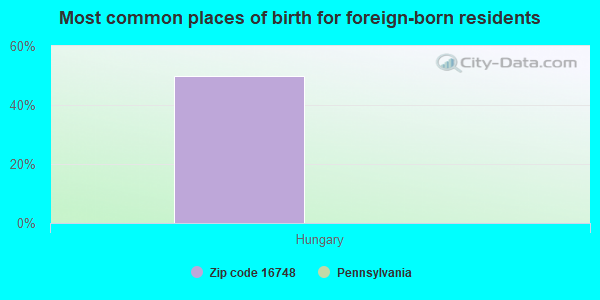
Foreign-born population percentage significantly below state average.
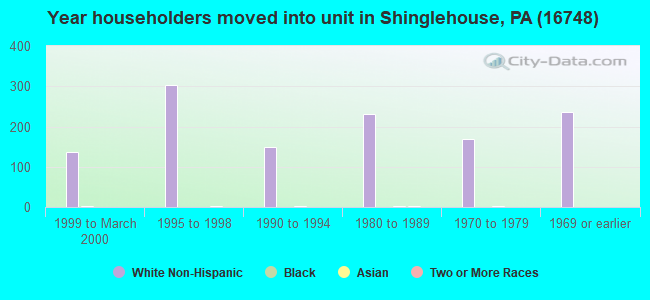
Length of stay since moving in significantly above state average.
Number of college students below state average.
Percentage of population with a bachelor's degree or higher significantly below state average.
Averages for the 2020 tax year for zip code 16748, filed in 2021:
Average Adjusted Gross Income (AGI) in 2020: $50,413 (Individual Income Tax Returns)
Here:
$50,413
State:
$75,707
Salary/wage: $45,103 (reported on 77.2% of returns)
Here:
$45,103
State:
$62,806
(% of AGI for various income ranges: 940.3% for AGIs below $25k, 3281.9% for AGIs $25k-50k, 5880.0% for AGIs $50k-75k, 8995.6% for AGIs $75k-100k, 18033.8% for AGIs $100k-200k)
Taxable interest for individuals: $624 (reported on 26.0% of returns)
This zip code:
$624
Pennsylvania:
$1,633
(% of AGI for various income ranges: 7.0% for AGIs below $25k, 23.0% for AGIs $25k-50k, 24.7% for AGIs $50k-75k, 18.9% for AGIs $75k-100k, 80.0% for AGIs $100k-200k)
Ordinary dividends: $2,962 (reported on 18.9% of returns)
Here:
$2,962
State:
$7,382
(% of AGI for various income ranges: 27.7% for AGIs below $25k, 42.6% for AGIs $25k-50k, 72.4% for AGIs $50k-75k, 83.3% for AGIs $75k-100k, 393.8% for AGIs $100k-200k)
Net capital gain/loss in AGI: +$7,859 (reported on 13.4% of returns)
Here:
+$7,859
State:
+$23,522
(% of AGI for various income ranges: 14.3% for AGIs below $25k, 62.2% for AGIs $25k-50k, 17.1% for AGIs $50k-75k, 160.0% for AGIs $75k-100k, 1190.0% for AGIs $100k-200k)
Profit/loss from business: +$9,918 (reported on 13.4% of returns)
Here:
+$9,918
State:
+$16,274
(% of AGI for various income ranges: 98.7% for AGIs below $25k, 145.6% for AGIs $25k-50k, 127.1% for AGIs $50k-75k, 395.6% for AGIs $75k-100k, 531.2% for AGIs $100k-200k)
Taxable individual retirement arrangement distribution: $12,167 (reported on 11.8% of returns)
16748:
$12,167
Pennsylvania:
$18,583
(% of AGI for various income ranges: 104.0% for AGIs below $25k, 106.3% for AGIs $25k-50k, 285.9% for AGIs $50k-75k, 822.2% for AGIs $75k-100k)
Earned income credit: $1,971 (reported on 16.5% of returns)
Here:
$1,971
State:
$2,100
(% of AGI for various income ranges: 67.3% for AGIs below $25k, 78.5% for AGIs $25k-50k)
Percentage of individuals using paid preparers for their 2020 taxes: 95.3%
Here:
95%
State:
92%
(% for various income ranges: 95.5% for AGIs below $25k, 94.1% for AGIs $25k-50k, 95.5% for AGIs $50k-75k, 92.3% for AGIs $75k-100k, 100.0% for AGIs $100k-200k)
Averages for the 2012 tax year for zip code 16748, filed in 2013:
Average Adjusted Gross Income (AGI) in 2012: $56,445 (Individual Income Tax Returns)
Here:
$56,445
State:
$61,346
Salary/wage: $38,757 (reported on 79.5% of returns)
Here:
$38,757
State:
$51,902
(% of AGI for various income ranges: 58.5% for AGIs below $25k, 78.9% for AGIs $25k-50k, 81.6% for AGIs $50k-75k, 84.5% for AGIs $75k-100k, 27.6% for AGIs $100k-200k)
Taxable interest for individuals: $1,365 (reported on 32.6% of returns)
This zip code:
$1,365
Pennsylvania:
$1,588
(% of AGI for various income ranges: 2.0% for AGIs below $25k, 0.4% for AGIs $25k-50k, 0.3% for AGIs $50k-75k, 1.0% for AGIs $100k-200k)
Ordinary dividends: $25,012 (reported on 18.2% of returns)
Here:
$25,012
State:
$5,827
(% of AGI for various income ranges: 2.4% for AGIs below $25k, 0.7% for AGIs $25k-50k, 0.3% for AGIs $50k-75k, 0.2% for AGIs $75k-100k, 16.7% for AGIs $100k-200k)
Net capital gain/loss in AGI: +$14,762 (reported on 12.1% of returns)
Here:
+$14,762
State:
+$14,495
(% of AGI for various income ranges: 0.2% for AGIs $50k-75k, 6.9% for AGIs $100k-200k)
Profit/loss from business: +$9,858 (reported on 14.4% of returns)
Here:
+$9,858
State:
+$16,268
(% of AGI for various income ranges: 7.4% for AGIs below $25k, 2.8% for AGIs $25k-50k, 3.1% for AGIs $50k-75k, 1.8% for AGIs $100k-200k)
Taxable individual retirement arrangement distribution: $7,560 (reported on 11.4% of returns)
16748:
$7,560
Pennsylvania:
$14,550
(% of AGI for various income ranges: 5.1% for AGIs below $25k, 2.2% for AGIs $25k-50k, 1.9% for AGIs $50k-75k, 3.2% for AGIs $75k-100k)
Total itemized deductions: $24,106 (11% of AGI, reported on 12.1% of returns)
Here:
$24,106
State:
$23,538
Here:
10.9% of AGI
State:
18.4% of AGI
(% of AGI for various income ranges: 4.3% for AGIs below $25k, 5.0% for AGIs $25k-50k, 3.7% for AGIs $50k-75k, 5.7% for AGIs $75k-100k, 5.8% for AGIs $100k-200k)
Charity contributions: $6,391 (reported on 8.3% of returns)
Here:
$6,391
State:
$4,025
(% of AGI for various income ranges: 1.0% for AGIs below $25k, 1.6% for AGIs $50k-75k, 1.3% for AGIs $100k-200k)
Taxes paid: $9,900 (reported on 12.1% of returns)
16748:
$9,900
State:
$9,982
(% of AGI for various income ranges: 1.4% for AGIs $25k-50k, 1.3% for AGIs $50k-75k, 2.1% for AGIs $75k-100k, 3.1% for AGIs $100k-200k)
Earned income credit: $2,230 (reported on 17.4% of returns)
Here:
$2,230
State:
$2,106
(% of AGI for various income ranges: 5.1% for AGIs below $25k, 1.3% for AGIs $25k-50k)
Percentage of individuals using paid preparers for their 2012 taxes: 68.2%
Here:
68%
State:
53%
(% for various income ranges: 66.1% for AGIs below $25k, 66.7% for AGIs $25k-50k, 70.0% for AGIs $50k-75k, 72.7% for AGIs $75k-100k, 77.8% for AGIs $100k-200k)
Averages for the 2004 tax year for zip code 16748, filed in 2005:
Average Adjusted Gross Income (AGI) in 2004: $31,944 (Individual Income Tax Returns)
Here:
$31,944
State:
$48,049
Salary/wage: $29,662 (reported on 83.4% of returns)
Here:
$29,662
State:
$42,646
(% of AGI for various income ranges: 73.5% for AGIs below $10k, 69.1% for AGIs $10k-25k, 81.7% for AGIs $25k-50k, 85.6% for AGIs $50k-75k, 66.2% for AGIs $75k-100k, 69.3% for AGIs over 100k)
Taxable interest for individuals: $676 (reported on 46.1% of returns)
This zip code:
$676
Pennsylvania:
$1,657
(% of AGI for various income ranges: 3.4% for AGIs below $10k, 2.0% for AGIs $10k-25k, 0.8% for AGIs $25k-50k, 0.5% for AGIs $50k-75k, 0.8% for AGIs $75k-100k, 0.6% for AGIs over 100k)
Taxable dividends: $1,551 (reported on 20.4% of returns)
Here:
$1,551
State:
$3,566
(% of AGI for various income ranges: 1.1% for AGIs below $10k, 1.4% for AGIs $10k-25k, 0.8% for AGIs $25k-50k, 0.5% for AGIs $50k-75k, 0.8% for AGIs $75k-100k, 2.5% for AGIs over 100k)
Net capital gain/loss: +$6,926 (reported on 16.2% of returns)
Here:
+$6,926
State:
+$9,716
(% of AGI for various income ranges: -1.6% for AGIs below $10k, 2.0% for AGIs $10k-25k, 2.3% for AGIs $25k-50k, 1.4% for AGIs $50k-75k, 6.1% for AGIs $75k-100k, 14.1% for AGIs over 100k)
Profit/loss from business: +$4,982 (reported on 16.7% of returns)
Here:
+$4,982
State:
+$14,267
(% of AGI for various income ranges: 6.5% for AGIs below $10k, 5.9% for AGIs $10k-25k, 3.4% for AGIs $25k-50k, 1.8% for AGIs $50k-75k, -1.2% for AGIs $75k-100k)
IRA payment deduction: $2,759 (reported on 2.2% of returns)
16748:
$2,759
Pennsylvania:
$2,903
Total itemized deductions: $13,601 (23% of AGI, reported on 13.7% of returns)
Here:
$13,601
State:
$18,804
Here:
23.0% of AGI
State:
19.5% of AGI
(% of AGI for various income ranges: 3.3% for AGIs $10k-25k, 5.1% for AGIs $25k-50k, 5.8% for AGIs $50k-75k, 7.0% for AGIs $75k-100k, 13.2% for AGIs over 100k)
Charity contributions deductions: $3,985 (6% of AGI, reported on 10.2% of returns)
Here:
$3,985
State:
$3,337
Here:
6.3% of AGI
State:
3.3% of AGI
(% of AGI for various income ranges: 0.5% for AGIs $10k-25k, 0.9% for AGIs $25k-50k, 0.8% for AGIs $50k-75k, 1.3% for AGIs $75k-100k, 5.4% for AGIs over 100k)
Total tax: $3,204 (reported on 73.5% of returns)
16748:
$3,204
State:
$8,008
(% of AGI for various income ranges: 2.3% for AGIs below $10k, 4.2% for AGIs $10k-25k, 5.6% for AGIs $25k-50k, 8.1% for AGIs $50k-75k, 10.8% for AGIs $75k-100k, 14.1% for AGIs over 100k)
Earned income credit: $1,456 (reported on 17.8% of returns)
Here:
$1,456
State:
$1,643
Percentage of individuals using paid preparers for their 2004 taxes: 68.5%
Here:
69%
State:
56%
(% for various income ranges: 63.4% for AGIs below $10k, 65.6% for AGIs $10k-25k, 70.9% for AGIs $25k-50k, 77.0% for AGIs $50k-75k, 68.3% for AGIs $75k-100k, 69.0% for AGIs over 100k)
Likely homosexual households (counted as self-reported same-sex unmarried-partner households)
Lesbian couples: 0.0% of all households
Gay men: 0.2% of all households
Household received Food Stamps/SNAP in the past 12 months: 148 Household did not receive Food Stamps/SNAP in the past 12 months: 924
Women who had a birth in the past 12 months: 25 (17 now married, 7 unmarried) Women who did not have a birth in the past 12 months: 464 (251 now married, 210 unmarried)
Housing units in zip code 16748 with a mortgage: 287 (21 second mortgage, 21 both second mortgage and home equity loan) Median monthly owner costs for units with a mortgage: $991 Median monthly owner costs for units without a mortgage: $462
Residents with income below the poverty level in 2022:
This zip code:
11.4%
Whole state:
11.8%
Residents with income below 50% of the poverty level in 2022:
This zip code:
7.1%
Whole state:
6.1%
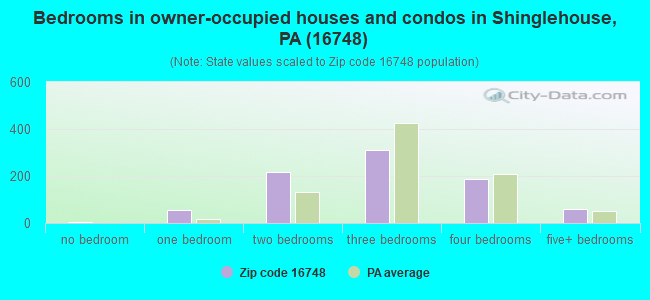
Median number of rooms in houses and condos:
Here:
6.5
State:
6.8
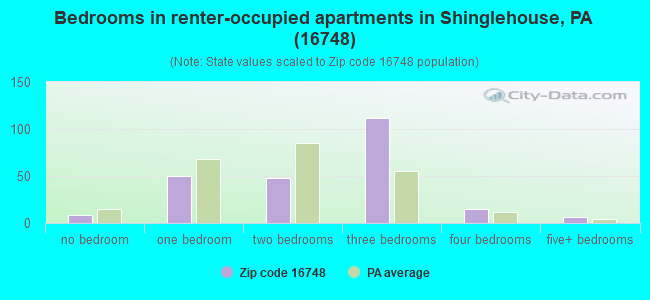
Median number of rooms in apartments:
Here:
5.8
State:
4.3
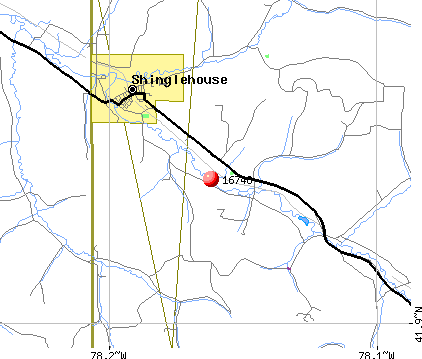
Notable locations in this zip code not listed on our city pages
Streams, rivers, and creeks: Janders Run (A), Plank Creek (B), Topeka Creek (C), Taylor Brook (D), Elevenmile Creek (E), Cow Run (F), Shaytown Branch (G), Clara Creek (H), Chapman Brook (I). Display/hide their locations on the map
Size of family households: 416 2-persons, 136 3-persons, 87 4-persons, 56 5-persons, 18 6-persons, 13 7-or-more-persons
Size of nonfamily households: 302 1-person, 38 2-persons, 3 3-persons
436 married couples with children.
77 single-parent households (39 men, 38 women).
98.1% of residents of 16748 zip code speak English at home.
0.7% of residents speak Spanish at home (84% not well, 16% not at all).
0.4% of residents speak other Indo-European language at home (100% very well).
0.5% of residents speak other language at home (100% not well).
Foreign born population: 2 (0.1%) (100.0% of them are naturalized citizens)
This zip code:
0.1%
Whole state:
7.5%
50%Hungary
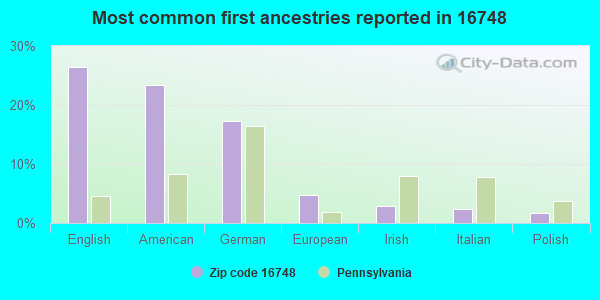
26%English
23%American
17%German
5%European
3%Irish
2%Italian
2%Polish
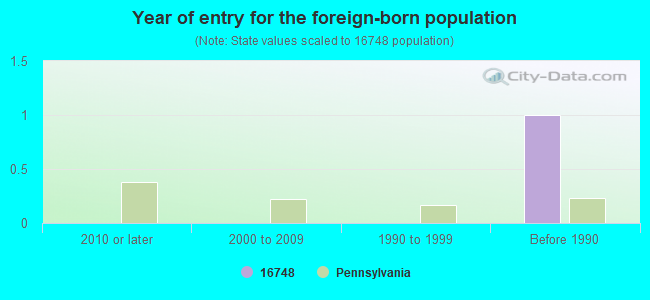
Year of entry for the foreign-born population
02010 or later
02000 to 2009
01990 to 1999
1Before 1990
Facilities with environmental interests located in this zip code:
BAKER PALLET INDUS (ACADEMY & MILL in SHINGLEHOUSE, PA)
AIR MINOR (AIRS/AFS) Business SIC classification: WOOD PRESERVING
Housing units lacking complete plumbing facilities: 10.7% Housing units lacking complete kitchen facilities: 6.6%
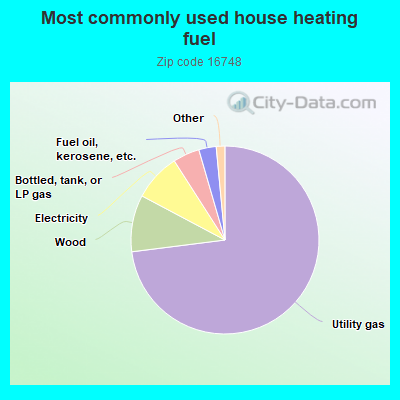
73.3%Utility gas
9.8%Wood
8.2%Electricity
4.6%Bottled, tank, or LP gas
3.0%Fuel oil, kerosene, etc.
0.9%Coal or coke
0.7%Other fuel
Population in 1990: 3,390.
Place of birth for U.S.-born residents:
This state: 1,227
Northeast: 1,315
Midwest: 83
South: 86
West: 48
68% of the 16748 zip code residents lived in the same house 5 years ago. Out of people who lived in different houses, 47% lived in this county. Out of people who lived in different counties, 50% lived in Pennsylvania.
96% of the 16748 zip code residents lived in the same house 1 year ago. Out of people who lived in different houses, 42% moved from this county. Out of people who lived in different houses, 66% moved from different state.
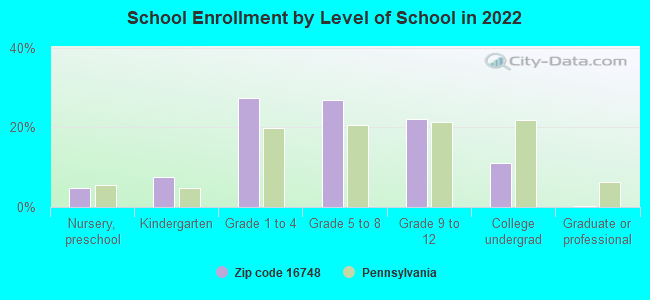
Private vs. public school enrollment:
Students in private schools in grades 1 to 8 (elementary and middle school): 48
Here:
20.7%
Pennsylvania:
15.7%
Students in private schools in grades 9 to 12 (high school): 12
Here:
13.1%
Pennsylvania:
13.4%
Students in private undergraduate colleges: 2
Here:
6.2%
Pennsylvania:
39.8%
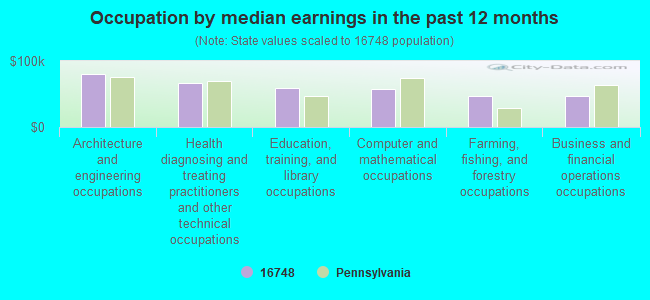
Occupation by median earnings in the past 12 months ($)
80,427Architecture and engineering occupations
66,985Health diagnosing and treating practitioners and other technical occupations
58,985Education, training, and library occupations
57,969Computer and mathematical occupations
46,712Farming, fishing, and forestry occupations
46,623Business and financial operations occupations
Top industries in this zip code by the number of employees in 2005:
Construction: All Other Specialty Trade Contractors (20-49 employees: 1 establishment, 1-4 employees: 1 establishment)
Mining: Support Activities for Oil and Gas Operations (20-49: 1)
Management of Companies and Enterprises: Corporate, Subsidiary, and Regional Managing Offices (10-19: 1)
Other Services (except Public Administration): Automotive Body, Paint, and Interior Repair and Maintenance (10-19: 1)
Fatal accident statistics in 2012:
Fatal accident count: 1
Vehicles involved in fatal accidents: 1
Fatal accidents caused by drunken drivers: 0
Fatalities: 1
Persons involved in fatal accidents: 1
Pedestrians involved in fatal accidents: 1
Most common first names in zip code 16748 among deceased individuals
Name
Count
Lived (average)
Robert
22
68.9 years
John
19
75.0 years
Mary
16
71.5 years
George
15
76.5 years
William
14
67.6 years
Margaret
14
78.4 years
James
14
75.6 years
Donald
11
73.3 years
Charles
11
75.2 years
Helen
11
82.5 years
Most common last names in zip code 16748 among deceased individuals
Last name
Count
Lived (average)
Smith
17
78.3 years
Taylor
13
67.7 years
Kemp
10
80.3 years
Howard
9
69.8 years
Washburn
9
76.5 years
Green
9
72.9 years
Perkins
9
80.1 years
Austin
8
74.4 years
Babcock
8
77.5 years
Kellogg
8
67.8 years
Discuss Shinglehouse, Pennsylvania (PA) on our hugely popular Pennsylvania forum.
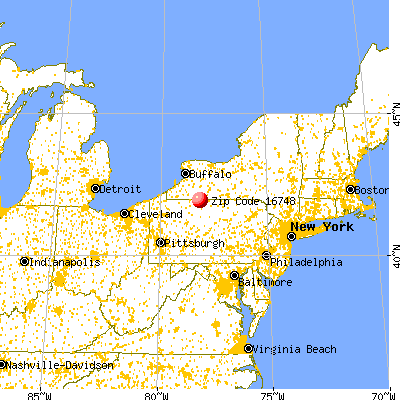


 Nearest zip codes: 14754, 14708, 14715, 14721, 14774, 14707.