Estimated zip code population in 2022: 2,411 Zip code population in 2010: 2,347 Zip code population in 2000: 2,513
Houses and condos: 1,108 Renter-occupied apartments: 143
% of renters here:
16%
State:
31%
March 2022 cost of living index in zip code 16914: 93.0 (less than average, U.S. average is 100)
Land area: 75.6 sq. mi. Water area: 0.4 sq. mi.
Population density: 32 people per square mile
(very low).
OSM Map
General Map
Google Map
MSN Map
OSM Map
General Map
Google Map
MSN Map
OSM Map
General Map
Google Map
MSN Map
OSM Map
General Map
Google Map
MSN Map
Please wait while loading the map...
Real estate property taxes paid for housing units in 2022:
This zip code:
0.8% ($1,854)
Pennsylvania:
1.3% ($3,094)
Median real estate property taxes paid for housing units with mortgages in 2022: $2,194 (0.8%) Median real estate property taxes paid for housing units with no mortgage in 2022: $1,710 (0.7%)
Business Search- 14 Million verified businesses
Males: 1,230
(51.0%)
Females: 1,180
(49.0%)
For population 25 years and over in 16914:
High school or higher: 94.6%
Bachelor's degree or higher: 17.3%
Graduate or professional degree: 5.2%
Unemployed: 3.1%
Mean travel time to work (commute): 29.1 minutes
For population 15 years and over in 16914:
Never married: 23.0%
Now married: 60.3%
Separated: 0.9%
Widowed: 6.6%
Divorced: 9.2%
Zip code 16914 compared to state average:
Black race population percentage significantly below state average.
Hispanic race population percentage significantly below state average.
Foreign-born population percentage significantly below state average.
Renting percentage below state average.
Length of stay since moving in significantly above state average.
Number of college students below state average.
Percentage of population with a bachelor's degree or higher below state average.
Averages for the 2020 tax year for zip code 16914, filed in 2021:
Average Adjusted Gross Income (AGI) in 2020: $53,649 (Individual Income Tax Returns)
Here:
$53,649
State:
$75,707
Salary/wage: $46,609 (reported on 76.4% of returns)
Here:
$46,609
State:
$62,806
(% of AGI for various income ranges: 1178.0% for AGIs below $25k, 3185.4% for AGIs $25k-50k, 5673.1% for AGIs $50k-75k, 8458.9% for AGIs $75k-100k, 21273.3% for AGIs $100k-200k)
Taxable interest for individuals: $1,570 (reported on 37.7% of returns)
This zip code:
$1,570
Pennsylvania:
$1,633
(% of AGI for various income ranges: 26.5% for AGIs below $25k, 41.2% for AGIs $25k-50k, 22.3% for AGIs $50k-75k, 74.4% for AGIs $75k-100k, 633.3% for AGIs $100k-200k)
Ordinary dividends: $2,983 (reported on 21.7% of returns)
Here:
$2,983
State:
$7,382
(% of AGI for various income ranges: 36.5% for AGIs below $25k, 27.5% for AGIs $25k-50k, 44.6% for AGIs $50k-75k, 74.4% for AGIs $75k-100k, 703.3% for AGIs $100k-200k)
Net capital gain/loss in AGI: +$7,059 (reported on 16.0% of returns)
Here:
+$7,059
State:
+$23,522
(% of AGI for various income ranges: 18.5% for AGIs below $25k, 35.0% for AGIs $25k-50k, 62.3% for AGIs $50k-75k, 32.2% for AGIs $75k-100k, 1615.0% for AGIs $100k-200k)
Profit/loss from business: +$8,840 (reported on 14.2% of returns)
Here:
+$8,840
State:
+$16,274
(% of AGI for various income ranges: 157.0% for AGIs below $25k, 103.8% for AGIs $25k-50k, 208.5% for AGIs $50k-75k, 73.3% for AGIs $75k-100k, 710.0% for AGIs $100k-200k)
Taxable individual retirement arrangement distribution: $13,462 (reported on 12.3% of returns)
16914:
$13,462
Pennsylvania:
$18,583
(% of AGI for various income ranges: 76.5% for AGIs below $25k, 139.6% for AGIs $25k-50k, 457.7% for AGIs $50k-75k, 1111.7% for AGIs $100k-200k)
Total itemized deductions: $38,800 (reported on 1.9% of returns)
Here:
$38,800
State:
$34,850
(% of AGI for various income ranges: 323.3% for AGIs $25k-50k)
Taxes paid: $6,600 (reported on 1.9% of returns)
16914:
$6,600
State:
$8,200
(% of AGI for various income ranges: 55.0% for AGIs $25k-50k)
Earned income credit: $2,525 (reported on 15.1% of returns)
Here:
$2,525
State:
$2,100
(% of AGI for various income ranges: 113.5% for AGIs below $25k, 73.8% for AGIs $25k-50k)
Percentage of individuals using paid preparers for their 2020 taxes: 95.3%
Here:
95%
State:
92%
(% for various income ranges: 96.9% for AGIs below $25k, 93.3% for AGIs $25k-50k, 94.4% for AGIs $50k-75k, 100.0% for AGIs $75k-100k, 92.9% for AGIs $100k-200k)
Averages for the 2012 tax year for zip code 16914, filed in 2013:
Average Adjusted Gross Income (AGI) in 2012: $56,366 (Individual Income Tax Returns)
Here:
$56,366
State:
$61,346
Salary/wage: $39,844 (reported on 79.6% of returns)
Here:
$39,844
State:
$51,902
(% of AGI for various income ranges: 66.8% for AGIs below $25k, 70.9% for AGIs $25k-50k, 73.6% for AGIs $50k-75k, 69.3% for AGIs $75k-100k, 55.8% for AGIs $100k-200k, 18.1% for AGIs over 200k)
Taxable interest for individuals: $1,162 (reported on 40.8% of returns)
This zip code:
$1,162
Pennsylvania:
$1,588
(% of AGI for various income ranges: 1.6% for AGIs below $25k, 0.8% for AGIs $25k-50k, 0.4% for AGIs $50k-75k, 0.7% for AGIs $75k-100k, 1.0% for AGIs $100k-200k, 0.9% for AGIs over 200k)
Ordinary dividends: $1,657 (reported on 22.3% of returns)
Here:
$1,657
State:
$5,827
(% of AGI for various income ranges: 1.2% for AGIs below $25k, 0.5% for AGIs $25k-50k, 0.4% for AGIs $50k-75k, 0.9% for AGIs $75k-100k, 0.6% for AGIs $100k-200k, 0.6% for AGIs over 200k)
Net capital gain/loss in AGI: +$7,762 (reported on 12.6% of returns)
Here:
+$7,762
State:
+$14,495
(% of AGI for various income ranges: 2.7% for AGIs below $25k, 2.3% for AGIs $25k-50k, 1.4% for AGIs $50k-75k, 2.6% for AGIs $100k-200k, 1.3% for AGIs over 200k)
Profit/loss from business: +$11,306 (reported on 15.5% of returns)
Here:
+$11,306
State:
+$16,268
(% of AGI for various income ranges: 5.8% for AGIs below $25k, 4.7% for AGIs $25k-50k, 5.6% for AGIs $50k-75k, 3.9% for AGIs $100k-200k)
Taxable individual retirement arrangement distribution: $6,073 (reported on 10.7% of returns)
16914:
$6,073
Pennsylvania:
$14,550
(% of AGI for various income ranges: 4.4% for AGIs below $25k, 2.6% for AGIs $25k-50k, 2.9% for AGIs $75k-100k)
Total itemized deductions: $19,394 (15% of AGI, reported on 17.5% of returns)
Here:
$19,394
State:
$23,538
Here:
15.2% of AGI
State:
18.4% of AGI
(% of AGI for various income ranges: 4.7% for AGIs $25k-50k, 6.8% for AGIs $50k-75k, 4.8% for AGIs $75k-100k, 7.6% for AGIs $100k-200k, 7.5% for AGIs over 200k)
Charity contributions: $4,423 (reported on 12.6% of returns)
Here:
$4,423
State:
$4,025
(% of AGI for various income ranges: 1.0% for AGIs $50k-75k, 1.8% for AGIs $100k-200k, 1.8% for AGIs over 200k)
Taxes paid: $7,822 (reported on 17.5% of returns)
16914:
$7,822
State:
$9,982
(% of AGI for various income ranges: 1.6% for AGIs $25k-50k, 1.8% for AGIs $50k-75k, 2.0% for AGIs $75k-100k, 3.0% for AGIs $100k-200k, 4.1% for AGIs over 200k)
Earned income credit: $2,400 (reported on 14.6% of returns)
Here:
$2,400
State:
$2,106
(% of AGI for various income ranges: 6.3% for AGIs below $25k, 0.9% for AGIs $25k-50k)
Percentage of individuals using paid preparers for their 2012 taxes: 75.7%
Here:
76%
State:
53%
(% for various income ranges: 68.4% for AGIs below $25k, 72.0% for AGIs $25k-50k, 81.2% for AGIs $50k-75k, 88.9% for AGIs $75k-100k, 81.8% for AGIs $100k-200k, 100.0% for AGIs over 200k)
Averages for the 2004 tax year for zip code 16914, filed in 2005:
Average Adjusted Gross Income (AGI) in 2004: $30,903 (Individual Income Tax Returns)
Here:
$30,903
State:
$48,049
Salary/wage: $28,013 (reported on 81.2% of returns)
Here:
$28,013
State:
$42,646
(% of AGI for various income ranges: 131.8% for AGIs below $10k, 67.3% for AGIs $10k-25k, 78.1% for AGIs $25k-50k, 78.4% for AGIs $50k-75k, 79.0% for AGIs $75k-100k, 47.8% for AGIs over 100k)
Taxable interest for individuals: $1,197 (reported on 45.5% of returns)
This zip code:
$1,197
Pennsylvania:
$1,657
(% of AGI for various income ranges: 6.7% for AGIs below $10k, 3.6% for AGIs $10k-25k, 2.1% for AGIs $25k-50k, 0.5% for AGIs $50k-75k, 0.5% for AGIs $75k-100k, 1.2% for AGIs over 100k)
Taxable dividends: $1,114 (reported on 23.0% of returns)
Here:
$1,114
State:
$3,566
(% of AGI for various income ranges: 4.4% for AGIs below $10k, 1.4% for AGIs $10k-25k, 0.4% for AGIs $25k-50k, 0.4% for AGIs $50k-75k, 0.4% for AGIs $75k-100k, 1.7% for AGIs over 100k)
Net capital gain/loss: +$8,545 (reported on 20.6% of returns)
Here:
+$8,545
State:
+$9,716
(% of AGI for various income ranges: 3.5% for AGIs below $10k, 3.4% for AGIs $10k-25k, 2.3% for AGIs $25k-50k, 2.8% for AGIs $50k-75k, 3.8% for AGIs $75k-100k, 22.6% for AGIs over 100k)
Profit/loss from business: +$5,423 (reported on 15.2% of returns)
Here:
+$5,423
State:
+$14,267
(% of AGI for various income ranges: 17.1% for AGIs below $10k, 6.9% for AGIs $10k-25k, 2.6% for AGIs $25k-50k, 1.4% for AGIs $50k-75k)
Profit/loss from farming: +$1,342 (reported on 7.4% of returns)
Here:
+$1,342
State:
+$274
(% of AGI for various income ranges: -14.4% for AGIs below $10k, 1.8% for AGIs $10k-25k, 1.1% for AGIs $25k-50k, 0.2% for AGIs $50k-75k)
IRA payment deduction: $2,762 (reported on 4.1% of returns)
16914:
$2,762
Pennsylvania:
$2,903
Total itemized deductions: $14,462 (20% of AGI, reported on 12.9% of returns)
Here:
$14,462
State:
$18,804
Here:
20.2% of AGI
State:
19.5% of AGI
(% of AGI for various income ranges: 2.4% for AGIs $10k-25k, 4.1% for AGIs $25k-50k, 7.9% for AGIs $50k-75k, 8.0% for AGIs $75k-100k, 10.6% for AGIs over 100k)
Charity contributions deductions: $2,439 (3% of AGI, reported on 10.4% of returns)
Here:
$2,439
State:
$3,337
Here:
3.2% of AGI
State:
3.3% of AGI
(% of AGI for various income ranges: 0.5% for AGIs $25k-50k, 0.8% for AGIs $50k-75k, 0.7% for AGIs $75k-100k, 2.9% for AGIs over 100k)
Total tax: $3,656 (reported on 70.0% of returns)
16914:
$3,656
State:
$8,008
(% of AGI for various income ranges: 5.1% for AGIs below $10k, 4.2% for AGIs $10k-25k, 6.4% for AGIs $25k-50k, 8.1% for AGIs $50k-75k, 9.6% for AGIs $75k-100k, 16.9% for AGIs over 100k)
Earned income credit: $1,739 (reported on 20.2% of returns)
Here:
$1,739
State:
$1,643
Percentage of individuals using paid preparers for their 2004 taxes: 74.3%
Here:
74%
State:
56%
(% for various income ranges: 66.9% for AGIs below $10k, 76.8% for AGIs $10k-25k, 77.0% for AGIs $25k-50k, 78.2% for AGIs $50k-75k, 69.8% for AGIs $75k-100k, 82.8% for AGIs over 100k)
Household received Food Stamps/SNAP in the past 12 months: 84 Household did not receive Food Stamps/SNAP in the past 12 months: 832
Women who had a birth in the past 12 months: 53 (28 now married, 22 unmarried) Women who did not have a birth in the past 12 months: 448 (234 now married, 211 unmarried)
Housing units in zip code 16914 with a mortgage: 333 (60 second mortgage, 15 both second mortgage and home equity loan) Houses without a mortgage: 16
Median monthly owner costs for units with a mortgage: $1,367 Median monthly owner costs for units without a mortgage: $472
Residents with income below the poverty level in 2022:
This zip code:
9.6%
Whole state:
11.8%
Residents with income below 50% of the poverty level in 2022:
This zip code:
5.5%
Whole state:
6.1%
Median number of rooms in houses and condos:
Here:
7.0
State:
6.8
Median number of rooms in apartments:
Here:
5.9
State:
4.3
Notable locations in this zip code not listed on our city pages
Size of family households: 322 2-persons, 93 3-persons, 90 4-persons, 123 5-persons, 38 6-persons, 3 7-or-more-persons
Size of nonfamily households: 192 1-person, 54 2-persons
496 married couples with children.
132 single-parent households (7 men, 125 women).
97.9% of residents of 16914 zip code speak English at home.
0.6% of residents speak Spanish at home (100% very well).
0.7% of residents speak other Indo-European language at home (44% very well, 56% well).
Foreign born population: 15 (0.6%) (54.3% of them are naturalized citizens)
This zip code:
0.6%
Whole state:
7.5%
20%Tanzania
13%France
37%German
13%English
13%American
9%Irish
5%Italian
3%Polish
2%Scottish
Year of entry for the foreign-born population
92010 or later
52000 to 2009
31990 to 1999
16Before 1990
Housing units lacking complete plumbing facilities: 4.7% Housing units lacking complete kitchen facilities: 2.7%
53.3%Utility gas
15.7%Fuel oil, kerosene, etc.
13.4%Wood
11.1%Bottled, tank, or LP gas
3.4%Coal or coke
2.1%Electricity
0.7%Other fuel
0.7%No fuel used
Population in 1990: 2,398. Population change in the 1990s: +115 (+4.8%).
Place of birth for U.S.-born residents:
This state: 1,609
Northeast: 633
Midwest: 42
South: 52
West: 40
73% of the 16914 zip code residents lived in the same house 5 years ago. Out of people who lived in different houses, 71% lived in this county. Out of people who lived in different counties, 50% lived in Pennsylvania.
97% of the 16914 zip code residents lived in the same house 1 year ago. Out of people who lived in different houses, 62% moved from this county. Out of people who lived in different houses, 30% moved from different county within same state. Out of people who lived in different houses, 11% moved from different state. Out of people who lived in different houses, 4% moved from abroad.
Private vs. public school enrollment:
Students in private schools in grades 1 to 8 (elementary and middle school): 45
Here:
12.3%
Pennsylvania:
15.7%
Students in private schools in grades 9 to 12 (high school): 32
Here:
22.5%
Pennsylvania:
13.4%
Students in private undergraduate colleges: 12
Here:
35.3%
Pennsylvania:
39.8%
Occupation by median earnings in the past 12 months ($)
119,754Business and financial operations occupations
69,791Construction and extraction occupations
69,264Architecture and engineering occupations
64,117Health diagnosing and treating practitioners and other technical occupations
55,064Installation, maintenance, and repair occupations
51,813Transportation occupations
Top industries in this zip code by the number of employees in 2005:
Wholesale Trade: Farm and Garden Machinery and Equipment Merchant Wholesalers (10-19 employees: 1 establishment, 1-4 employees: 1 establishment)

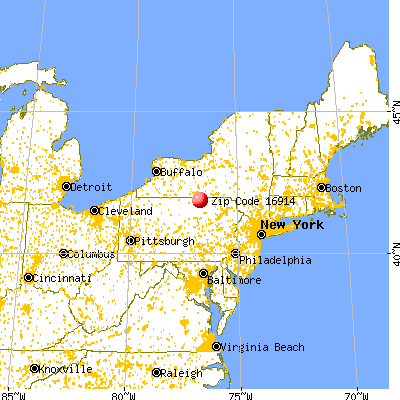


 Nearest zip codes: 16925, 16947, 16926, 18817, 14894, 16932.


