Estimated zip code population in 2022: 1,120 Zip code population in 2010: 1,256 Zip code population in 2000: 1,256
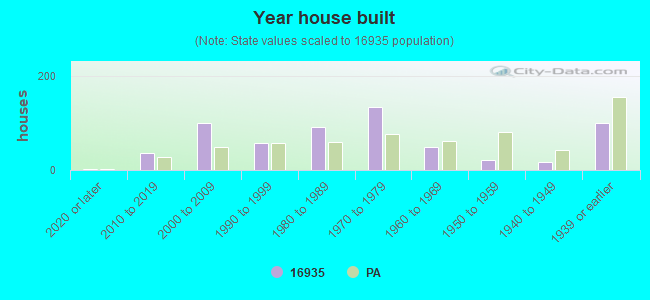
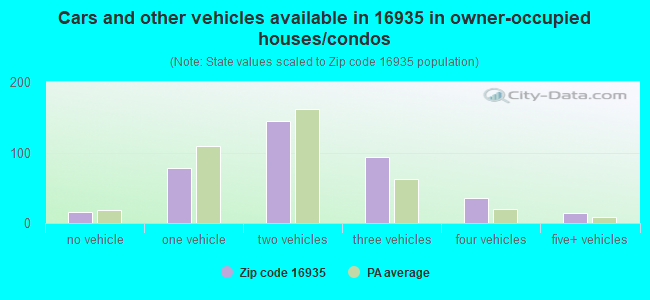
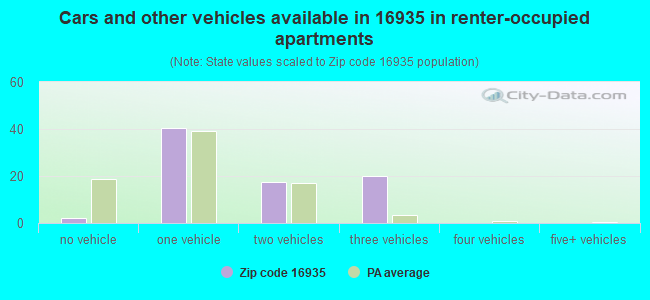
Houses and condos: 612 Renter-occupied apartments: 79
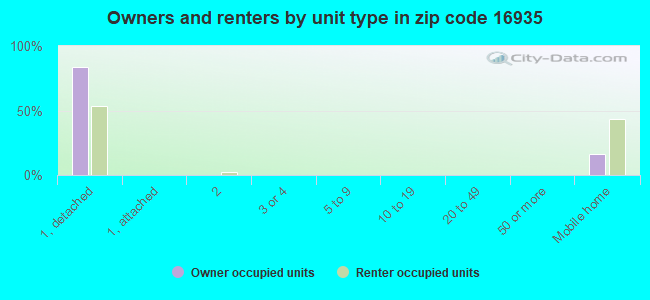
% of renters here:
17%
State:
31%
March 2022 cost of living index in zip code 16935: 91.8 (less than average, U.S. average is 100)
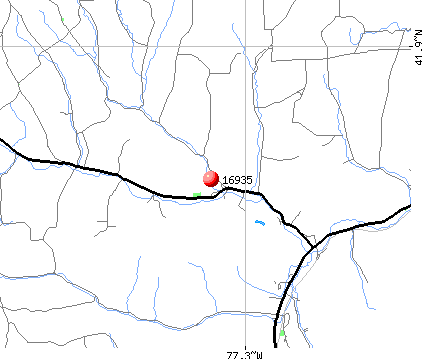
Land area: 50.0 sq. mi. Water area: 0.0 sq. mi.
Population density: 22 people per square mile
(very low).
OSM Map
General Map
Google Map
MSN Map
OSM Map
General Map
Google Map
MSN Map
OSM Map
General Map
Google Map
MSN Map
OSM Map
General Map
Google Map
MSN Map
Please wait while loading the map...
Real estate property taxes paid for housing units in 2022:
This zip code:
0.9% ($1,717)
Pennsylvania:
1.3% ($3,094)
Median real estate property taxes paid for housing units with mortgages in 2022: $1,757 (0.8%) Median real estate property taxes paid for housing units with no mortgage in 2022: $1,638 (1.0%)
Business Search- 14 Million verified businesses
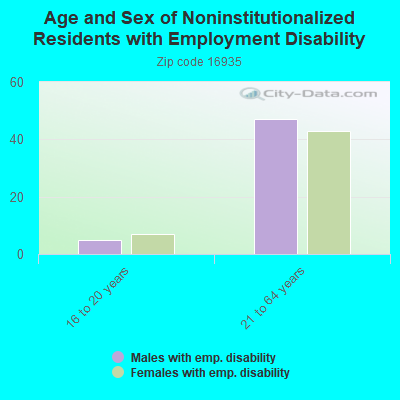
Males: 529
(47.2%)
Females: 591
(52.8%)
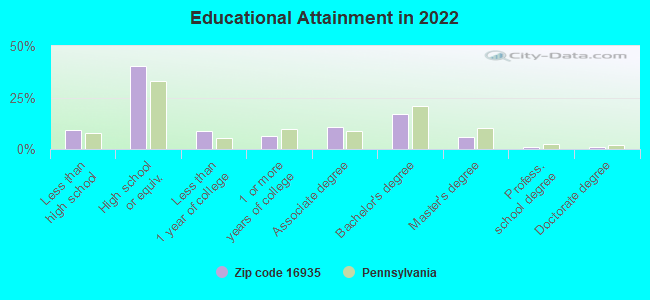
For population 25 years and over in 16935:
High school or higher: 90.2%
Bachelor's degree or higher: 24.6%
Graduate or professional degree: 8.0%
Unemployed: 6.3%
Mean travel time to work (commute): 23.6 minutes
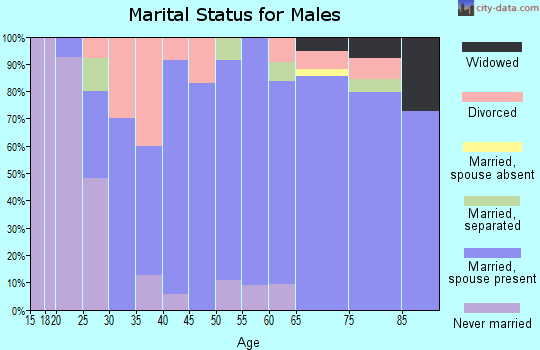
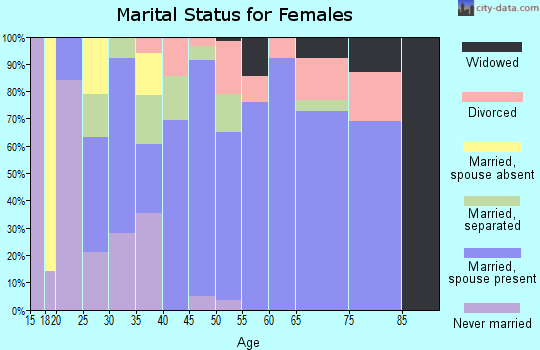
For population 15 years and over in 16935:
Never married: 21.2%
Now married: 61.6%
Separated: 2.1%
Widowed: 7.0%
Divorced: 8.0%
Zip code 16935 compared to state average:
Black race population percentage significantly below state average.
Hispanic race population percentage significantly below state average.
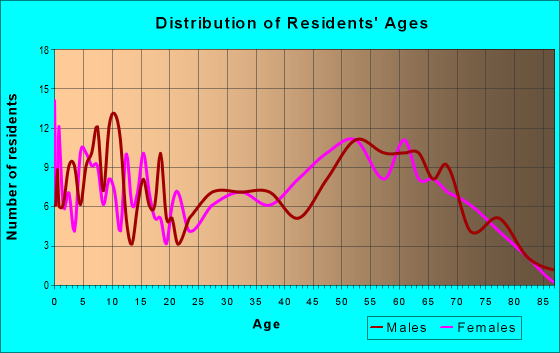
Median age above state average.
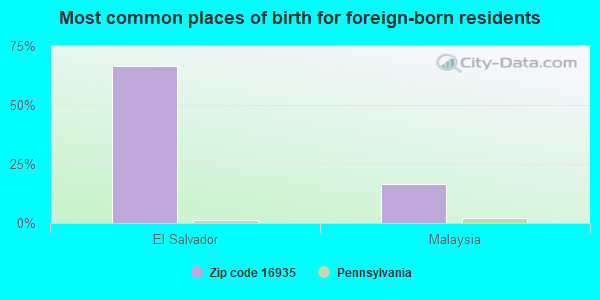
Foreign-born population percentage significantly below state average.
Averages for the 2020 tax year for zip code 16935, filed in 2021:
Average Adjusted Gross Income (AGI) in 2020: $55,007 (Individual Income Tax Returns)
Here:
$55,007
State:
$75,707
Salary/wage: $44,098 (reported on 76.4% of returns)
Here:
$44,098
State:
$62,806
(% of AGI for various income ranges: 856.9% for AGIs below $25k, 3052.2% for AGIs $25k-50k, 4757.1% for AGIs $50k-75k, 7220.0% for AGIs $75k-100k, 13996.0% for AGIs $100k-200k)
Taxable interest for individuals: $550 (reported on 40.0% of returns)
This zip code:
$550
Pennsylvania:
$1,633
(% of AGI for various income ranges: 14.6% for AGIs below $25k, 4.4% for AGIs $25k-50k, 11.4% for AGIs $50k-75k, 31.7% for AGIs $75k-100k, 142.0% for AGIs $100k-200k)
Ordinary dividends: $1,490 (reported on 18.2% of returns)
Here:
$1,490
State:
$7,382
(% of AGI for various income ranges: 10.0% for AGIs below $25k, 37.8% for AGIs $25k-50k, 53.3% for AGIs $75k-100k, 140.0% for AGIs $100k-200k)
Net capital gain/loss in AGI: +$6,062 (reported on 14.5% of returns)
Here:
+$6,062
State:
+$23,522
(% of AGI for various income ranges: 4.6% for AGIs below $25k, 45.6% for AGIs $25k-50k, 730.0% for AGIs $75k-100k)
Profit/loss from business: +$11,100 (reported on 16.4% of returns)
Here:
+$11,100
State:
+$16,274
(% of AGI for various income ranges: 186.9% for AGIs below $25k, 427.1% for AGIs $50k-75k, 761.7% for AGIs $75k-100k)
Taxable individual retirement arrangement distribution: $11,433 (reported on 16.4% of returns)
16935:
$11,433
Pennsylvania:
$18,583
(% of AGI for various income ranges: 144.6% for AGIs below $25k, 266.7% for AGIs $25k-50k, 1001.7% for AGIs $75k-100k)
Earned income credit: $2,129 (reported on 12.7% of returns)
Here:
$2,129
State:
$2,100
(% of AGI for various income ranges: 81.5% for AGIs below $25k, 47.8% for AGIs $25k-50k)
Percentage of individuals using paid preparers for their 2020 taxes: 92.7%
Here:
93%
State:
92%
(% for various income ranges: 88.9% for AGIs below $25k, 100.0% for AGIs $25k-50k, 88.9% for AGIs $50k-75k, 100.0% for AGIs $75k-100k, 87.5% for AGIs $100k-200k)
Averages for the 2012 tax year for zip code 16935, filed in 2013:
Average Adjusted Gross Income (AGI) in 2012: $48,030 (Individual Income Tax Returns)
Here:
$48,030
State:
$61,346
Salary/wage: $40,781 (reported on 82.5% of returns)
Here:
$40,781
State:
$51,902
(% of AGI for various income ranges: 69.0% for AGIs below $25k, 71.8% for AGIs $25k-50k, 75.4% for AGIs $50k-75k, 73.5% for AGIs $75k-100k, 62.5% for AGIs $100k-200k)
Taxable interest for individuals: $419 (reported on 36.8% of returns)
This zip code:
$419
Pennsylvania:
$1,588
(% of AGI for various income ranges: 0.7% for AGIs below $25k, 0.5% for AGIs $25k-50k, 0.3% for AGIs $50k-75k, 0.2% for AGIs $100k-200k)
Ordinary dividends: $1,080 (reported on 17.5% of returns)
Here:
$1,080
State:
$5,827
(% of AGI for various income ranges: 0.3% for AGIs below $25k, 0.8% for AGIs $25k-50k, 0.7% for AGIs $50k-75k, 0.1% for AGIs $100k-200k)
Profit/loss from business: +$9,688 (reported on 14.0% of returns)
Here:
+$9,688
State:
+$16,268
Taxable individual retirement arrangement distribution: $9,314 (reported on 12.3% of returns)
16935:
$9,314
Pennsylvania:
$14,550
(% of AGI for various income ranges: 2.7% for AGIs below $25k, 5.0% for AGIs $25k-50k, 4.4% for AGIs $50k-75k)
Total itemized deductions: $17,864 (22% of AGI, reported on 24.6% of returns)
Here:
$17,864
State:
$23,538
Here:
22.2% of AGI
State:
18.4% of AGI
(% of AGI for various income ranges: 10.3% for AGIs $25k-50k, 7.4% for AGIs $50k-75k, 9.4% for AGIs $75k-100k, 12.6% for AGIs $100k-200k)
Charity contributions: $3,500 (reported on 15.8% of returns)
Here:
$3,500
State:
$4,025
(% of AGI for various income ranges: 1.8% for AGIs below $25k, 1.2% for AGIs $50k-75k, 2.2% for AGIs $100k-200k)
Taxes paid: $6,643 (reported on 24.6% of returns)
16935:
$6,643
State:
$9,982
(% of AGI for various income ranges: 2.6% for AGIs $25k-50k, 2.9% for AGIs $50k-75k, 3.9% for AGIs $75k-100k, 5.2% for AGIs $100k-200k)
Earned income credit: $1,630 (reported on 17.5% of returns)
Here:
$1,630
State:
$2,106
(% of AGI for various income ranges: 5.0% for AGIs below $25k, 0.7% for AGIs $25k-50k)
Percentage of individuals using paid preparers for their 2012 taxes: 64.9%
Here:
65%
State:
53%
(% for various income ranges: 57.1% for AGIs below $25k, 64.3% for AGIs $25k-50k, 66.7% for AGIs $50k-75k, 80.0% for AGIs $75k-100k, 80.0% for AGIs $100k-200k)
Averages for the 2004 tax year for zip code 16935, filed in 2005:
Average Adjusted Gross Income (AGI) in 2004: $31,954 (Individual Income Tax Returns)
Here:
$31,954
State:
$48,049
Salary/wage: $28,943 (reported on 81.4% of returns)
Here:
$28,943
State:
$42,646
(% of AGI for various income ranges: 148.7% for AGIs below $10k, 71.4% for AGIs $10k-25k, 75.4% for AGIs $25k-50k, 77.4% for AGIs $50k-75k, 75.0% for AGIs $75k-100k, 49.6% for AGIs over 100k)
Taxable interest for individuals: $1,188 (reported on 46.6% of returns)
This zip code:
$1,188
Pennsylvania:
$1,657
(% of AGI for various income ranges: 10.6% for AGIs below $10k, 5.0% for AGIs $10k-25k, 1.2% for AGIs $25k-50k, 0.3% for AGIs $50k-75k, 0.1% for AGIs $75k-100k, 2.7% for AGIs over 100k)
Taxable dividends: $1,460 (reported on 21.3% of returns)
Here:
$1,460
State:
$3,566
(% of AGI for various income ranges: 1.2% for AGIs below $10k, 1.4% for AGIs $10k-25k, 0.6% for AGIs $25k-50k, 0.4% for AGIs $50k-75k, 0.0% for AGIs $75k-100k, 3.6% for AGIs over 100k)
Net capital gain/loss: +$2,957 (reported on 16.2% of returns)
Here:
+$2,957
State:
+$9,716
(% of AGI for various income ranges: 1.4% for AGIs below $10k, 0.7% for AGIs $10k-25k, 0.7% for AGIs $25k-50k, 1.4% for AGIs $50k-75k, 6.1% for AGIs $75k-100k)
Profit/loss from business: +$5,583 (reported on 16.5% of returns)
Here:
+$5,583
State:
+$14,267
(% of AGI for various income ranges: -1.9% for AGIs below $10k, 3.6% for AGIs $10k-25k, 4.6% for AGIs $25k-50k, 3.7% for AGIs $50k-75k)
IRA payment deduction: $2,810 (reported on 3.6% of returns)
16935:
$2,810
Pennsylvania:
$2,903
Total itemized deductions: $13,922 (25% of AGI, reported on 19.8% of returns)
Here:
$13,922
State:
$18,804
Here:
24.7% of AGI
State:
19.5% of AGI
(% of AGI for various income ranges: 9.0% for AGIs $10k-25k, 8.7% for AGIs $25k-50k, 9.2% for AGIs $50k-75k, 17.1% for AGIs $75k-100k)
Charity contributions deductions: $2,080 (4% of AGI, reported on 15.1% of returns)
Here:
$2,080
State:
$3,337
Here:
3.6% of AGI
State:
3.3% of AGI
(% of AGI for various income ranges: 0.8% for AGIs $10k-25k, 1.0% for AGIs $25k-50k, 1.3% for AGIs $50k-75k, 1.4% for AGIs $75k-100k)
Total tax: $3,540 (reported on 69.4% of returns)
16935:
$3,540
State:
$8,008
(% of AGI for various income ranges: 1.6% for AGIs below $10k, 3.5% for AGIs $10k-25k, 6.0% for AGIs $25k-50k, 9.0% for AGIs $50k-75k, 10.9% for AGIs $75k-100k, 11.0% for AGIs over 100k)
Earned income credit: $1,716 (reported on 17.5% of returns)
Here:
$1,716
State:
$1,643
Percentage of individuals using paid preparers for their 2004 taxes: 63.7%
Here:
64%
State:
56%
(% for various income ranges: 53.7% for AGIs below $10k, 61.6% for AGIs $10k-25k, 71.1% for AGIs $25k-50k, 67.7% for AGIs $50k-75k, 73.1% for AGIs $75k-100k, 68.8% for AGIs over 100k)
Household received Food Stamps/SNAP in the past 12 months: 78 Household did not receive Food Stamps/SNAP in the past 12 months: 384
Women who had a birth in the past 12 months: 40 (39 now married, 3 unmarried) Women who did not have a birth in the past 12 months: 222 (104 now married, 117 unmarried)
Housing units in zip code 16935 with a mortgage: 175 (22 second mortgage, 2 home equity loan, 19 both second mortgage and home equity loan) Houses without a mortgage: 4
Median monthly owner costs for units with a mortgage: $1,481 Median monthly owner costs for units without a mortgage: $451
Residents with income below the poverty level in 2022:
This zip code:
8.2%
Whole state:
11.8%
Residents with income below 50% of the poverty level in 2022:
This zip code:
4.1%
Whole state:
6.1%
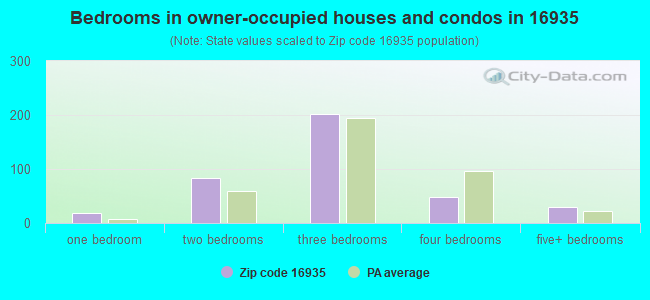
Median number of rooms in houses and condos:
Here:
6.2
State:
6.8
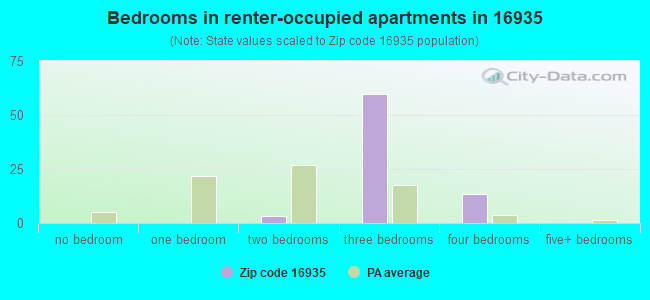
Median number of rooms in apartments:
Here:
5.9
State:
4.3
Notable locations in this zip code not listed on our city pages
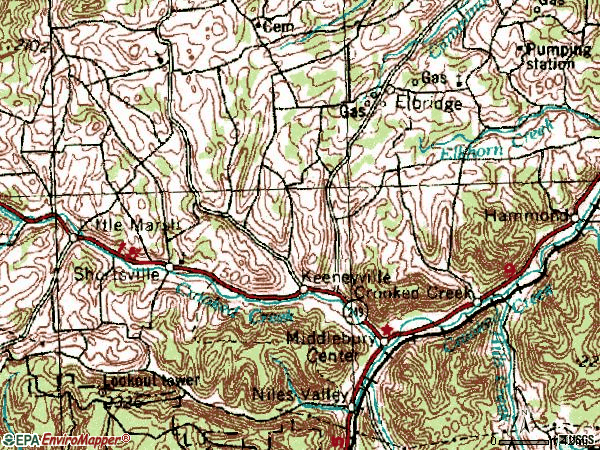
Notable locations in zip code 16935: Holiday Station (A), East Chatham (B), Middlebury Township Volunteer Fire Department (C). Display/hide their locations on the map
Streams, rivers, and creeks: North Run (A), Norris Brook (B), Hemlock Flats Run (C), Smith Run (D), Losey Creek (E). Display/hide their locations on the map
Size of family households: 151 2-persons, 88 3-persons, 35 4-persons, 20 5-persons, 2 6-persons, 16 7-or-more-persons
Size of nonfamily households: 126 1-person, 21 2-persons
122 married couples with children.
34 single-parent households (21 men, 13 women).
98.4% of residents of 16935 zip code speak English at home.
1.0% of residents speak Asian or Pacific Island language at home (100% very well).
Foreign born population: 6 (0.6%) (100.0% of them are naturalized citizens)
This zip code:
0.6%
Whole state:
7.5%
67%El Salvador
17%Malaysia
41%American
16%German
9%English
8%Irish
2%Welsh
2%European
2%Pennsylvania German
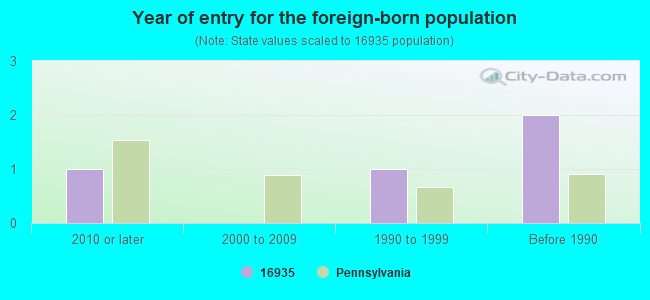
Year of entry for the foreign-born population
12010 or later
02000 to 2009
11990 to 1999
2Before 1990
Housing units lacking complete plumbing facilities: 3.6% Housing units lacking complete kitchen facilities: 2.8%
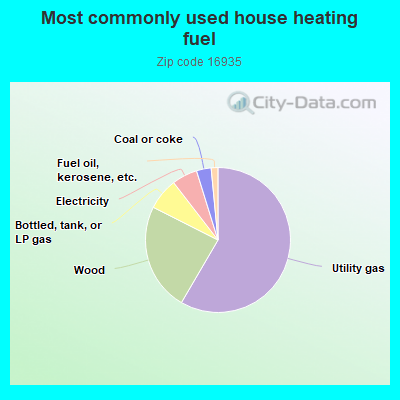
58.6%Utility gas
24.1%Wood
7.1%Bottled, tank, or LP gas
5.7%Electricity
3.3%Coal or coke
1.5%Fuel oil, kerosene, etc.
Population in 1990: 2,549.
Place of birth for U.S.-born residents:
This state: 714
Northeast: 272
Midwest: 14
South: 97
West: 18
59% of the 16935 zip code residents lived in the same house 5 years ago. Out of people who lived in different houses, 60% lived in this county. Out of people who lived in different counties, 50% lived in Pennsylvania.
97% of the 16935 zip code residents lived in the same house 1 year ago. Out of people who lived in different houses, 72% moved from this county. Out of people who lived in different houses, 20% moved from different county within same state. Out of people who lived in different houses, 12% moved from different state.
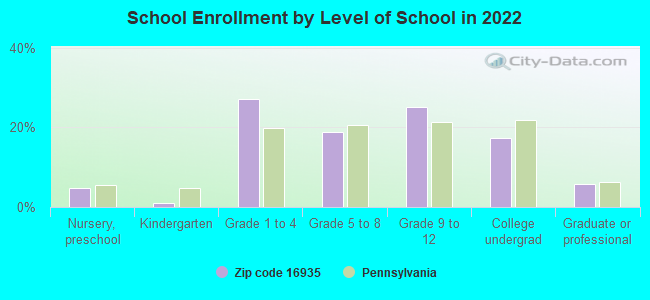
Private vs. public school enrollment:
Students in private schools in grades 1 to 8 (elementary and middle school): 6
Here:
7.1%
Pennsylvania:
15.7%
Students in private schools in grades 9 to 12 (high school): 13
Here:
27.8%
Pennsylvania:
13.4%
Students in private undergraduate colleges: 4
Here:
14.7%
Pennsylvania:
39.8%
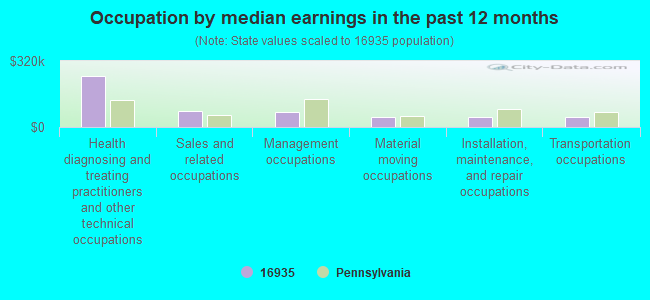
Occupation by median earnings in the past 12 months ($)
245,818Health diagnosing and treating practitioners and other technical occupations
77,589Sales and related occupations
72,612Management occupations
49,107Material moving occupations
48,199Installation, maintenance, and repair occupations
46,673Transportation occupations
Top industries in this zip code by the number of employees in 2005:
Construction: Power and Communication Line and Related Structures Construction (10-19 employees: 1 establishment)
Wholesale Trade: Farm and Garden Machinery and Equipment Merchant Wholesalers (5-9: 1)
Accommodation and Food Services: Full-Service Restaurants (5-9: 1)
Other Services (except Public Administration): Religious Organizations (5-9: 1)
Construction: Plumbing, Heating, and Air-Conditioning Contractors (1-4: 2)
Administrative and Support and Waste Management and Remediation Services: Landscaping Services (1-4: 1)
Fatal accident statistics in 2014:
Fatal accident count: 2
Vehicles involved in fatal accidents: 3
Fatal accidents caused by drunken drivers: 1
Fatalities: 2
Persons involved in fatal accidents: 4
Pedestrians involved in fatal accidents: 0
Fatal accident statistics in 2013:
Fatal accident count: 2
Vehicles involved in fatal accidents: 3
Fatal accidents caused by drunken drivers: 0
Fatalities: 2
Persons involved in fatal accidents: 3
Pedestrians involved in fatal accidents: 0
Most common first names in zip code 16935 among deceased individuals
Name
Count
Lived (average)
William
12
70.5 years
Charles
7
71.3 years
Robert
7
69.1 years
Mary
6
85.3 years
Dorothy
5
74.6 years
Helen
5
81.0 years
Donald
5
71.4 years
Mildred
5
85.6 years
John
4
82.0 years
Albert
4
77.0 years
Most common last names in zip code 16935 among deceased individuals


 Nearest zip codes: 16942, 16920, 16940, 16928, 16901, 16946.