Estimated zip code population in 2022: 12,905 Zip code population in 2010: 11,848 Zip code population in 2000: 11,768
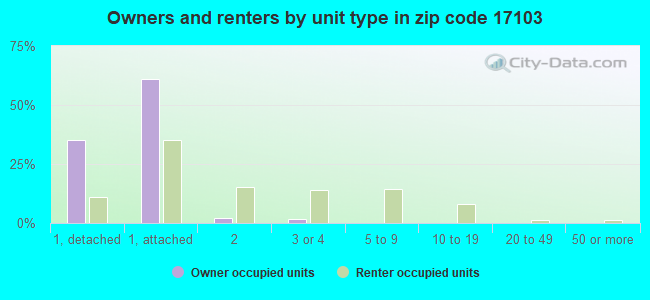
Houses and condos: 5,644 Renter-occupied apartments: 3,125
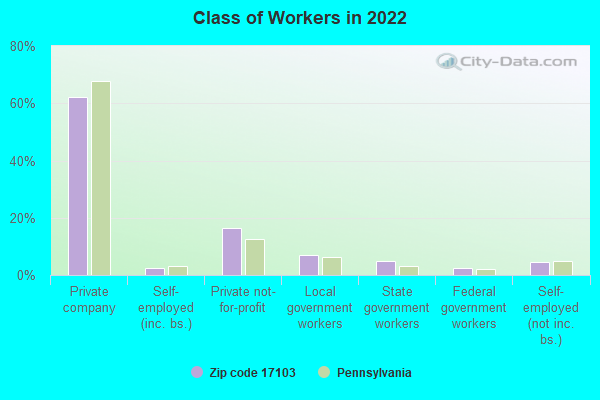
% of renters here:
63%
State:
31%
March 2022 cost of living index in zip code 17103: 94.8 (less than average, U.S. average is 100)
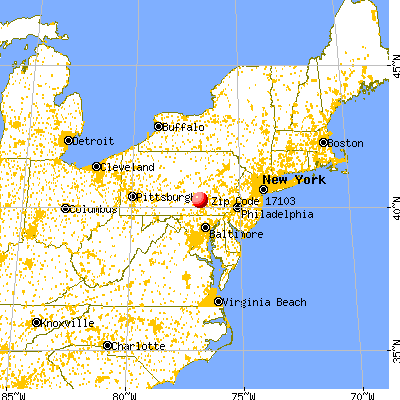
Land area: 2.1 sq. mi. Water area: 0.0 sq. mi.
Population density: 6,274 people per square mile
(high).
OSM Map
General Map
Google Map
MSN Map
OSM Map
General Map
Google Map
MSN Map
OSM Map
General Map
Google Map
MSN Map
OSM Map
General Map
Google Map
MSN Map
Please wait while loading the map...
Real estate property taxes paid for housing units in 2022:
This zip code:
2.1% ($2,366)
Pennsylvania:
1.3% ($3,094)
Median real estate property taxes paid for housing units with mortgages in 2022: $2,389 (2.0%) Median real estate property taxes paid for housing units with no mortgage in 2022: $2,317 (2.4%)
Averages for the 2020 tax year for zip code 17103, filed in 2021:
Average Adjusted Gross Income (AGI) in 2020: $31,545 (Individual Income Tax Returns)
Here:
$31,545
State:
$75,707
Salary/wage: $27,308 (reported on 85.7% of returns)
Here:
$27,308
State:
$62,806
(% of AGI for various income ranges: 1036.9% for AGIs below $25k, 3189.7% for AGIs $25k-50k, 6200.2% for AGIs $50k-75k, 8689.4% for AGIs $75k-100k, 15622.2% for AGIs $100k-200k)
Taxable interest for individuals: $433 (reported on 7.2% of returns)
This zip code:
$433
Pennsylvania:
$1,633
(% of AGI for various income ranges: 1.7% for AGIs below $25k, 3.0% for AGIs $25k-50k, 10.4% for AGIs $50k-75k, 10.6% for AGIs $75k-100k, 30.0% for AGIs $100k-200k)
Ordinary dividends: $1,500 (reported on 2.6% of returns)
Here:
$1,500
State:
$7,382
(% of AGI for various income ranges: 1.5% for AGIs below $25k, 1.6% for AGIs $25k-50k, 5.7% for AGIs $50k-75k, 22.9% for AGIs $75k-100k, 117.8% for AGIs $100k-200k)
Net capital gain/loss in AGI: +$4,850 (reported on 2.6% of returns)
Here:
+$4,850
State:
+$23,522
(% of AGI for various income ranges: 1.6% for AGIs below $25k, 1.4% for AGIs $25k-50k, 11.7% for AGIs $50k-75k, 40.0% for AGIs $75k-100k, 651.1% for AGIs $100k-200k)
Profit/loss from business: +$4,335 (reported on 9.2% of returns)
Here:
+$4,335
State:
+$16,274
(% of AGI for various income ranges: 44.5% for AGIs below $25k, 36.7% for AGIs $25k-50k, 119.4% for AGIs $50k-75k, 9.4% for AGIs $75k-100k, 65.6% for AGIs $100k-200k)
Taxable individual retirement arrangement distribution: $10,518 (reported on 2.7% of returns)
17103:
$10,518
Pennsylvania:
$18,583
(% of AGI for various income ranges: 11.0% for AGIs below $25k, 24.7% for AGIs $25k-50k, 124.5% for AGIs $50k-75k, 498.9% for AGIs $100k-200k)
Total itemized deductions: $24,909 (reported on 1.8% of returns)
Here:
$24,909
State:
$34,850
(% of AGI for various income ranges: 48.2% for AGIs $25k-50k, 262.1% for AGIs $50k-75k, 647.8% for AGIs $100k-200k)
Charity contributions: $7,114 (reported on 1.1% of returns)
Here:
$7,114
State:
$12,392
(% of AGI for various income ranges: 13.2% for AGIs $25k-50k, 144.1% for AGIs $75k-100k)
Taxes paid: $7,891 (reported on 1.8% of returns)
17103:
$7,891
State:
$8,200
(% of AGI for various income ranges: 8.1% for AGIs $25k-50k, 114.0% for AGIs $50k-75k, 196.7% for AGIs $100k-200k)
Earned income credit: $2,363 (reported on 36.3% of returns)
Here:
$2,363
State:
$2,100
(% of AGI for various income ranges: 132.8% for AGIs below $25k, 102.4% for AGIs $25k-50k)
Percentage of individuals using paid preparers for their 2020 taxes: 92.4%
Here:
92%
State:
92%
(% for various income ranges: 91.7% for AGIs below $25k, 93.6% for AGIs $25k-50k, 93.5% for AGIs $50k-75k, 91.3% for AGIs $75k-100k, 87.5% for AGIs $100k-200k)
Averages for the 2012 tax year for zip code 17103, filed in 2013:
Average Adjusted Gross Income (AGI) in 2012: $26,127 (Individual Income Tax Returns)
Here:
$26,127
State:
$61,346
Salary/wage: $23,828 (reported on 88.4% of returns)
Here:
$23,828
State:
$51,902
(% of AGI for various income ranges: 80.7% for AGIs below $25k, 84.7% for AGIs $25k-50k, 76.6% for AGIs $50k-75k, 80.3% for AGIs $75k-100k, 71.1% for AGIs $100k-200k)
Taxable interest for individuals: $358 (reported on 10.2% of returns)
This zip code:
$358
Pennsylvania:
$1,588
(% of AGI for various income ranges: 0.1% for AGIs below $25k, 0.1% for AGIs $25k-50k, 0.3% for AGIs $50k-75k, 0.1% for AGIs $75k-100k, 0.1% for AGIs $100k-200k)
Ordinary dividends: $1,212 (reported on 4.3% of returns)
Here:
$1,212
State:
$5,827
(% of AGI for various income ranges: 0.2% for AGIs below $25k, 0.1% for AGIs $50k-75k, 0.3% for AGIs $75k-100k, 0.8% for AGIs $100k-200k)
Net capital gain/loss in AGI: +$664 (reported on 1.9% of returns)
Here:
+$664
State:
+$14,495
(% of AGI for various income ranges: 0.2% for AGIs $50k-75k)
Profit/loss from business: +$7,457 (reported on 7.5% of returns)
Here:
+$7,457
State:
+$16,268
(% of AGI for various income ranges: 4.9% for AGIs below $25k, 1.2% for AGIs $25k-50k, 1.1% for AGIs $50k-75k, 1.1% for AGIs $75k-100k)
Taxable individual retirement arrangement distribution: $8,583 (reported on 4.1% of returns)
17103:
$8,583
Pennsylvania:
$14,550
(% of AGI for various income ranges: 1.0% for AGIs below $25k, 0.8% for AGIs $25k-50k, 1.9% for AGIs $50k-75k, 4.8% for AGIs $75k-100k)
Total itemized deductions: $14,107 (25% of AGI, reported on 12.1% of returns)
Here:
$14,107
State:
$23,538
Here:
25.4% of AGI
State:
18.4% of AGI
(% of AGI for various income ranges: 2.9% for AGIs below $25k, 6.1% for AGIs $25k-50k, 8.9% for AGIs $50k-75k, 11.4% for AGIs $75k-100k, 11.0% for AGIs $100k-200k)
Charity contributions: $3,426 (reported on 8.5% of returns)
Here:
$3,426
State:
$4,025
(% of AGI for various income ranges: 0.2% for AGIs below $25k, 0.9% for AGIs $25k-50k, 1.5% for AGIs $50k-75k, 2.3% for AGIs $75k-100k, 2.8% for AGIs $100k-200k)
Taxes paid: $4,901 (reported on 11.9% of returns)
17103:
$4,901
State:
$9,982
(% of AGI for various income ranges: 0.8% for AGIs below $25k, 1.9% for AGIs $25k-50k, 3.2% for AGIs $50k-75k, 4.3% for AGIs $75k-100k, 4.4% for AGIs $100k-200k)
Earned income credit: $2,399 (reported on 42.0% of returns)
Here:
$2,399
State:
$2,106
(% of AGI for various income ranges: 10.9% for AGIs below $25k, 2.0% for AGIs $25k-50k)
Percentage of individuals using paid preparers for their 2012 taxes: 45.1%
Here:
45%
State:
53%
(% for various income ranges: 45.9% for AGIs below $25k, 41.2% for AGIs $25k-50k, 46.7% for AGIs $50k-75k, 50.0% for AGIs $75k-100k, 60.0% for AGIs $100k-200k)
Averages for the 2004 tax year for zip code 17103, filed in 2005:
Average Adjusted Gross Income (AGI) in 2004: $25,515 (Individual Income Tax Returns)
Here:
$25,515
State:
$48,049
Salary/wage: $24,046 (reported on 90.0% of returns)
Here:
$24,046
State:
$42,646
(% of AGI for various income ranges: 88.9% for AGIs below $10k, 82.1% for AGIs $10k-25k, 87.6% for AGIs $25k-50k, 84.6% for AGIs $50k-75k, 85.4% for AGIs $75k-100k, 72.1% for AGIs over 100k)
Taxable interest for individuals: $726 (reported on 18.4% of returns)
This zip code:
$726
Pennsylvania:
$1,657
(% of AGI for various income ranges: 0.6% for AGIs below $10k, 0.6% for AGIs $10k-25k, 0.5% for AGIs $25k-50k, 0.6% for AGIs $50k-75k, 0.2% for AGIs $75k-100k, 0.6% for AGIs over 100k)
Taxable dividends: $998 (reported on 7.4% of returns)
Here:
$998
State:
$3,566
(% of AGI for various income ranges: 0.3% for AGIs below $10k, 0.2% for AGIs $10k-25k, 0.3% for AGIs $25k-50k, 0.4% for AGIs $50k-75k, 0.1% for AGIs $75k-100k, 0.7% for AGIs over 100k)
Net capital gain/loss: +$1,643 (reported on 3.8% of returns)
Here:
+$1,643
State:
+$9,716
(% of AGI for various income ranges: -0.4% for AGIs below $10k, -0.0% for AGIs $10k-25k, 0.1% for AGIs $25k-50k, 0.2% for AGIs $50k-75k, 0.1% for AGIs $75k-100k, 3.8% for AGIs over 100k)
Profit/loss from business: +$5,332 (reported on 6.5% of returns)
Here:
+$5,332
State:
+$14,267
(% of AGI for various income ranges: 3.4% for AGIs below $10k, 2.4% for AGIs $10k-25k, 1.0% for AGIs $25k-50k, 1.2% for AGIs $50k-75k, 0.3% for AGIs $75k-100k, 0.0% for AGIs over 100k)
IRA payment deduction: $1,738 (reported on 1.1% of returns)
17103:
$1,738
Pennsylvania:
$2,903
Total itemized deductions: $12,273 (25% of AGI, reported on 15.2% of returns)
Here:
$12,273
State:
$18,804
Here:
24.6% of AGI
State:
19.5% of AGI
(% of AGI for various income ranges: 2.4% for AGIs below $10k, 3.5% for AGIs $10k-25k, 7.0% for AGIs $25k-50k, 11.5% for AGIs $50k-75k, 10.6% for AGIs $75k-100k, 11.4% for AGIs over 100k)
Charity contributions deductions: $2,756 (5% of AGI, reported on 12.1% of returns)
Here:
$2,756
State:
$3,337
Here:
5.3% of AGI
State:
3.3% of AGI
(% of AGI for various income ranges: 0.2% for AGIs below $10k, 0.4% for AGIs $10k-25k, 1.3% for AGIs $25k-50k, 1.9% for AGIs $50k-75k, 2.3% for AGIs $75k-100k, 3.0% for AGIs over 100k)
Total tax: $2,951 (reported on 60.6% of returns)
17103:
$2,951
State:
$8,008
(% of AGI for various income ranges: 1.0% for AGIs below $10k, 3.3% for AGIs $10k-25k, 6.7% for AGIs $25k-50k, 9.5% for AGIs $50k-75k, 11.2% for AGIs $75k-100k, 16.2% for AGIs over 100k)
Earned income credit: $1,844 (reported on 34.5% of returns)
Here:
$1,844
State:
$1,643
Percentage of individuals using paid preparers for their 2004 taxes: 56.1%
Here:
56%
State:
56%
(% for various income ranges: 51.5% for AGIs below $10k, 62.1% for AGIs $10k-25k, 53.5% for AGIs $25k-50k, 55.6% for AGIs $50k-75k, 49.7% for AGIs $75k-100k, 57.1% for AGIs over 100k)
Likely homosexual households (counted as self-reported same-sex unmarried-partner households)
Lesbian couples: 0.3% of all households
Gay men: 0.0% of all households
Household received Food Stamps/SNAP in the past 12 months: 1,777 Household did not receive Food Stamps/SNAP in the past 12 months: 3,269
Women who had a birth in the past 12 months: 204 (172 now married, 37 unmarried) Women who did not have a birth in the past 12 months: 3,154 (708 now married, 2,464 unmarried)
Housing units in zip code 17103 with a mortgage: 1,016 (92 second mortgage, 60 both second mortgage and home equity loan) Houses without a mortgage: 56
Median monthly owner costs for units with a mortgage: $1,055 Median monthly owner costs for units without a mortgage: $581
Residents with income below the poverty level in 2022:
This zip code:
30.4%
Whole state:
11.8%
Residents with income below 50% of the poverty level in 2022:
This zip code:
14.0%
Whole state:
6.1%
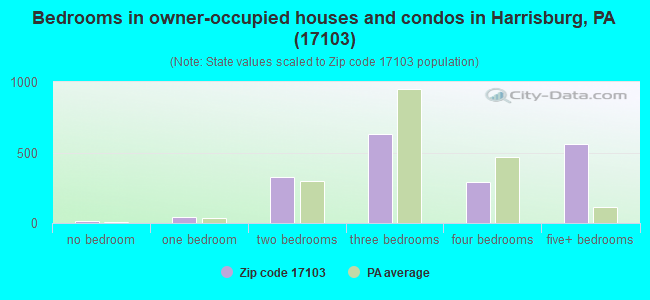
Median number of rooms in houses and condos:
Here:
7.2
State:
6.8
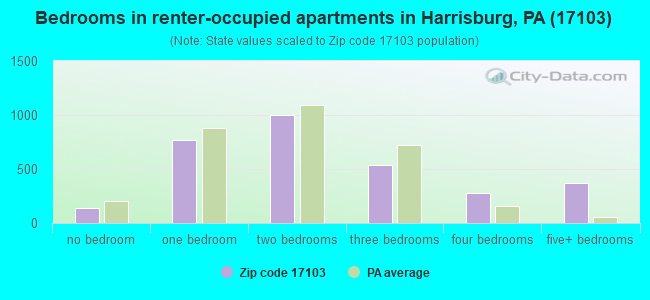
Median number of rooms in apartments:
Here:
5.0
State:
4.3
Notable locations in this zip code not listed on our city pages
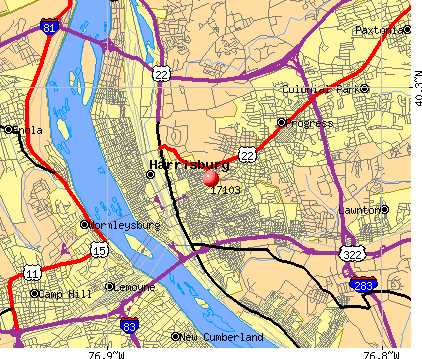
Notable locations in zip code 17103: Harrisburg Bureau of Fire Station 8 Mount Pleasant (A), Harrisburg Bureau of Fire Station 2 (B), State Farm Show Building (C), Citizens Fire Company 1 of Penbrook (D). Display/hide their locations on the map
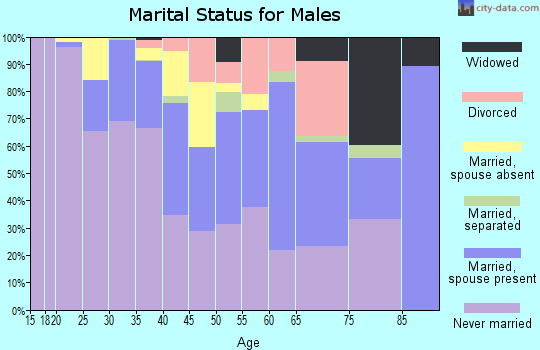
1,156 married couples with children.
2,235 single-parent households (162 men, 2,073 women).
77.9% of residents of 17103 zip code speak English at home.
16.7% of residents speak Spanish at home (37% very well, 36% well, 26% not well, 1% not at all).
1.5% of residents speak other Indo-European language at home (61% very well, 9% well, 29% not well).
0.7% of residents speak Asian or Pacific Island language at home (41% very well, 23% well, 36% not well).
4.2% of residents speak other language at home (30% very well, 65% well, 4% not well, 1% not at all).
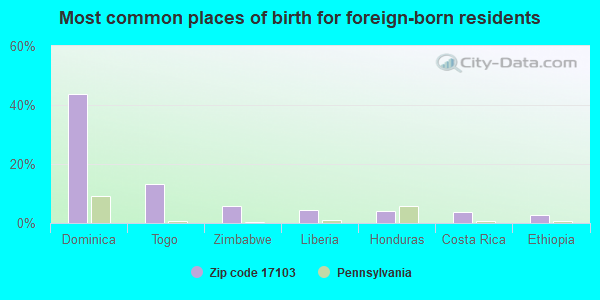
Foreign born population: 1,248 (9.7%) (49.6% of them are naturalized citizens)
Facilities with environmental interests located in this zip code:
BAVARIAN ENTERPRISES INCORPORATED (1037 MACLAY STREET in HARRISBURG, PA)
AIR MINOR (AIRS/AFS) Conditionally Exempt Small Quantity Generators, less than 100 kg/month of hazardous waste (Resource Conservation and Recovery Act (tracking hazardous waste)) - notification Business SIC classification: AUTOMOTIVE REPAIR SHOPS Organizations: OPERNAME (CONTACT/OPERATOR)
, JULIANA ANDREW (CONTACT/OWNER)
ASSOCIATED ADVERTISING SPECIALIST INC (1822 CAMERON ST in HARRISBURG, PA)
Small Quantity Generators, between 100 kg and 1000 kg of hazardous waste/month (Resource Conservation and Recovery Act (tracking hazardous waste)) - notification Organizations: OPERNAME (CONTACT/OPERATOR)
, OWNERNAME (CONTACT/OWNER)
Alternative names: ASSOCIATED AD SPECIALIST
ART COMMUNICATION SYSTEMS INC (1340 N 17TH ST in HARRISBURG, PA)
Conditionally Exempt Small Quantity Generators, less than 100 kg/month of hazardous waste (Resource Conservation and Recovery Act (tracking hazardous waste)) - notification Organizations: HENRY ORFANELLI (CONTACT/OWNER)
Housing units lacking complete plumbing facilities: 3.4% Housing units lacking complete kitchen facilities: 5.5%
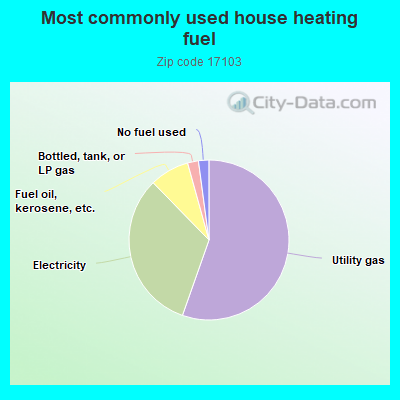
55.4%Utility gas
32.3%Electricity
8.0%Fuel oil, kerosene, etc.
2.2%Bottled, tank, or LP gas
2.1%No fuel used
Population in 1990: 12,335.
Place of birth for U.S.-born residents:
This state: 8,602
Northeast: 991
Midwest: 86
South: 930
West: 168
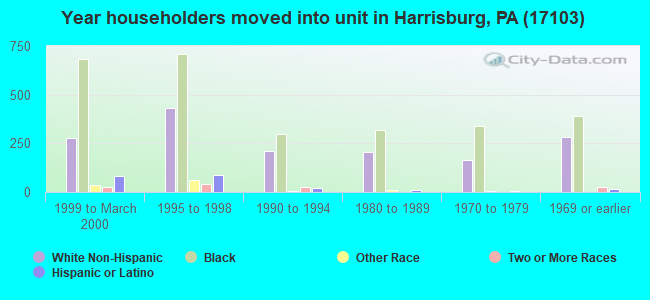
53% of the 17103 zip code residents lived in the same house 5 years ago. Out of people who lived in different houses, 71% lived in this county. Out of people who lived in different counties, 50% lived in Pennsylvania.
86% of the 17103 zip code residents lived in the same house 1 year ago. Out of people who lived in different houses, 56% moved from this county. Out of people who lived in different houses, 20% moved from different county within same state. Out of people who lived in different houses, 14% moved from different state. Out of people who lived in different houses, 8% moved from abroad.
Private vs. public school enrollment:
Students in private schools in grades 1 to 8 (elementary and middle school): 419
Here:
20.0%
Pennsylvania:
15.7%
Students in private schools in grades 9 to 12 (high school): 115
Here:
16.3%
Pennsylvania:
13.4%
Students in private undergraduate colleges: 349
Here:
46.6%
Pennsylvania:
39.8%
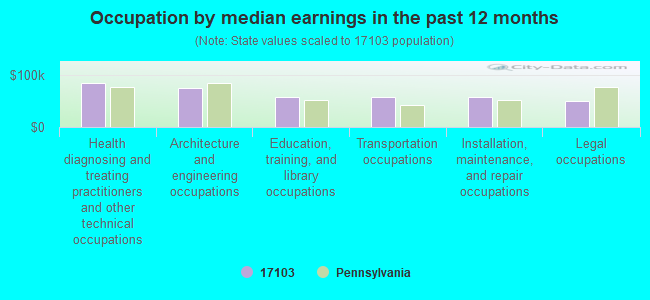
Occupation by median earnings in the past 12 months ($)
84,626Health diagnosing and treating practitioners and other technical occupations
74,276Architecture and engineering occupations
58,531Education, training, and library occupations
58,341Transportation occupations
57,602Installation, maintenance, and repair occupations
50,273Legal occupations
Companies with federal contracts located in this zip code (HARRISBURG, PA):
CHROMALLOY TURBINE AIRFOILS DI (1400 N CAMERON STREET) : $17,120,577 in 10 contractsfrom 1999 to 2004
Contracts for Gas Turbines and Jet Engines, Aircraft; Prime Moving, and Components by Air Force, Defense Logistics Agency Signed by year:2000: $233,995; 2001: $2,302,727; 2002: $0; 2003: $6,924,453; 2004: $4,479,402; 2005: $0; 2006: $0.
Biggest contracts:
$6,697,436 with Air Force for Gas Turbines and Jet Engines, Aircraft; Prime Moving, and Components. Signed on 2003-09-30. Completion date: 2005-04-29.
$4,510,540, same as above.Signed on 2004-09-03. Completion date: 2006-01-31.
$3,180,000, same as above.Signed on 1999-11-03. Completion date: 2000-12-31.
$1,985,380, same as above.Signed on 2001-12-04. Completion date: 2001-11-21.
G B INTERNATIONAL PACKAGING SE (1745 N CAMERON ST; small business) : $154,615 in 16 contractsfrom 2004 to 2006
Contracts for Miscellaneous Engine Accessories, Nonaircraft, Electron Tubes and Associated Hardware, Gas Turbines and Jet Engines, Non-Aircraft; and Components, Commercial and Industrial Gas Cylinders, and moreby Navy Signed by year:2000: $0; 2001: $0; 2002: $0; 2003: $0; 2004: $88,902; 2005: $41,876; 2006: $23,837.
Biggest contracts:
$88,902 with Navy for Miscellaneous Engine Accessories, Nonaircraft. Signed on 2004-05-04. Completion date: 2004-12-31.
$14,040 with Navy for Electron Tubes and Associated Hardware. Signed on 2006-02-16. Completion date: 2006-03-31.
$6,028 with Navy for Gas Turbines and Jet Engines, Non-Aircraft; and Components. Signed on 2005-04-14. Completion date: 2005-07-14.
$5,663 with Navy for Commercial and Industrial Gas Cylinders. Signed on 2005-09-13. Completion date: 2005-12-12.
SLOUGH FLOORING, INC (10 S 24TH ST; small business) : $22,842 in 4 contractsfrom 2003 to 2006
$12,927 with Army for Maintenance, Repair or Alteration of Real Property -- Recreational Buildings. Signed on 2003-08-12. Completion date: 2003-09-01.
$5,035 with Army for Maintenance, Repair or Alteration of Real Property -- Office Buildings. Signed on 2006-03-27. Completion date: 2005-09-30.
$4,880, same as above.Signed on 2005-06-13. Completion date: 2005-09-30.
$0, same as above.Signed on 2006-03-27. Completion date: 2005-09-30.
HARRISBURG DAIRIES INC (2001 HERR ST; small business) : $11,071 in 4 contractsfrom 2004 to 2005
$5,412 with Defense Logistics Agency for Miscellaneous Materials Handling Equipment. Taking place in NC. Signed on 2005-10-25. Completion date: 2006-09-30.
$4,098 with Defense Logistics Agency for Food Services. Taking place in CA. Signed on 2004-10-01. Completion date: 2004-10-30.
$1,561 with Defense Logistics Agency for Food Services. Taking place in NJ. Signed on 2005-12-01. Completion date: 2005-12-01.
$0 with Defense Logistics Agency for Miscellaneous Materials Handling Equipment. Taking place in NC. Signed on 2005-10-25. Completion date: 2006-09-30.
HARRISBURG AWARDS INC (2701 WALNUT ST; small business) : $6,959 in 3 contractsfrom 2003 to 2006
$3,470 with Navy for Lumber and Related Basic Wood Materials. Signed on 2006-01-04. Completion date: 2006-02-03.
$3,364 with Navy for Other Education and Training Services. Signed on 2003-12-22. Completion date: 2004-08-31.
$125 with Navy for Miscellaneous Items. Signed on 2004-09-03. Completion date: 2004-04-03.
EXHIBIT STUDIOS INC (1223 N CAMERON ST; small business) : $5,546 in 3 contractsin 2004
$5,400 with Army for Signs, Advertising Displays, and Identification Plates. Signed on 2004-01-13. Completion date: 2004-02-12.
$194, same as above.Signed on 2004-04-30. Completion date: 2004-05-05.
-$48, same as above.Signed on 2004-05-20. Completion date: 2004-05-05.
CHAMBERS, RONALD D (34 N 20TH ST; small business)
$2,501 with Navy for Food Services. Signed on 2004-03-23. Completion date: 2004-03-24.
Top industries in this zip code by the number of employees in 2005:
Other Services (except Public Administration): Religious Organizations (over 1000 employees: 1 establishment, 5-9 employees: 5 establishments, 1-4 employees: 9 establishments)
Administrative and Support and Waste Management and Remediation Services: Temporary Help Services (100-249: 1, 50-99: 1)
Construction: Glass and Glazing Contractors (100-249: 1)
Health Care and Social Assistance: Child Day Care Services (20-49: 2, 10-19: 2, 5-9: 1, 1-4: 4)
Health Care and Social Assistance: Other Individual and Family Services (50-99: 1, 10-19: 2, 5-9: 1)
Wholesale Trade: Book, Periodical, and Newspaper Merchant Wholesalers (50-99: 1)
People in group quarters in 2010:
42 people in emergency and transitional shelters (with sleeping facilities) for people experiencing homelessness
12 people in residential treatment centers for adults
9 people in group homes intended for adults
People in group quarters in 2000:
63 people in other noninstitutional group quarters
32 people in homes or halfway houses for drug/alcohol abuse
11 people in other group homes
8 people in religious group quarters
7 people in homes for the mentally ill
Fatal accident statistics in 2013:
Fatal accident count: 1
Vehicles involved in fatal accidents: 1
Fatal accidents caused by drunken drivers: 0
Fatalities: 1
Persons involved in fatal accidents: 3
Pedestrians involved in fatal accidents: 1
Fatal accident statistics in 2012:
Fatal accident count: 2
Vehicles involved in fatal accidents: 3
Fatal accidents caused by drunken drivers: 0
Fatalities: 2
Persons involved in fatal accidents: 4
Pedestrians involved in fatal accidents: 1
Home Mortgage Disclosure Act Aggregated Statistics For Year 2009 (Based on 2 full and 8 partial tracts)
A) FHA, FSA/RHS & VA Home Purchase Loans
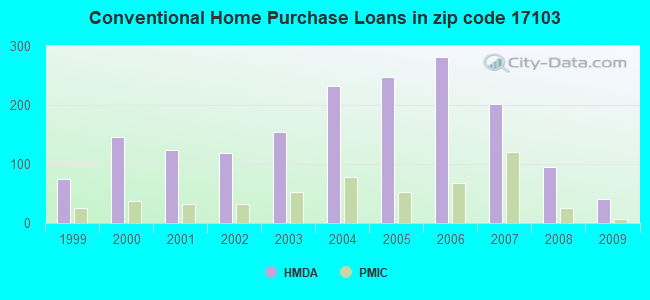
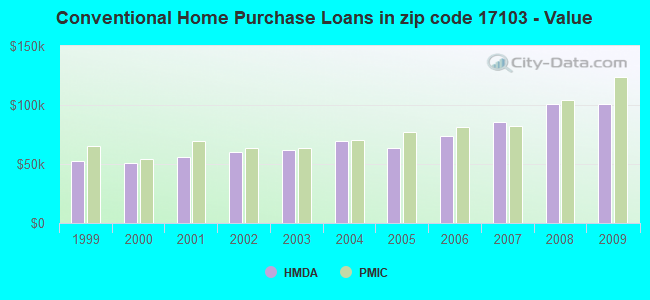
B) Conventional Home Purchase Loans
C) Refinancings
D) Home Improvement Loans
E) Loans on Dwellings For 5+ Families
F) Non-occupant Loans on < 5 Family Dwellings (A B C & D)
G) Loans On Manufactured Home Dwelling (A B C & D)
Number
Average Value
Number
Average Value
Number
Average Value
Number
Average Value
Number
Average Value
Number
Average Value
Number
Average Value
LOANS ORIGINATED
57
$107,583
41
$100,759
131
$100,064
34
$41,488
2
$545,745
55
$118,809
0
$0
APPLICATIONS APPROVED, NOT ACCEPTED
4
$94,875
2
$114,950
7
$87,383
5
$10,408
0
$0
2
$48,550
0
$0
APPLICATIONS DENIED
13
$100,500
10
$48,179
106
$90,522
58
$29,321
2
$45,800
25
$53,264
1
$29,220
APPLICATIONS WITHDRAWN
4
$82,505
5
$57,818
51
$91,672
9
$54,449
0
$0
21
$70,711
0
$0
FILES CLOSED FOR INCOMPLETENESS
0
$0
2
$29,960
12
$99,212
4
$119,365
0
$0
4
$75,435
0
$0
Aggregated Statistics For Year 2008 (Based on 2 full and 8 partial tracts)
A) FHA, FSA/RHS & VA Home Purchase Loans
B) Conventional Home Purchase Loans
C) Refinancings
D) Home Improvement Loans
E) Loans on Dwellings For 5+ Families
F) Non-occupant Loans on < 5 Family Dwellings (A B C & D)
G) Loans On Manufactured Home Dwelling (A B C & D)
Number
Average Value
Number
Average Value
Number
Average Value
Number
Average Value
Number
Average Value
Number
Average Value
Number
Average Value
LOANS ORIGINATED
40
$101,300
95
$100,929
195
$87,269
63
$38,694
6
$1,052,583
140
$92,066
0
$0
APPLICATIONS APPROVED, NOT ACCEPTED
1
$169,450
10
$63,292
41
$74,576
10
$23,573
0
$0
14
$59,816
0
$0
APPLICATIONS DENIED
8
$98,352
36
$68,558
261
$81,686
179
$39,104
0
$0
100
$60,438
1
$122,550
APPLICATIONS WITHDRAWN
3
$92,343
13
$69,670
73
$92,156
10
$41,200
1
$328,680
22
$56,204
0
$0
FILES CLOSED FOR INCOMPLETENESS
0
$0
6
$54,627
17
$73,178
7
$24,993
0
$0
7
$46,053
0
$0
Aggregated Statistics For Year 2007 (Based on 2 full and 8 partial tracts)
A) FHA, FSA/RHS & VA Home Purchase Loans
B) Conventional Home Purchase Loans
C) Refinancings
D) Home Improvement Loans
E) Loans on Dwellings For 5+ Families
F) Non-occupant Loans on < 5 Family Dwellings (A B C & D)
G) Loans On Manufactured Home Dwelling (A B C & D)
Number
Average Value
Number
Average Value
Number
Average Value
Number
Average Value
Number
Average Value
Number
Average Value
Number
Average Value
LOANS ORIGINATED
47
$99,021
202
$85,585
211
$69,731
72
$28,068
2
$197,855
151
$72,655
4
$26,902
APPLICATIONS APPROVED, NOT ACCEPTED
2
$123,990
31
$73,435
64
$69,848
23
$42,260
0
$0
33
$61,885
0
$0
APPLICATIONS DENIED
8
$59,181
90
$60,044
345
$78,019
222
$47,604
2
$3,594,960
101
$62,999
5
$33,476
APPLICATIONS WITHDRAWN
3
$79,917
23
$81,249
106
$90,020
23
$36,908
0
$0
22
$50,150
0
$0
FILES CLOSED FOR INCOMPLETENESS
0
$0
23
$81,707
29
$115,617
6
$33,168
0
$0
5
$58,146
0
$0
Aggregated Statistics For Year 2006 (Based on 2 full and 8 partial tracts)
A) FHA, FSA/RHS & VA Home Purchase Loans
B) Conventional Home Purchase Loans
C) Refinancings
D) Home Improvement Loans
E) Loans on Dwellings For 5+ Families
F) Non-occupant Loans on < 5 Family Dwellings (A B C & D)
G) Loans On Manufactured Home Dwelling (A B C & D)
Number
Average Value
Number
Average Value
Number
Average Value
Number
Average Value
Number
Average Value
Number
Average Value
Number
Average Value
LOANS ORIGINATED
28
$99,253
282
$73,992
278
$65,273
79
$31,433
1
$89,710
183
$63,134
0
$0
APPLICATIONS APPROVED, NOT ACCEPTED
1
$149,000
46
$55,885
89
$70,863
9
$30,099
1
$207,430
32
$50,803
0
$0
APPLICATIONS DENIED
1
$121,120
151
$63,202
434
$75,921
142
$34,081
0
$0
85
$49,451
4
$60,152
APPLICATIONS WITHDRAWN
1
$75,830
54
$79,579
217
$78,269
4
$66,938
0
$0
21
$48,891
0
$0
FILES CLOSED FOR INCOMPLETENESS
0
$0
21
$91,046
49
$68,191
3
$35,500
0
$0
9
$67,412
0
$0
Aggregated Statistics For Year 2005 (Based on 2 full and 8 partial tracts)
A) FHA, FSA/RHS & VA Home Purchase Loans
B) Conventional Home Purchase Loans
C) Refinancings
D) Home Improvement Loans
E) Loans on Dwellings For 5+ Families
F) Non-occupant Loans on < 5 Family Dwellings (A B C & D)
G) Loans On Manufactured Home Dwelling (A B C & D)
Number
Average Value
Number
Average Value
Number
Average Value
Number
Average Value
Number
Average Value
Number
Average Value
Number
Average Value
LOANS ORIGINATED
27
$94,742
247
$63,602
308
$59,503
81
$29,321
4
$290,020
157
$55,585
0
$0
APPLICATIONS APPROVED, NOT ACCEPTED
1
$104,920
34
$63,465
89
$60,914
9
$13,292
2
$172,210
20
$51,323
1
$42,360
APPLICATIONS DENIED
4
$65,058
129
$59,279
502
$68,690
151
$31,385
0
$0
95
$55,334
9
$23,174
APPLICATIONS WITHDRAWN
2
$76,170
55
$63,880
287
$80,589
26
$113,958
0
$0
44
$56,560
0
$0
FILES CLOSED FOR INCOMPLETENESS
0
$0
22
$72,213
45
$76,337
2
$23,265
0
$0
7
$40,281
0
$0
Aggregated Statistics For Year 2004 (Based on 2 full and 8 partial tracts)
A) FHA, FSA/RHS & VA Home Purchase Loans
B) Conventional Home Purchase Loans
C) Refinancings
D) Home Improvement Loans
E) Loans on Dwellings For 5+ Families
F) Non-occupant Loans on < 5 Family Dwellings (A B C & D)
G) Loans On Manufactured Home Dwelling (A B C & D)
Number
Average Value
Number
Average Value
Number
Average Value
Number
Average Value
Number
Average Value
Number
Average Value
Number
Average Value
LOANS ORIGINATED
46
$78,333
233
$69,158
307
$59,062
90
$29,576
1
$224,280
218
$52,171
0
$0
APPLICATIONS APPROVED, NOT ACCEPTED
3
$90,083
44
$49,032
108
$58,500
15
$36,973
0
$0
53
$49,267
2
$13,435
APPLICATIONS DENIED
4
$73,585
112
$60,297
495
$62,054
118
$24,428
1
$243,950
82
$53,502
4
$55,042
APPLICATIONS WITHDRAWN
4
$77,042
39
$57,563
213
$68,250
18
$41,494
2
$3,806,665
27
$49,292
1
$116,860
FILES CLOSED FOR INCOMPLETENESS
3
$41,467
14
$56,141
83
$78,195
1
$21,880
0
$0
10
$50,649
0
$0
Aggregated Statistics For Year 2003 (Based on 2 full and 8 partial tracts)
A) FHA, FSA/RHS & VA Home Purchase Loans
B) Conventional Home Purchase Loans
C) Refinancings
D) Home Improvement Loans
E) Loans on Dwellings For 5+ Families
F) Non-occupant Loans on < 5 Family Dwellings (A B C & D)
Number
Average Value
Number
Average Value
Number
Average Value
Number
Average Value
Number
Average Value
Number
Average Value
LOANS ORIGINATED
49
$83,573
155
$61,892
365
$61,579
56
$22,224
2
$378,475
132
$51,861
APPLICATIONS APPROVED, NOT ACCEPTED
5
$65,270
22
$54,117
97
$65,805
10
$35,415
2
$96,180
21
$43,419
APPLICATIONS DENIED
9
$83,857
65
$51,820
464
$59,208
93
$14,924
0
$0
63
$46,597
APPLICATIONS WITHDRAWN
4
$63,665
27
$59,938
182
$62,693
18
$38,843
0
$0
27
$46,082
FILES CLOSED FOR INCOMPLETENESS
4
$95,682
5
$74,560
27
$66,827
4
$10,735
0
$0
10
$42,332
Aggregated Statistics For Year 2002 (Based on 2 full and 8 partial tracts)
A) FHA, FSA/RHS & VA Home Purchase Loans
B) Conventional Home Purchase Loans
C) Refinancings
D) Home Improvement Loans
F) Non-occupant Loans on < 5 Family Dwellings (A B C & D)
Number
Average Value
Number
Average Value
Number
Average Value
Number
Average Value
Number
Average Value
LOANS ORIGINATED
54
$74,346
119
$59,762
291
$61,750
54
$24,563
87
$62,999
APPLICATIONS APPROVED, NOT ACCEPTED
4
$53,840
25
$54,866
115
$65,527
8
$29,351
15
$54,832
APPLICATIONS DENIED
6
$96,372
77
$48,047
446
$52,994
77
$17,041
63
$55,626
APPLICATIONS WITHDRAWN
3
$41,603
13
$55,920
229
$59,454
8
$29,941
20
$56,157
FILES CLOSED FOR INCOMPLETENESS
4
$88,298
2
$56,060
52
$64,334
0
$0
3
$39,273
Aggregated Statistics For Year 2001 (Based on 2 full and 8 partial tracts)
A) FHA, FSA/RHS & VA Home Purchase Loans
B) Conventional Home Purchase Loans
C) Refinancings
D) Home Improvement Loans
E) Loans on Dwellings For 5+ Families
F) Non-occupant Loans on < 5 Family Dwellings (A B C & D)
Number
Average Value
Number
Average Value
Number
Average Value
Number
Average Value
Number
Average Value
Number
Average Value
LOANS ORIGINATED
51
$75,571
124
$55,790
252
$59,178
74
$21,060
2
$75,240
91
$59,441
APPLICATIONS APPROVED, NOT ACCEPTED
7
$51,601
30
$47,079
83
$55,006
13
$14,637
0
$0
16
$48,294
APPLICATIONS DENIED
4
$45,695
100
$47,264
429
$50,344
127
$19,651
0
$0
43
$44,492
APPLICATIONS WITHDRAWN
4
$48,755
17
$47,419
148
$60,143
20
$29,692
0
$0
5
$62,900
FILES CLOSED FOR INCOMPLETENESS
2
$24,965
1
$45,500
31
$59,821
0
$0
0
$0
3
$31,720
Aggregated Statistics For Year 2000 (Based on 2 full and 8 partial tracts)
A) FHA, FSA/RHS & VA Home Purchase Loans
B) Conventional Home Purchase Loans
C) Refinancings
D) Home Improvement Loans
E) Loans on Dwellings For 5+ Families
F) Non-occupant Loans on < 5 Family Dwellings (A B C & D)
Number
Average Value
Number
Average Value
Number
Average Value
Number
Average Value
Number
Average Value
Number
Average Value
LOANS ORIGINATED
67
$62,778
146
$51,107
180
$41,545
93
$14,423
2
$184,565
87
$38,298
APPLICATIONS APPROVED, NOT ACCEPTED
4
$56,152
31
$43,142
85
$45,193
35
$19,782
0
$0
7
$26,563
APPLICATIONS DENIED
7
$58,587
83
$45,798
379
$43,739
137
$15,825
2
$84,880
43
$40,019
APPLICATIONS WITHDRAWN
6
$70,410
29
$56,570
156
$45,651
15
$8,802
0
$0
25
$45,327
FILES CLOSED FOR INCOMPLETENESS
3
$66,710
6
$34,323
62
$59,536
2
$16,975
0
$0
5
$42,314
Aggregated Statistics For Year 1999 (Based on 2 full and 4 partial tracts)
A) FHA, FSA/RHS & VA Home Purchase Loans
B) Conventional Home Purchase Loans
C) Refinancings
D) Home Improvement Loans
E) Loans on Dwellings For 5+ Families
F) Non-occupant Loans on < 5 Family Dwellings (A B C & D)
2005 - 2018 National Fire Incident Reporting System (NFIRS) incidents
Based on the data from the years 2005 - 2018 the average number of fire incidents per year is 61. The highest number of fires - 102 took place in 2016, and the least - 7 in 2010. The data has a dropping trend.
When looking into fire subcategories, the most reports belonged to: Structure Fires (66.9%), and Outside Fires (17.3%).
Fire incident types reported to NFIRS in Zip Code 17103


 Nearest zip codes: 17120, 17104, 17101, 17102, 17043, 17109.


 Based on the data from the years 2005 - 2018 the average number of fire incidents per year is 61. The highest number of fires - 102 took place in 2016, and the least - 7 in 2010. The data has a dropping trend.
 When looking into fire subcategories, the most reports belonged to: Structure Fires (66.9%), and Outside Fires (17.3%).