Estimated zip code population in 2022: 396 Zip code population in 2010: 581 Zip code population in 2000: 579
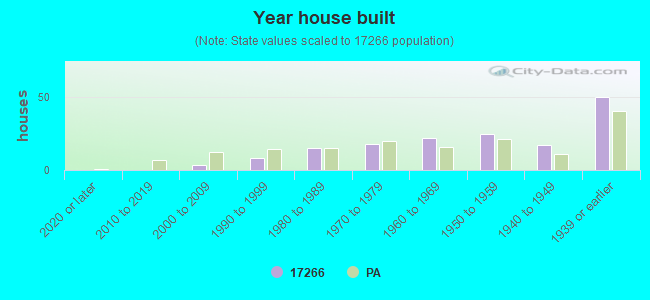
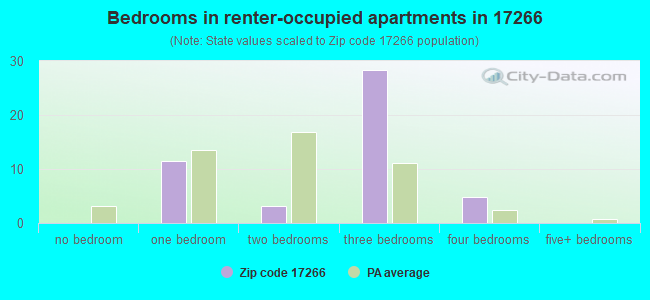
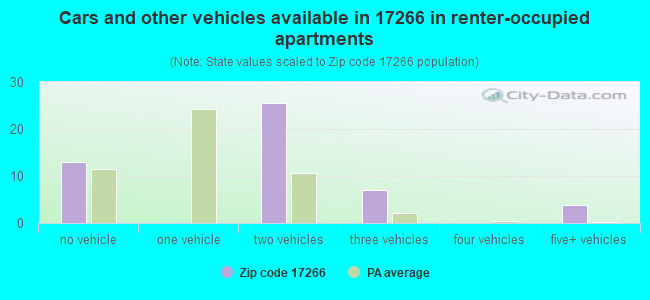
Houses and condos: 162 Renter-occupied apartments: 49
% of renters here:
30%
State:
31%
March 2022 cost of living index in zip code 17266: 95.1 (less than average, U.S. average is 100)
Land area: 1.3 sq. mi. Water area: 0.0 sq. mi.
Population density: 294 people per square mile
(very low).
OSM Map
General Map
Google Map
MSN Map
OSM Map
General Map
Google Map
MSN Map
OSM Map
General Map
Google Map
MSN Map
OSM Map
General Map
Google Map
MSN Map
Please wait while loading the map...
Real estate property taxes paid for housing units in 2022:
This zip code:
1.3% ($2,660)
Pennsylvania:
1.3% ($3,094)
Median real estate property taxes paid for housing units with mortgages in 2022: $2,626 (1.3%) Median real estate property taxes paid for housing units with no mortgage in 2022: $2,693 (1.2%)
Business Search- 14 Million verified businesses
Males: 191
(48.3%)
Females: 204
(51.7%)
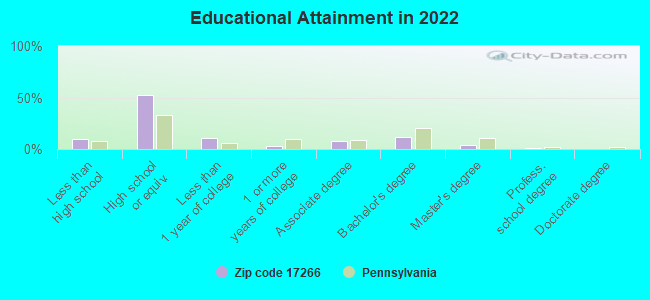
For population 25 years and over in 17266:
High school or higher: 88.1%
Bachelor's degree or higher: 16.7%
Graduate or professional degree: 4.9%
Unemployed: 2.2%
Mean travel time to work (commute): 25.3 minutes
For population 15 years and over in 17266:
Never married: 31.2%
Now married: 61.6%
Separated: 0.0%
Widowed: 4.3%
Divorced: 2.9%
Zip code 17266 compared to state average:
Unemployed percentage below state average.
Black race population percentage significantly below state average.
Hispanic race population percentage significantly below state average.
Foreign-born population percentage significantly below state average.
Number of college students below state average.
Percentage of population with a bachelor's degree or higher below state average.
Averages for the 2020 tax year for zip code 17266, filed in 2021:
Average Adjusted Gross Income (AGI) in 2020: $53,500 (Individual Income Tax Returns)
Here:
$53,500
State:
$75,707
Salary/wage: $43,743 (reported on 79.3% of returns)
Here:
$43,743
State:
$62,806
(% of AGI for various income ranges: 1081.7% for AGIs below $25k, 3850.0% for AGIs $25k-50k, 5955.0% for AGIs $50k-75k, 6883.3% for AGIs $75k-100k, 10133.3% for AGIs $100k-200k)
Taxable interest for individuals: $850 (reported on 34.5% of returns)
This zip code:
$850
Pennsylvania:
$1,633
(% of AGI for various income ranges: 25.0% for AGIs below $25k, 32.0% for AGIs $25k-50k, 85.0% for AGIs $50k-75k, 66.7% for AGIs $75k-100k)
Ordinary dividends: $1,675 (reported on 13.8% of returns)
Here:
$1,675
State:
$7,382
(% of AGI for various income ranges: 167.5% for AGIs $50k-75k)
Net capital gain/loss in AGI: +$3,067 (reported on 10.3% of returns)
Here:
+$3,067
State:
+$23,522
(% of AGI for various income ranges: 230.0% for AGIs $50k-75k)
Profit/loss from business: +$4,400 (reported on 10.3% of returns)
Here:
+$4,400
State:
+$16,274
(% of AGI for various income ranges: 220.0% for AGIs below $25k)
Taxable individual retirement arrangement distribution: $7,900 (reported on 6.9% of returns)
17266:
$7,900
Pennsylvania:
$18,583
(% of AGI for various income ranges: 263.3% for AGIs below $25k)
Earned income credit: $2,700 (reported on 10.3% of returns)
Here:
$2,700
State:
$2,100
(% of AGI for various income ranges: 135.0% for AGIs below $25k)
Percentage of individuals using paid preparers for their 2020 taxes: 93.1%
Here:
93%
State:
92%
(% for various income ranges: 87.5% for AGIs below $25k, 100.0% for AGIs $25k-50k, 100.0% for AGIs $50k-75k, 75.0% for AGIs $75k-100k, 100.0% for AGIs $100k-200k)
Averages for the 2012 tax year for zip code 17266, filed in 2013:
Average Adjusted Gross Income (AGI) in 2012: $39,852 (Individual Income Tax Returns)
Here:
$39,852
State:
$61,346
Salary/wage: $35,744 (reported on 80.6% of returns)
Here:
$35,744
State:
$51,902
(% of AGI for various income ranges: 65.2% for AGIs below $25k, 81.1% for AGIs $25k-50k, 73.3% for AGIs $50k-75k, 67.1% for AGIs $75k-100k)
Taxable interest for individuals: $918 (reported on 35.5% of returns)
This zip code:
$918
Pennsylvania:
$1,588
(% of AGI for various income ranges: 1.2% for AGIs below $25k, 0.7% for AGIs $25k-50k, 0.7% for AGIs $50k-75k, 0.8% for AGIs $75k-100k)
Ordinary dividends: $1,850 (reported on 12.9% of returns)
Here:
$1,850
State:
$5,827
Profit/loss from business: +$5,575 (reported on 12.9% of returns)
Here:
+$5,575
State:
+$16,268
Taxable individual retirement arrangement distribution: $6,250 (reported on 6.5% of returns)
17266:
$6,250
Pennsylvania:
$14,550
Total itemized deductions: $15,343 (24% of AGI, reported on 22.6% of returns)
Here:
$15,343
State:
$23,538
Here:
24.1% of AGI
State:
18.4% of AGI
(% of AGI for various income ranges: 12.1% for AGIs $25k-50k, 10.6% for AGIs $50k-75k, 7.8% for AGIs $75k-100k)
Charity contributions: $1,340 (reported on 16.1% of returns)
Here:
$1,340
State:
$4,025
Taxes paid: $5,114 (reported on 22.6% of returns)
17266:
$5,114
State:
$9,982
(% of AGI for various income ranges: 2.8% for AGIs $25k-50k, 3.3% for AGIs $50k-75k, 3.7% for AGIs $75k-100k)
Earned income credit: $1,650 (reported on 12.9% of returns)
Here:
$1,650
State:
$2,106
(% of AGI for various income ranges: 4.3% for AGIs below $25k)
Percentage of individuals using paid preparers for their 2012 taxes: 61.3%
Here:
61%
State:
53%
(% for various income ranges: 58.3% for AGIs below $25k, 60.0% for AGIs $25k-50k, 60.0% for AGIs $50k-75k, 75.0% for AGIs $75k-100k)
Averages for the 2004 tax year for zip code 17266, filed in 2005:
Average Adjusted Gross Income (AGI) in 2004: $38,910 (Individual Income Tax Returns)
Here:
$38,910
State:
$48,049
Salary/wage: $36,159 (reported on 79.1% of returns)
Here:
$36,159
State:
$42,646
(% of AGI for various income ranges: 63.8% for AGIs below $10k, 64.7% for AGIs $10k-25k, 77.2% for AGIs $25k-50k, 83.7% for AGIs $50k-75k, 80.6% for AGIs $75k-100k, 50.5% for AGIs over 100k)
Taxable interest for individuals: $885 (reported on 46.8% of returns)
This zip code:
$885
Pennsylvania:
$1,657
(% of AGI for various income ranges: 2.0% for AGIs below $10k, 2.2% for AGIs $10k-25k, 0.9% for AGIs $25k-50k, 0.3% for AGIs $50k-75k, 1.6% for AGIs $75k-100k, 0.7% for AGIs over 100k)
Taxable dividends: $500 (reported on 22.3% of returns)
Here:
$500
State:
$3,566
(% of AGI for various income ranges: 0.2% for AGIs $10k-25k, 0.3% for AGIs $25k-50k, 0.5% for AGIs $50k-75k, 0.3% for AGIs $75k-100k)
Net capital gain/loss: +$1,730 (reported on 13.3% of returns)
Here:
+$1,730
State:
+$9,716
(% of AGI for various income ranges: 0.4% for AGIs $10k-25k, 0.0% for AGIs $50k-75k, 2.7% for AGIs $75k-100k)
Profit/loss from business: +$381 (reported on 7.6% of returns)
Here:
+$381
State:
+$14,267
Total itemized deductions: $12,622 (21% of AGI, reported on 26.6% of returns)
Here:
$12,622
State:
$18,804
Here:
21.2% of AGI
State:
19.5% of AGI
Charity contributions deductions: $2,020 (3% of AGI, reported on 18.3% of returns)
Here:
$2,020
State:
$3,337
Here:
3.4% of AGI
State:
3.3% of AGI
Total tax: $4,630 (reported on 78.8% of returns)
17266:
$4,630
State:
$8,008
(% of AGI for various income ranges: 1.6% for AGIs below $10k, 5.0% for AGIs $10k-25k, 7.4% for AGIs $25k-50k, 7.8% for AGIs $50k-75k, 11.4% for AGIs $75k-100k, 17.5% for AGIs over 100k)
Earned income credit: $1,433 (reported on 10.8% of returns)
Here:
$1,433
State:
$1,643
Percentage of individuals using paid preparers for their 2004 taxes: 61.5%
Here:
62%
State:
56%
(% for various income ranges: 50.0% for AGIs below $10k, 65.3% for AGIs $10k-25k, 58.2% for AGIs $25k-50k, 70.7% for AGIs $50k-75k, 96.0% for AGIs $75k-100k)
Likely homosexual households (counted as self-reported same-sex unmarried-partner households)
Lesbian couples: 0.0% of all households
Gay men: 1.7% of all households
Household received Food Stamps/SNAP in the past 12 months: 12 Household did not receive Food Stamps/SNAP in the past 12 months: 147
Women who had a birth in the past 12 months: 25 (12 now married, 12 unmarried) Women who did not have a birth in the past 12 months: 63 (20 now married, 43 unmarried)
Housing units in zip code 17266 with a mortgage: 65 (6 second mortgage) Median monthly owner costs for units with a mortgage: $1,448 Median monthly owner costs for units without a mortgage: $475
Residents with income below the poverty level in 2022:
This zip code:
6.7%
Whole state:
11.8%
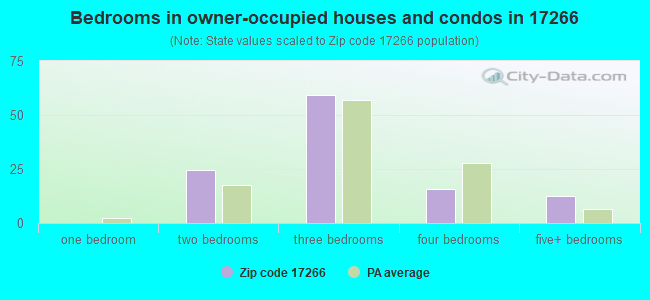
Median number of rooms in houses and condos:
Here:
6.8
State:
6.8
Median number of rooms in apartments:
Here:
5.8
State:
4.3
Notable locations in this zip code not listed on our city pages
Size of family households: 59 2-persons, 23 3-persons, 28 4-persons, 8 5-persons
Size of nonfamily households: 37 1-person, 3 3-persons
51 married couples with children.
8 single-parent households (8 women).
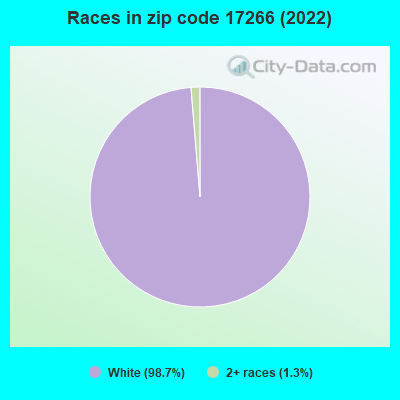
88.3% of residents of 17266 zip code speak English at home.
11.4% of residents speak other Indo-European language at home (88% very well, 12% well).
Foreign born population: 0 (0.0%)
:
0.0%
Whole state:
7.5%
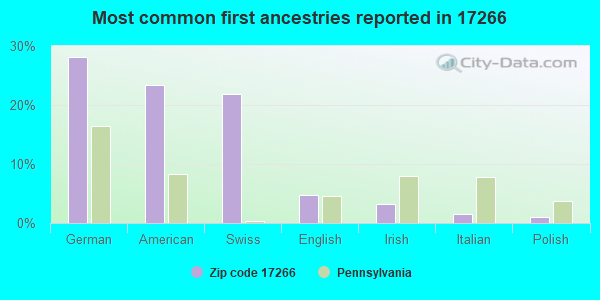
28%German
23%American
22%Swiss
5%English
3%Irish
2%Italian
1%Polish
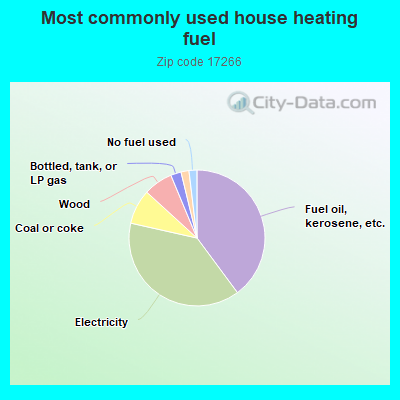
40.1%Fuel oil, kerosene, etc.
38.9%Electricity
8.3%Coal or coke
7.0%Wood
2.5%Bottled, tank, or LP gas
1.9%Other fuel
1.9%No fuel used
Population in 1990: 1,157.
Place of birth for U.S.-born residents:
This state: 313
Northeast: 24
Midwest: 3
South: 26
West: 27
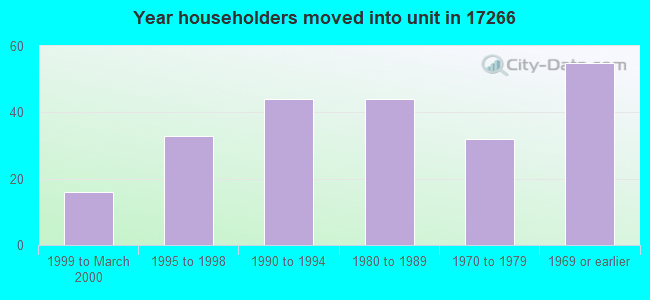
82% of the 17266 zip code residents lived in the same house 5 years ago. Out of people who lived in different houses, 63% lived in this county. Out of people who lived in different counties, 50% lived in Pennsylvania.
90% of the 17266 zip code residents lived in the same house 1 year ago. Out of people who lived in different houses, 62% moved from this county. Out of people who lived in different houses, 31% moved from different county within same state.
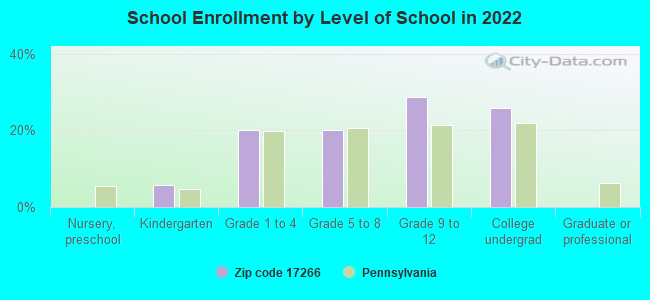
Private vs. public school enrollment:
Students in private schools in grades 1 to 8 (elementary and middle school): 4
Here:
28.5%
Pennsylvania:
15.7%
Students in private schools in grades 9 to 12 (high school): 3
Here:
35.2%
Pennsylvania:
13.4%
Students in private undergraduate colleges:
Here:
0.0%
Pennsylvania:
39.8%
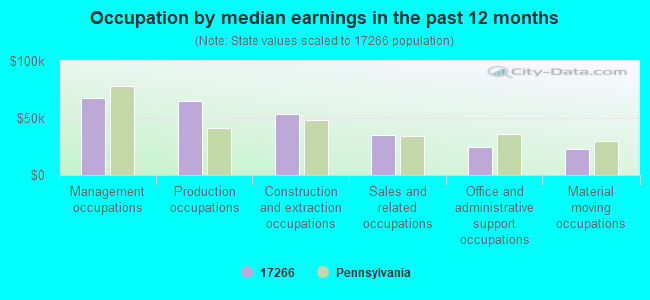
Occupation by median earnings in the past 12 months ($)
67,765Management occupations
64,831Production occupations
53,174Construction and extraction occupations
34,915Sales and related occupations
24,384Office and administrative support occupations
22,980Material moving occupations
Top industries in this zip code by the number of employees in 2005:
Health Care and Social Assistance: Child Day Care Services (20-49 employees: 1 establishment)
Construction: Site Preparation Contractors (20-49: 1)
Other Services (except Public Administration): Religious Organizations (5-9: 1, 1-4: 1)
Information: Cable and Other Program Distribution (5-9: 1)
Information: Internet Service Providers (1-4: 1)
Health Care and Social Assistance: Offices of All Other Miscellaneous Health Practitioners (1-4: 1)
Home Mortgage Disclosure Act Aggregated Statistics For Year 2009 (Based on 2 partial tracts)
A) FHA, FSA/RHS & VA Home Purchase Loans
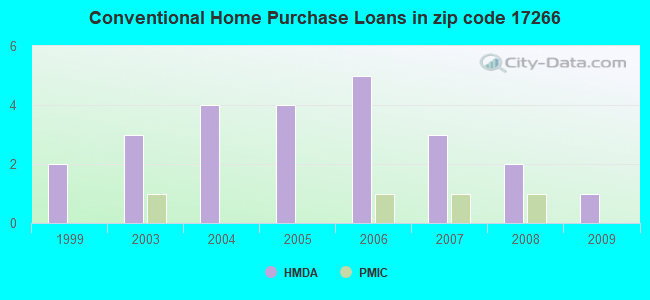
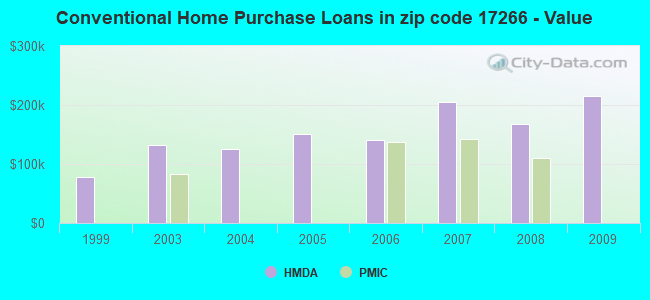
B) Conventional Home Purchase Loans
C) Refinancings
D) Home Improvement Loans
Number
Average Value
Number
Average Value
Number
Average Value
Number
Average Value
LOANS ORIGINATED
1
$92,000
1
$215,890
7
$175,560
1
$73,190
APPLICATIONS APPROVED, NOT ACCEPTED
0
$0
0
$0
1
$90,820
0
$0
APPLICATIONS DENIED
0
$0
0
$0
2
$181,965
0
$0
APPLICATIONS WITHDRAWN
0
$0
0
$0
1
$214,830
0
$0
FILES CLOSED FOR INCOMPLETENESS
0
$0
0
$0
0
$0
0
$0
Aggregated Statistics For Year 2008 (Based on 2 partial tracts)
B) Conventional Home Purchase Loans
C) Refinancings
D) Home Improvement Loans
Number
Average Value
Number
Average Value
Number
Average Value
LOANS ORIGINATED
2
$167,365
6
$135,587
2
$51,440
APPLICATIONS APPROVED, NOT ACCEPTED
0
$0
1
$71,040
0
$0
APPLICATIONS DENIED
0
$0
4
$159,028
1
$53,630
APPLICATIONS WITHDRAWN
0
$0
1
$200,740
0
$0
FILES CLOSED FOR INCOMPLETENESS
0
$0
0
$0
0
$0
Aggregated Statistics For Year 2007 (Based on 2 partial tracts)
B) Conventional Home Purchase Loans
C) Refinancings
D) Home Improvement Loans
Number
Average Value
Number
Average Value
Number
Average Value
LOANS ORIGINATED
3
$205,000
5
$122,350
2
$46,590
APPLICATIONS APPROVED, NOT ACCEPTED
0
$0
1
$130,970
0
$0
APPLICATIONS DENIED
0
$0
3
$183,877
1
$60,200
APPLICATIONS WITHDRAWN
0
$0
1
$171,340
0
$0
FILES CLOSED FOR INCOMPLETENESS
0
$0
0
$0
0
$0
Aggregated Statistics For Year 2006 (Based on 2 partial tracts)
B) Conventional Home Purchase Loans
C) Refinancings
D) Home Improvement Loans
Number
Average Value
Number
Average Value
Number
Average Value
LOANS ORIGINATED
5
$141,076
5
$113,302
2
$40,995
APPLICATIONS APPROVED, NOT ACCEPTED
0
$0
1
$134,830
0
$0
APPLICATIONS DENIED
1
$111,440
4
$121,365
1
$57,100
APPLICATIONS WITHDRAWN
0
$0
2
$154,920
0
$0
FILES CLOSED FOR INCOMPLETENESS
0
$0
1
$72,080
0
$0
Aggregated Statistics For Year 2005 (Based on 2 partial tracts)
B) Conventional Home Purchase Loans
C) Refinancings
D) Home Improvement Loans
G) Loans On Manufactured Home Dwelling (A B C & D)
Number
Average Value
Number
Average Value
Number
Average Value
Number
Average Value
LOANS ORIGINATED
4
$150,270
7
$110,801
2
$43,765
0
$0
APPLICATIONS APPROVED, NOT ACCEPTED
0
$0
1
$103,390
0
$0
0
$0
APPLICATIONS DENIED
1
$57,200
4
$114,760
1
$34,830
1
$31,090
APPLICATIONS WITHDRAWN
0
$0
3
$155,793
0
$0
0
$0
FILES CLOSED FOR INCOMPLETENESS
0
$0
0
$0
0
$0
0
$0
Aggregated Statistics For Year 2004 (Based on 2 partial tracts)
B) Conventional Home Purchase Loans
C) Refinancings
D) Home Improvement Loans
G) Loans On Manufactured Home Dwelling (A B C & D)
Number
Average Value
Number
Average Value
Number
Average Value
Number
Average Value
LOANS ORIGINATED
4
$124,908
7
$101,929
2
$42,630
1
$49,570
APPLICATIONS APPROVED, NOT ACCEPTED
0
$0
1
$129,990
0
$0
0
$0
APPLICATIONS DENIED
1
$57,760
4
$122,002
1
$21,650
0
$0
APPLICATIONS WITHDRAWN
0
$0
3
$134,743
0
$0
0
$0
FILES CLOSED FOR INCOMPLETENESS
0
$0
1
$112,890
0
$0
0
$0
Aggregated Statistics For Year 2003 (Based on 2 partial tracts)
B) Conventional Home Purchase Loans
C) Refinancings
D) Home Improvement Loans
Number
Average Value
Number
Average Value
Number
Average Value
LOANS ORIGINATED
3
$132,423
13
$113,571
1
$55,250
APPLICATIONS APPROVED, NOT ACCEPTED
0
$0
2
$80,540
0
$0
APPLICATIONS DENIED
0
$0
4
$89,575
0
$0
APPLICATIONS WITHDRAWN
0
$0
3
$106,263
0
$0
FILES CLOSED FOR INCOMPLETENESS
0
$0
0
$0
0
$0
Aggregated Statistics For Year 1999 (Based on 1 partial tract)

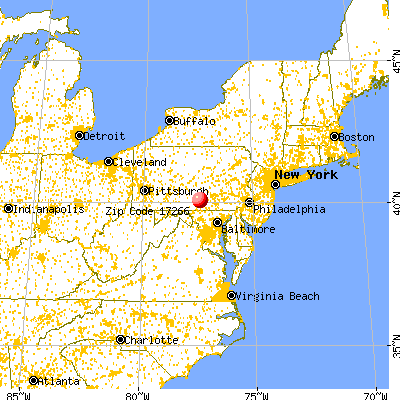


 Nearest zip codes: 17241, 17257, 17307, 17081, 17240, 17324.