Estimated zip code population in 2022: 6,377 Zip code population in 2010: 5,929 Zip code population in 2000: 5,654
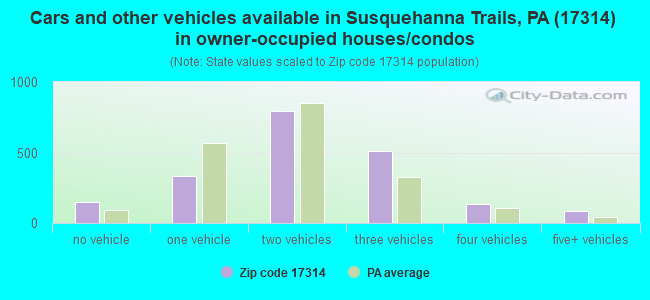
Houses and condos: 2,683 Renter-occupied apartments: 296
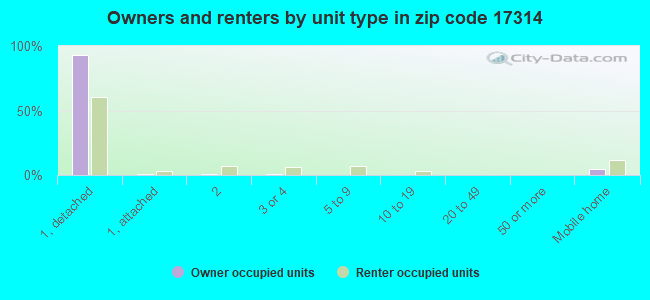
% of renters here:
13%
State:
31%
March 2022 cost of living index in zip code 17314: 92.4 (less than average, U.S. average is 100)
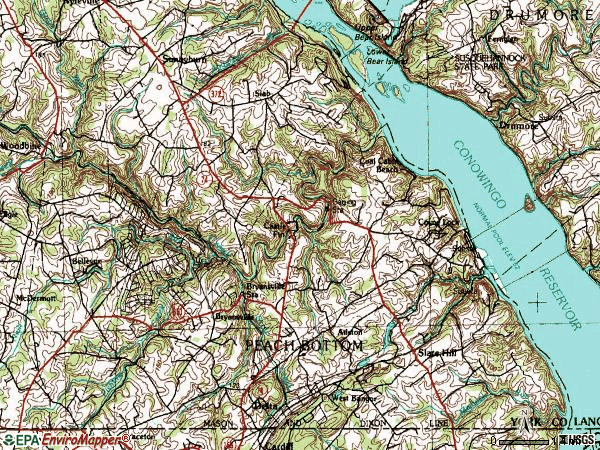
Land area: 35.5 sq. mi. Water area: 0.6 sq. mi.
Population density: 180 people per square mile
(very low).
OSM Map
General Map
Google Map
MSN Map
OSM Map
General Map
Google Map
MSN Map
OSM Map
General Map
Google Map
MSN Map
OSM Map
General Map
Google Map
MSN Map
Please wait while loading the map...
Real estate property taxes paid for housing units in 2022:
This zip code:
1.6% ($4,325)
Pennsylvania:
1.3% ($3,094)
Median real estate property taxes paid for housing units with mortgages in 2022: $4,366 (1.6%) Median real estate property taxes paid for housing units with no mortgage in 2022: $4,100 (1.6%)
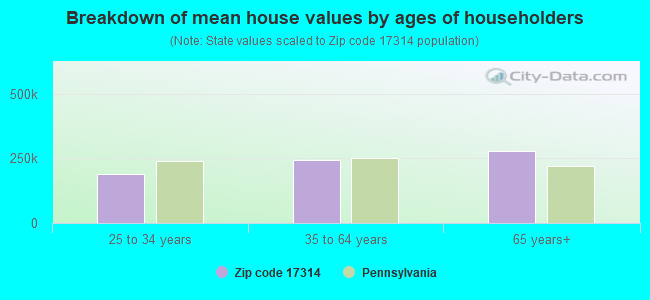
Estimated median house/condo value in 2022: $265,904
17314:
$265,904
Pennsylvania:
$245,500
According to our research of Pennsylvania and other state lists, there were 5 registered sex offenders living in 17314 zip code as of May 20, 2024. The ratio of all residents to sex offenders in zip code 17314 is 1,200 to 1. The ratio of registered sex offenders to all residents in this zip code is lower than the state average.
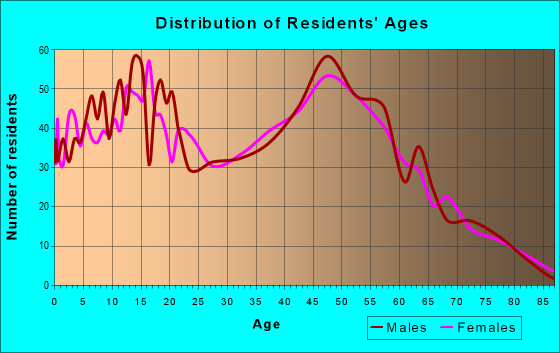
Median resident age:
This zip code:
41.7 years
Pennsylvania median age:
40.9 years
Average household size:
This zip code:
2.8 people
Pennsylvania:
2.4 people
Averages for the 2020 tax year for zip code 17314, filed in 2021:
Average Adjusted Gross Income (AGI) in 2020: $65,160 (Individual Income Tax Returns)
Here:
$65,160
State:
$75,707
Salary/wage: $60,023 (reported on 81.8% of returns)
Here:
$60,023
State:
$62,806
(% of AGI for various income ranges: 1083.9% for AGIs below $25k, 3674.7% for AGIs $25k-50k, 6630.6% for AGIs $50k-75k, 9694.4% for AGIs $75k-100k, 16920.0% for AGIs $100k-200k)
Taxable interest for individuals: $718 (reported on 27.6% of returns)
This zip code:
$718
Pennsylvania:
$1,633
(% of AGI for various income ranges: 16.7% for AGIs below $25k, 16.7% for AGIs $25k-50k, 29.4% for AGIs $50k-75k, 47.6% for AGIs $75k-100k, 38.3% for AGIs $100k-200k)
Ordinary dividends: $2,585 (reported on 16.4% of returns)
Here:
$2,585
State:
$7,382
(% of AGI for various income ranges: 25.5% for AGIs below $25k, 29.4% for AGIs $25k-50k, 62.1% for AGIs $50k-75k, 54.4% for AGIs $75k-100k, 103.4% for AGIs $100k-200k)
Net capital gain/loss in AGI: +$8,785 (reported on 14.3% of returns)
Here:
+$8,785
State:
+$23,522
(% of AGI for various income ranges: 18.4% for AGIs below $25k, 28.2% for AGIs $25k-50k, 46.2% for AGIs $50k-75k, 76.8% for AGIs $75k-100k, 329.1% for AGIs $100k-200k)
Profit/loss from business: +$9,818 (reported on 13.6% of returns)
Here:
+$9,818
State:
+$16,274
(% of AGI for various income ranges: 156.5% for AGIs below $25k, 160.0% for AGIs $25k-50k, 276.2% for AGIs $50k-75k, 322.0% for AGIs $75k-100k, 143.4% for AGIs $100k-200k)
Taxable individual retirement arrangement distribution: $14,254 (reported on 9.8% of returns)
17314:
$14,254
Pennsylvania:
$18,583
(% of AGI for various income ranges: 66.9% for AGIs below $25k, 76.7% for AGIs $25k-50k, 209.4% for AGIs $50k-75k, 393.2% for AGIs $75k-100k, 450.6% for AGIs $100k-200k)
Total itemized deductions: $24,367 (reported on 8.4% of returns)
Here:
$24,367
State:
$34,850
(% of AGI for various income ranges: 127.8% for AGIs $25k-50k, 180.6% for AGIs $50k-75k, 420.4% for AGIs $75k-100k, 729.1% for AGIs $100k-200k)
Charity contributions: $7,212 (reported on 5.6% of returns)
Here:
$7,212
State:
$12,392
(% of AGI for various income ranges: 18.4% for AGIs $25k-50k, 70.0% for AGIs $75k-100k, 167.7% for AGIs $100k-200k)
Taxes paid: $8,021 (reported on 8.4% of returns)
17314:
$8,021
State:
$8,200
(% of AGI for various income ranges: 32.4% for AGIs $25k-50k, 73.2% for AGIs $50k-75k, 153.6% for AGIs $75k-100k, 246.9% for AGIs $100k-200k)
Earned income credit: $2,074 (reported on 10.8% of returns)
Here:
$2,074
State:
$2,100
(% of AGI for various income ranges: 71.0% for AGIs below $25k, 57.8% for AGIs $25k-50k)
Percentage of individuals using paid preparers for their 2020 taxes: 94.1%
Here:
94%
State:
92%
(% for various income ranges: 93.1% for AGIs below $25k, 95.7% for AGIs $25k-50k, 92.0% for AGIs $50k-75k, 94.4% for AGIs $75k-100k, 94.3% for AGIs $100k-200k, 100.0% for AGIs over 200k)
Averages for the 2012 tax year for zip code 17314, filed in 2013:
Average Adjusted Gross Income (AGI) in 2012: $51,627 (Individual Income Tax Returns)
Here:
$51,627
State:
$61,346
Salary/wage: $48,329 (reported on 82.7% of returns)
Here:
$48,329
State:
$51,902
(% of AGI for various income ranges: 70.7% for AGIs below $25k, 75.4% for AGIs $25k-50k, 79.1% for AGIs $50k-75k, 85.3% for AGIs $75k-100k, 81.7% for AGIs $100k-200k, 39.9% for AGIs over 200k)
Taxable interest for individuals: $910 (reported on 32.7% of returns)
This zip code:
$910
Pennsylvania:
$1,588
(% of AGI for various income ranges: 1.2% for AGIs below $25k, 0.8% for AGIs $25k-50k, 0.5% for AGIs $50k-75k, 0.3% for AGIs $75k-100k, 0.5% for AGIs $100k-200k, 0.6% for AGIs over 200k)
Ordinary dividends: $2,150 (reported on 17.3% of returns)
Here:
$2,150
State:
$5,827
(% of AGI for various income ranges: 0.7% for AGIs below $25k, 0.8% for AGIs $25k-50k, 0.6% for AGIs $50k-75k, 0.3% for AGIs $75k-100k, 1.2% for AGIs $100k-200k)
Net capital gain/loss in AGI: +$3,019 (reported on 11.7% of returns)
Here:
+$3,019
State:
+$14,495
(% of AGI for various income ranges: 0.5% for AGIs below $25k, 0.7% for AGIs $25k-50k, 0.5% for AGIs $50k-75k, 0.2% for AGIs $75k-100k, 1.3% for AGIs $100k-200k)
Profit/loss from business: +$8,133 (reported on 13.5% of returns)
Here:
+$8,133
State:
+$16,268
(% of AGI for various income ranges: 7.0% for AGIs below $25k, 2.3% for AGIs $25k-50k, 1.3% for AGIs $50k-75k, 2.2% for AGIs $75k-100k, 1.7% for AGIs $100k-200k)
Taxable individual retirement arrangement distribution: $11,956 (reported on 10.2% of returns)
17314:
$11,956
Pennsylvania:
$14,550
(% of AGI for various income ranges: 2.7% for AGIs below $25k, 2.6% for AGIs $25k-50k, 2.5% for AGIs $50k-75k, 2.5% for AGIs $75k-100k, 2.4% for AGIs $100k-200k)
Total itemized deductions: $18,625 (23% of AGI, reported on 41.0% of returns)
Here:
$18,625
State:
$23,538
Here:
23.4% of AGI
State:
18.4% of AGI
(% of AGI for various income ranges: 10.7% for AGIs below $25k, 12.5% for AGIs $25k-50k, 15.3% for AGIs $50k-75k, 16.3% for AGIs $75k-100k, 16.2% for AGIs $100k-200k, 12.9% for AGIs over 200k)
Charity contributions: $2,453 (reported on 30.5% of returns)
Here:
$2,453
State:
$4,025
(% of AGI for various income ranges: 0.6% for AGIs below $25k, 1.1% for AGIs $25k-50k, 1.4% for AGIs $50k-75k, 1.3% for AGIs $75k-100k, 2.0% for AGIs $100k-200k, 1.5% for AGIs over 200k)
Taxes paid: $7,462 (reported on 40.6% of returns)
17314:
$7,462
State:
$9,982
(% of AGI for various income ranges: 3.4% for AGIs below $25k, 4.0% for AGIs $25k-50k, 5.7% for AGIs $50k-75k, 6.6% for AGIs $75k-100k, 7.2% for AGIs $100k-200k, 6.0% for AGIs over 200k)
Earned income credit: $1,849 (reported on 13.2% of returns)
Here:
$1,849
State:
$2,106
(% of AGI for various income ranges: 4.3% for AGIs below $25k, 0.7% for AGIs $25k-50k)
Percentage of individuals using paid preparers for their 2012 taxes: 58.6%
Here:
59%
State:
53%
(% for various income ranges: 54.7% for AGIs below $25k, 61.7% for AGIs $25k-50k, 60.0% for AGIs $50k-75k, 62.5% for AGIs $75k-100k, 58.1% for AGIs $100k-200k, 66.7% for AGIs over 200k)
Averages for the 2004 tax year for zip code 17314, filed in 2005:
Average Adjusted Gross Income (AGI) in 2004: $43,352 (Individual Income Tax Returns)
Here:
$43,352
State:
$48,049
Salary/wage: $40,456 (reported on 85.5% of returns)
Here:
$40,456
State:
$42,646
(% of AGI for various income ranges: 125.7% for AGIs below $10k, 66.6% for AGIs $10k-25k, 82.5% for AGIs $25k-50k, 87.2% for AGIs $50k-75k, 87.1% for AGIs $75k-100k, 62.2% for AGIs over 100k)
Taxable interest for individuals: $1,086 (reported on 44.6% of returns)
This zip code:
$1,086
Pennsylvania:
$1,657
(% of AGI for various income ranges: 7.2% for AGIs below $10k, 1.8% for AGIs $10k-25k, 1.1% for AGIs $25k-50k, 0.4% for AGIs $50k-75k, 0.6% for AGIs $75k-100k, 1.9% for AGIs over 100k)
Taxable dividends: $2,617 (reported on 18.8% of returns)
Here:
$2,617
State:
$3,566
(% of AGI for various income ranges: 3.0% for AGIs below $10k, 1.2% for AGIs $10k-25k, 0.4% for AGIs $25k-50k, 0.5% for AGIs $50k-75k, 0.5% for AGIs $75k-100k, 3.3% for AGIs over 100k)
Net capital gain/loss: +$9,724 (reported on 13.1% of returns)
Here:
+$9,724
State:
+$9,716
(% of AGI for various income ranges: 2.4% for AGIs below $10k, 0.8% for AGIs $10k-25k, 0.5% for AGIs $25k-50k, 0.4% for AGIs $50k-75k, 0.4% for AGIs $75k-100k, 12.5% for AGIs over 100k)
Profit/loss from business: +$11,556 (reported on 14.9% of returns)
Here:
+$11,556
State:
+$14,267
(% of AGI for various income ranges: 10.8% for AGIs below $10k, 9.8% for AGIs $10k-25k, 3.0% for AGIs $25k-50k, 2.3% for AGIs $50k-75k, 3.7% for AGIs $75k-100k, 5.1% for AGIs over 100k)
Profit/loss from farming: +$5,896 (reported on 2.7% of returns)
Here:
+$5,896
State:
+$274
(% of AGI for various income ranges: 3.4% for AGIs below $10k, 1.7% for AGIs $10k-25k, 0.8% for AGIs $25k-50k, -0.0% for AGIs $75k-100k)
IRA payment deduction: $2,855 (reported on 2.7% of returns)
17314:
$2,855
Pennsylvania:
$2,903
(% of AGI for various income ranges: 0.4% for AGIs $10k-25k, 0.2% for AGIs $25k-50k, 0.2% for AGIs $50k-75k, 0.2% for AGIs over 100k)
Total itemized deductions: $15,297 (22% of AGI, reported on 38.8% of returns)
Here:
$15,297
State:
$18,804
Here:
22.5% of AGI
State:
19.5% of AGI
(% of AGI for various income ranges: 7.8% for AGIs below $10k, 9.7% for AGIs $10k-25k, 13.5% for AGIs $25k-50k, 15.1% for AGIs $50k-75k, 15.6% for AGIs $75k-100k, 12.0% for AGIs over 100k)
Charity contributions deductions: $2,192 (3% of AGI, reported on 32.4% of returns)
Here:
$2,192
State:
$3,337
Here:
3.1% of AGI
State:
3.3% of AGI
(% of AGI for various income ranges: 0.5% for AGIs $10k-25k, 1.2% for AGIs $25k-50k, 1.6% for AGIs $50k-75k, 1.8% for AGIs $75k-100k, 2.6% for AGIs over 100k)
Total tax: $5,095 (reported on 79.2% of returns)
17314:
$5,095
State:
$8,008
(% of AGI for various income ranges: 3.9% for AGIs below $10k, 4.8% for AGIs $10k-25k, 7.1% for AGIs $25k-50k, 7.9% for AGIs $50k-75k, 10.2% for AGIs $75k-100k, 15.0% for AGIs over 100k)
Earned income credit: $1,583 (reported on 10.6% of returns)
Here:
$1,583
State:
$1,643
Percentage of individuals using paid preparers for their 2004 taxes: 65.6%
Here:
66%
State:
56%
(% for various income ranges: 54.4% for AGIs below $10k, 70.1% for AGIs $10k-25k, 68.6% for AGIs $25k-50k, 66.9% for AGIs $50k-75k, 63.3% for AGIs $75k-100k, 67.5% for AGIs over 100k)
Likely homosexual households (counted as self-reported same-sex unmarried-partner households)
Lesbian couples: 1.8% of all households
Gay men: 0.1% of all households
Household received Food Stamps/SNAP in the past 12 months: 248 Household did not receive Food Stamps/SNAP in the past 12 months: 2,053
Women who had a birth in the past 12 months: 88 (77 now married, 13 unmarried) Women who did not have a birth in the past 12 months: 1,188 (490 now married, 697 unmarried)
Housing units in zip code 17314 with a mortgage: 1,341 (220 second mortgage, 192 both second mortgage and home equity loan) Houses without a mortgage: 8
Median monthly owner costs for units with a mortgage: $1,706 Median monthly owner costs for units without a mortgage: $716
Residents with income below the poverty level in 2022:
This zip code:
5.5%
Whole state:
11.8%
Residents with income below 50% of the poverty level in 2022:
This zip code:
3.1%
Whole state:
6.1%
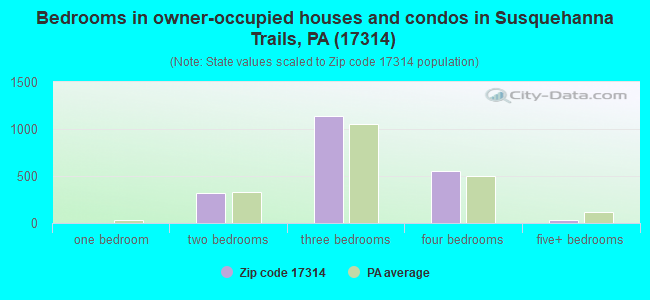
Median number of rooms in houses and condos:
Here:
6.6
State:
6.8
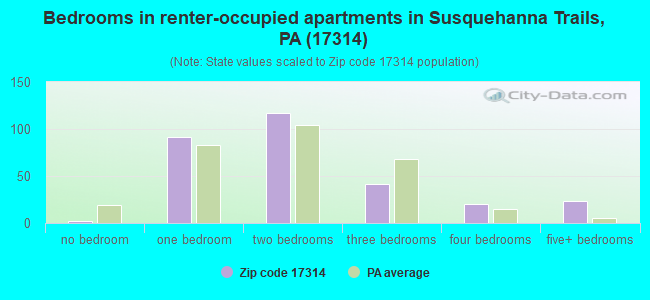
Median number of rooms in apartments:
Here:
3.8
State:
4.3
Notable locations in this zip code not listed on our city pages
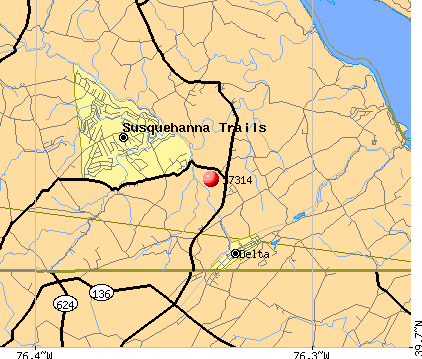
Notable locations in zip code 17314: Bryansville Station (A), Castle Fin Station (B), Coal Cabin Beach (C), Muddy Creek Forks (D), Delta Cardiff Volunteer Fire Company Station 57 (E). Display/hide their locations on the map
Churches in zip code 17314 include: Union Chapel (A), Mount Nebo Church (B), Salem Church (C), Slateville Church (D), Bryansville Church (E). Display/hide their locations on the map
Size of family households: 663 2-persons, 434 3-persons, 278 4-persons, 215 5-persons, 31 6-persons, 69 7-or-more-persons
Size of nonfamily households: 528 1-person, 67 2-persons, 2 7-or-more-persons
1,110 married couples with children.
136 single-parent households (81 men, 55 women).
91.8% of residents of 17314 zip code speak English at home.
0.4% of residents speak Spanish at home (18% very well, 14% well, 68% not at all).
7.3% of residents speak other Indo-European language at home (46% very well, 36% well, 15% not well, 3% not at all).
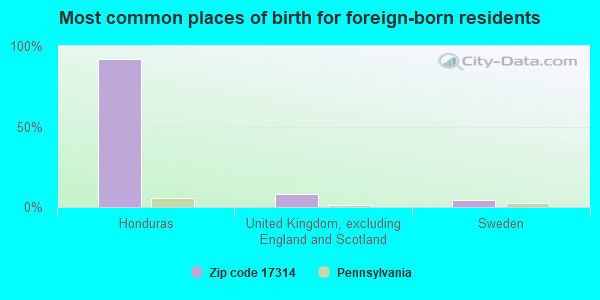
Foreign born population: 24 (0.4%) (0.0% of them are naturalized citizens)
:
0.4%
Whole state:
7.5%
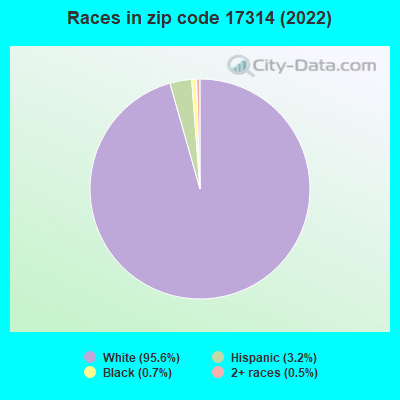
92%Honduras
8%United Kingdom, excluding England and Scotland
4%Sweden
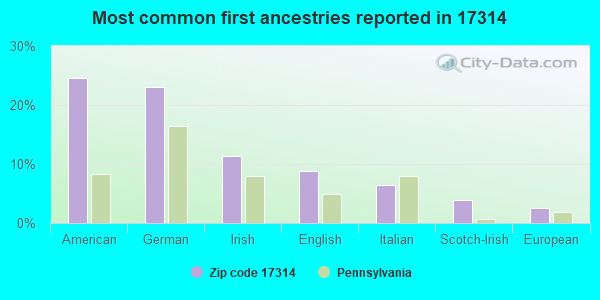
24%American
23%German
13%Irish
11%English
5%Italian
2%Austrian
2%European
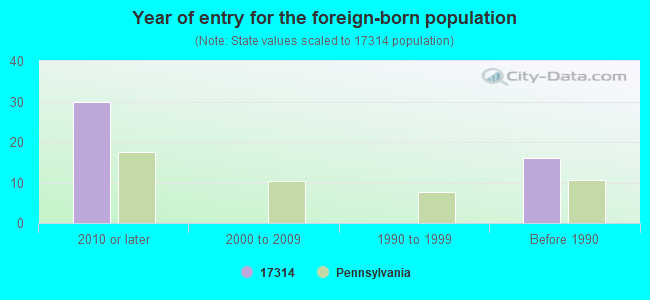
Year of entry for the foreign-born population
302010 or later
02000 to 2009
01990 to 1999
16Before 1990
Housing units lacking complete plumbing facilities: 2.8% Housing units lacking complete kitchen facilities: 3.2%
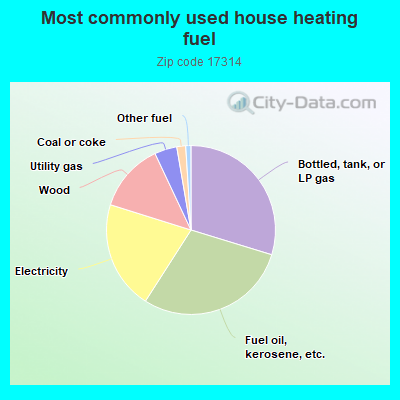
29.8%Bottled, tank, or LP gas
29.4%Fuel oil, kerosene, etc.
20.8%Electricity
13.2%Wood
4.3%Utility gas
1.7%Coal or coke
1.0%Other fuel
Population in 1990: 4,910. Population change in the 1990s: +744 (+15.2%).
Place of birth for U.S.-born residents:
This state: 2,527
Northeast: 203
Midwest: 135
South: 3,511
West: 24
63% of the 17314 zip code residents lived in the same house 5 years ago. Out of people who lived in different houses, 36% lived in this county. Out of people who lived in different counties, 50% lived in Pennsylvania.
95% of the 17314 zip code residents lived in the same house 1 year ago. Out of people who lived in different houses, 50% moved from this county. Out of people who lived in different houses, 19% moved from different county within same state. Out of people who lived in different houses, 37% moved from different state.
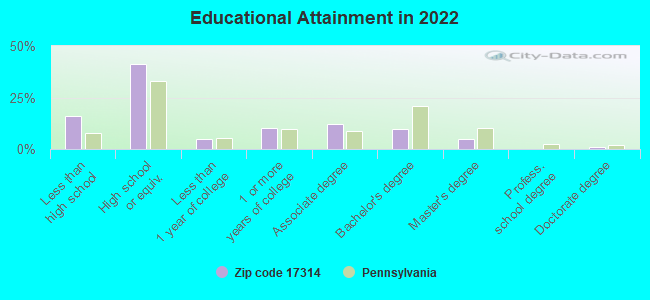
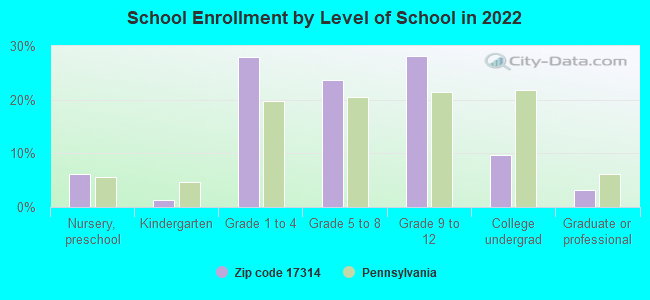
Private vs. public school enrollment:
Students in private schools in grades 1 to 8 (elementary and middle school): 158
Here:
23.2%
Pennsylvania:
15.7%
Students in private schools in grades 9 to 12 (high school): 50
Here:
13.7%
Pennsylvania:
13.4%
Students in private undergraduate colleges: 88
Here:
69.7%
Pennsylvania:
39.8%
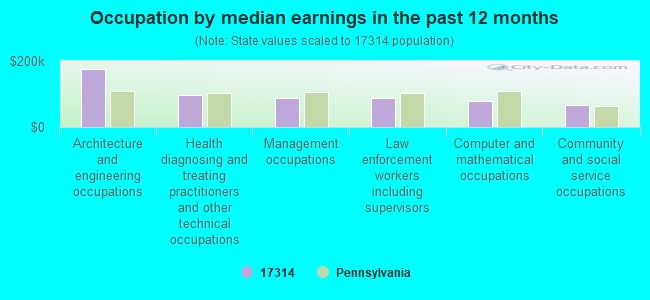
Occupation by median earnings in the past 12 months ($)
176,327Architecture and engineering occupations
96,589Health diagnosing and treating practitioners and other technical occupations
87,877Management occupations
86,599Law enforcement workers including supervisors
80,269Computer and mathematical occupations
66,637Community and social service occupations
Companies with federal contracts located in this zip code (DELTA, PA):
NORTHEAST MARYLAND OFFICIALS A (537 MILLER ROAD; small business) : $79,744 in 14 contractsfrom 2002 to 2005
Contracts for Recreational Services, Other Professional Services by Army Signed by year:2000: $0; 2001: $0; 2002: $15,709; 2003: $28,356; 2004: $27,096; 2005: $8,583; 2006: $0.
Biggest contracts:
$13,950 with Army for Recreational Services. Taking place in MD. Signed on 2004-09-24. Completion date: 2004-11-30.
$13,770 with Army for Recreational Services. Signed on 2003-09-02. Completion date: 2003-11-20.
$8,646 with Army for Other Professional Services. Taking place in MD. Signed on 2004-01-08. Completion date: 2004-08-31.
$8,646, same as above.Signed on 2003-03-25. Completion date: 2003-08-30.
SUSQUEHANNA ORCHARDS INC (560 ORCHARD RD; small business) : $28,598 in 8 contractsin 2005
Contracts for Fruits and Vegetables by Defense Logistics Agency Signed by year:2000: $0; 2001: $0; 2002: $0; 2003: $0; 2004: $0; 2005: $28,598; 2006: $0.
Biggest contracts:
$4,725 with Defense Logistics Agency for Fruits and Vegetables. Signed on 2005-08-10. Completion date: 2005-08-10.
$3,938, same as above.Signed on 2005-09-01. Completion date: 2005-09-01.
$3,763, same as above.Signed on 2005-08-20. Completion date: 2005-08-20.
$3,588, same as above.Signed on 2005-08-26. Completion date: 2005-08-26.
LAURA MIRANDA (592 COLD CABIN RD; small business) : $19,300 in 3 contractsin 2002
$15,900 with Army for Other Professional Services. Taking place in MD. Signed on 2002-08-07. Completion date: 2003-08-30.
$3,400, same as above.Signed on 2002-07-10. Completion date: 2002-08-30.
$0, same as above.Signed on 2002-07-10. Completion date: 2002-08-30.
DELTA GAS, INC (209 DOOLEY RD; small business)
$10,000 with Army for Gases: Compressed and Liquefied. Signed on 2006-03-10. Completion date: 2007-03-09.
CCS BUILDING SVCS (57 WATSON RD; small business) : $6,600 in 2 contractsin 2004
$3,400 with Army for Custodial Janitorial Services. Taking place in MD. Signed on 2004-01-15. Completion date: 2004-09-30.
$3,200 with Army for Maintenance, Repair and Rebuilding of Equipment -- Miscellaneous. Taking place in MD. Signed on 2004-12-08. Completion date: 2004-11-15.
Top industries in this zip code by the number of employees in 2005:
Utilities: Nuclear Electric Power Generation (500-999 employees: 1 establishment)
Administrative and Support and Waste Management and Remediation Services: Security Guards and Patrol Services (100-249: 1)
Accommodation and Food Services: Limited-Service Restaurants (20-49: 1, 1-4: 2)
Accommodation and Food Services: Full-Service Restaurants (20-49: 1)
Construction: Highway, Street, and Bridge Construction (20-49: 1)
Accommodation and Food Services: Hotels (except Casino Hotels) and Motels (20-49: 1)
Other Services (except Public Administration): Religious Organizations (10-19: 1, 5-9: 1, 1-4: 3)
Health Care and Social Assistance: Child Day Care Services (10-19: 1, 1-4: 2)
People in group quarters in 2000:
24 people in homes for the mentally ill
Fatal accident statistics in 2010:
Fatal accident count: 1
Vehicles involved in fatal accidents: 1
Fatal accidents caused by drunken drivers: 1
Fatalities: 1
Persons involved in fatal accidents: 1
Pedestrians involved in fatal accidents: 0
Home Mortgage Disclosure Act Aggregated Statistics For Year 2009 (Based on 4 partial tracts)
A) FHA, FSA/RHS & VA Home Purchase Loans
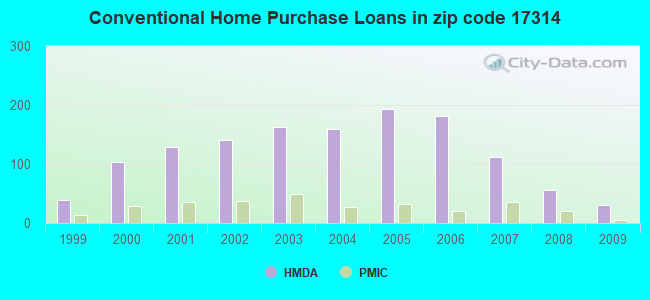
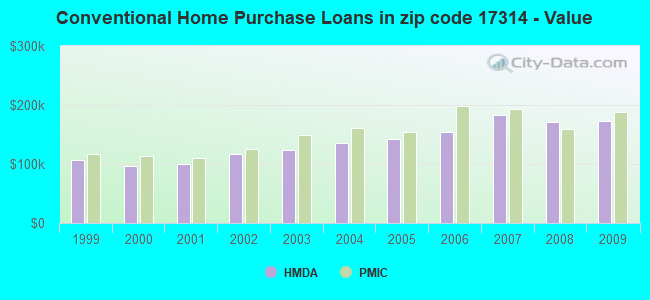
B) Conventional Home Purchase Loans
C) Refinancings
D) Home Improvement Loans
F) Non-occupant Loans on < 5 Family Dwellings (A B C & D)
G) Loans On Manufactured Home Dwelling (A B C & D)
Number
Average Value
Number
Average Value
Number
Average Value
Number
Average Value
Number
Average Value
Number
Average Value
LOANS ORIGINATED
43
$181,400
30
$172,827
257
$178,721
21
$46,459
12
$141,430
10
$93,699
APPLICATIONS APPROVED, NOT ACCEPTED
2
$272,870
3
$131,877
33
$169,748
2
$13,490
1
$39,690
1
$129,160
APPLICATIONS DENIED
9
$184,281
4
$204,455
101
$182,108
15
$62,662
2
$75,475
3
$118,857
APPLICATIONS WITHDRAWN
2
$246,490
3
$139,220
72
$193,237
2
$35,260
0
$0
1
$69,480
FILES CLOSED FOR INCOMPLETENESS
0
$0
0
$0
13
$216,287
2
$106,315
1
$157,820
0
$0
Aggregated Statistics For Year 2008 (Based on 4 partial tracts)
A) FHA, FSA/RHS & VA Home Purchase Loans
B) Conventional Home Purchase Loans
C) Refinancings
D) Home Improvement Loans
E) Loans on Dwellings For 5+ Families
F) Non-occupant Loans on < 5 Family Dwellings (A B C & D)
G) Loans On Manufactured Home Dwelling (A B C & D)
Number
Average Value
Number
Average Value
Number
Average Value
Number
Average Value
Number
Average Value
Number
Average Value
Number
Average Value
LOANS ORIGINATED
34
$204,723
56
$171,999
212
$171,919
31
$55,467
0
$0
20
$151,710
9
$94,639
APPLICATIONS APPROVED, NOT ACCEPTED
4
$143,168
2
$329,305
29
$152,853
5
$40,036
0
$0
0
$0
0
$0
APPLICATIONS DENIED
1
$246,180
13
$136,809
169
$193,840
42
$63,143
0
$0
7
$79,573
10
$85,945
APPLICATIONS WITHDRAWN
4
$203,018
7
$210,901
64
$187,019
3
$107,410
1
$465,880
0
$0
0
$0
FILES CLOSED FOR INCOMPLETENESS
2
$223,965
3
$163,890
20
$155,954
2
$52,180
0
$0
2
$145,530
0
$0
Aggregated Statistics For Year 2007 (Based on 4 partial tracts)
A) FHA, FSA/RHS & VA Home Purchase Loans
B) Conventional Home Purchase Loans
C) Refinancings
D) Home Improvement Loans
E) Loans on Dwellings For 5+ Families
F) Non-occupant Loans on < 5 Family Dwellings (A B C & D)
G) Loans On Manufactured Home Dwelling (A B C & D)
Number
Average Value
Number
Average Value
Number
Average Value
Number
Average Value
Number
Average Value
Number
Average Value
Number
Average Value
LOANS ORIGINATED
20
$183,276
112
$182,839
258
$151,402
64
$70,525
1
$130,410
17
$126,386
14
$110,719
APPLICATIONS APPROVED, NOT ACCEPTED
1
$126,630
13
$160,835
60
$157,530
9
$55,637
0
$0
5
$136,034
2
$87,005
APPLICATIONS DENIED
3
$150,603
22
$146,619
205
$169,068
51
$89,703
0
$0
8
$112,170
11
$66,781
APPLICATIONS WITHDRAWN
4
$179,638
13
$225,421
109
$172,223
10
$71,676
0
$0
1
$370,050
2
$74,180
FILES CLOSED FOR INCOMPLETENESS
0
$0
4
$261,340
31
$217,764
2
$134,955
0
$0
0
$0
0
$0
Aggregated Statistics For Year 2006 (Based on 4 partial tracts)
A) FHA, FSA/RHS & VA Home Purchase Loans
B) Conventional Home Purchase Loans
C) Refinancings
D) Home Improvement Loans
F) Non-occupant Loans on < 5 Family Dwellings (A B C & D)
G) Loans On Manufactured Home Dwelling (A B C & D)
Number
Average Value
Number
Average Value
Number
Average Value
Number
Average Value
Number
Average Value
Number
Average Value
LOANS ORIGINATED
14
$163,583
181
$154,778
290
$146,026
77
$59,956
29
$133,392
31
$94,080
APPLICATIONS APPROVED, NOT ACCEPTED
1
$126,170
16
$157,372
54
$142,342
16
$51,662
2
$87,755
1
$47,110
APPLICATIONS DENIED
1
$102,210
33
$148,115
191
$150,835
48
$62,841
4
$135,060
9
$100,882
APPLICATIONS WITHDRAWN
2
$125,670
23
$123,139
158
$150,030
11
$74,789
1
$13,230
2
$97,870
FILES CLOSED FOR INCOMPLETENESS
0
$0
5
$136,274
37
$150,066
1
$23,630
0
$0
0
$0
Aggregated Statistics For Year 2005 (Based on 4 partial tracts)
A) FHA, FSA/RHS & VA Home Purchase Loans
B) Conventional Home Purchase Loans
C) Refinancings
D) Home Improvement Loans
F) Non-occupant Loans on < 5 Family Dwellings (A B C & D)
G) Loans On Manufactured Home Dwelling (A B C & D)
Number
Average Value
Number
Average Value
Number
Average Value
Number
Average Value
Number
Average Value
Number
Average Value
LOANS ORIGINATED
11
$172,203
194
$142,029
328
$146,345
55
$72,183
31
$103,022
23
$96,938
APPLICATIONS APPROVED, NOT ACCEPTED
2
$143,265
21
$164,654
56
$127,153
7
$49,699
3
$99,837
6
$76,518
APPLICATIONS DENIED
2
$193,980
43
$138,520
225
$139,085
40
$47,974
6
$89,222
12
$74,978
APPLICATIONS WITHDRAWN
2
$193,265
27
$191,781
200
$164,708
23
$149,780
2
$178,960
6
$108,855
FILES CLOSED FOR INCOMPLETENESS
0
$0
7
$175,770
26
$181,887
3
$52,990
2
$149,310
1
$132,300
Aggregated Statistics For Year 2004 (Based on 4 partial tracts)
A) FHA, FSA/RHS & VA Home Purchase Loans
B) Conventional Home Purchase Loans
C) Refinancings
D) Home Improvement Loans
F) Non-occupant Loans on < 5 Family Dwellings (A B C & D)
G) Loans On Manufactured Home Dwelling (A B C & D)
Number
Average Value
Number
Average Value
Number
Average Value
Number
Average Value
Number
Average Value
Number
Average Value
LOANS ORIGINATED
19
$142,584
159
$135,446
353
$124,551
56
$46,437
15
$79,939
20
$89,387
APPLICATIONS APPROVED, NOT ACCEPTED
1
$192,450
22
$124,736
70
$104,750
9
$38,511
1
$69,530
4
$71,618
APPLICATIONS DENIED
1
$200,680
36
$111,125
211
$126,025
45
$42,434
6
$57,730
12
$69,986
APPLICATIONS WITHDRAWN
3
$157,543
21
$133,702
158
$127,232
7
$122,183
1
$93,970
3
$82,753
FILES CLOSED FOR INCOMPLETENESS
0
$0
2
$73,950
47
$138,138
5
$48,256
0
$0
0
$0
Aggregated Statistics For Year 2003 (Based on 4 partial tracts)
A) FHA, FSA/RHS & VA Home Purchase Loans
B) Conventional Home Purchase Loans
C) Refinancings
D) Home Improvement Loans
F) Non-occupant Loans on < 5 Family Dwellings (A B C & D)
Number
Average Value
Number
Average Value
Number
Average Value
Number
Average Value
Number
Average Value
LOANS ORIGINATED
31
$125,075
162
$124,323
549
$111,890
39
$34,414
24
$83,260
APPLICATIONS APPROVED, NOT ACCEPTED
1
$56,020
13
$118,748
94
$106,406
8
$23,396
2
$71,465
APPLICATIONS DENIED
4
$113,650
20
$118,660
173
$111,114
26
$24,285
4
$135,372
APPLICATIONS WITHDRAWN
1
$93,550
18
$99,505
137
$116,807
3
$31,323
7
$88,290
FILES CLOSED FOR INCOMPLETENESS
0
$0
3
$140,923
21
$108,575
0
$0
1
$54,810
Aggregated Statistics For Year 2002 (Based on 4 partial tracts)
A) FHA, FSA/RHS & VA Home Purchase Loans
B) Conventional Home Purchase Loans
C) Refinancings
D) Home Improvement Loans
E) Loans on Dwellings For 5+ Families
F) Non-occupant Loans on < 5 Family Dwellings (A B C & D)
Number
Average Value
Number
Average Value
Number
Average Value
Number
Average Value
Number
Average Value
Number
Average Value
LOANS ORIGINATED
31
$116,956
140
$116,554
363
$102,476
47
$33,470
0
$0
8
$53,976
APPLICATIONS APPROVED, NOT ACCEPTED
2
$137,975
21
$108,056
79
$93,084
5
$20,124
0
$0
2
$71,655
APPLICATIONS DENIED
0
$0
17
$73,078
170
$98,512
21
$20,981
0
$0
0
$0
APPLICATIONS WITHDRAWN
2
$93,080
6
$94,610
105
$98,459
7
$26,483
1
$47,250
1
$59,910
FILES CLOSED FOR INCOMPLETENESS
2
$80,640
4
$113,915
31
$100,391
0
$0
0
$0
1
$84,560
Aggregated Statistics For Year 2001 (Based on 4 partial tracts)
A) FHA, FSA/RHS & VA Home Purchase Loans
B) Conventional Home Purchase Loans
C) Refinancings
D) Home Improvement Loans
F) Non-occupant Loans on < 5 Family Dwellings (A B C & D)
Number
Average Value
Number
Average Value
Number
Average Value
Number
Average Value
Number
Average Value
LOANS ORIGINATED
33
$110,995
128
$100,492
287
$97,071
47
$26,574
8
$69,171
APPLICATIONS APPROVED, NOT ACCEPTED
1
$130,410
14
$85,389
45
$89,143
11
$75,002
2
$143,520
APPLICATIONS DENIED
1
$81,120
27
$88,719
170
$86,440
19
$17,332
3
$97,060
APPLICATIONS WITHDRAWN
3
$135,810
7
$133,981
78
$103,726
10
$26,325
2
$82,215
FILES CLOSED FOR INCOMPLETENESS
1
$134,780
2
$181,440
17
$85,264
1
$42,520
0
$0
Aggregated Statistics For Year 2000 (Based on 4 partial tracts)
A) FHA, FSA/RHS & VA Home Purchase Loans
B) Conventional Home Purchase Loans
C) Refinancings
D) Home Improvement Loans
F) Non-occupant Loans on < 5 Family Dwellings (A B C & D)
Number
Average Value
Number
Average Value
Number
Average Value
Number
Average Value
Number
Average Value
LOANS ORIGINATED
28
$98,886
103
$96,047
111
$81,352
55
$20,500
4
$26,610
APPLICATIONS APPROVED, NOT ACCEPTED
2
$106,190
15
$88,832
39
$91,531
18
$37,082
1
$194,870
APPLICATIONS DENIED
2
$53,675
33
$69,943
127
$76,055
28
$21,322
4
$65,912
APPLICATIONS WITHDRAWN
5
$92,726
10
$131,091
58
$83,952
7
$23,230
2
$17,660
FILES CLOSED FOR INCOMPLETENESS
0
$0
0
$0
12
$90,768
1
$19,420
0
$0
Aggregated Statistics For Year 1999 (Based on 1 partial tract)
A) FHA, FSA/RHS & VA Home Purchase Loans
B) Conventional Home Purchase Loans
C) Refinancings
D) Home Improvement Loans
F) Non-occupant Loans on < 5 Family Dwellings (A B C & D)
Detailed PMIC statistics for the following Tracts:0237.20
, 0240.00
2002 - 2018 National Fire Incident Reporting System (NFIRS) incidents
Based on the data from the years 2002 - 2018 the average number of fires per year is 36. The highest number of fires - 83 took place in 2005, and the least - 3 in 2014. The data has a declining trend.
When looking into fire subcategories, the most incidents belonged to: Structure Fires (57.0%), and Outside Fires (32.1%).
Fire incident types reported to NFIRS in Zip Code 17314
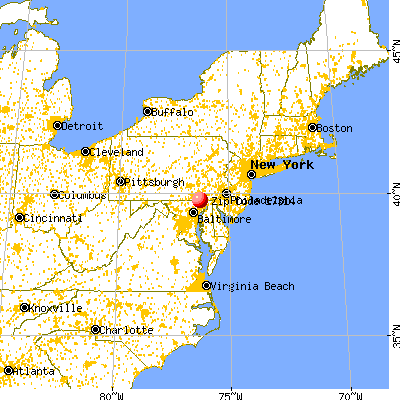


 Nearest zip codes: 21160, 17518, 21154, 17302, 17532, 17321.


 : $79,744 in 14 contracts from 2002 to 2005
 Based on the data from the years 2002 - 2018 the average number of fires per year is 36. The highest number of fires - 83 took place in 2005, and the least - 3 in 2014. The data has a declining trend.
 When looking into fire subcategories, the most incidents belonged to: Structure Fires (57.0%), and Outside Fires (32.1%).