Estimated zip code population in 2022: 3,845 Zip code population in 2010: 4,101 Zip code population in 2000: 3,690
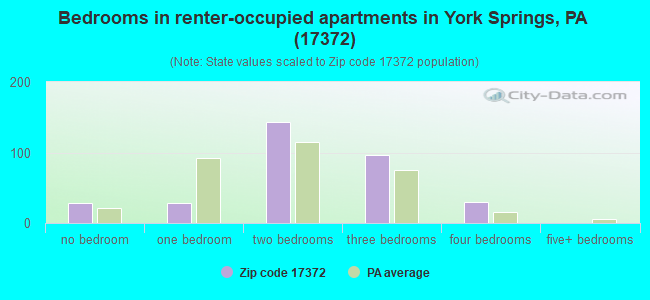
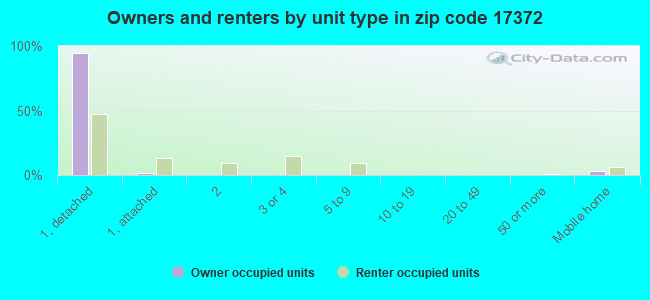
Houses and condos: 1,598 Renter-occupied apartments: 327
% of renters here:
21%
State:
31%
March 2022 cost of living index in zip code 17372: 93.8 (less than average, U.S. average is 100)
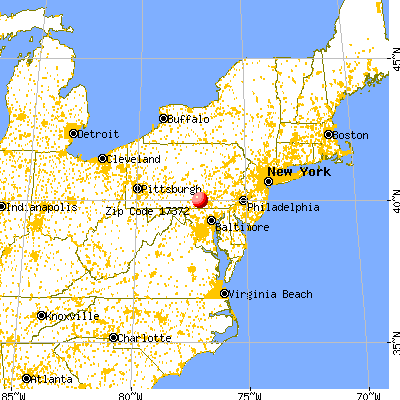
Land area: 32.7 sq. mi. Water area: 0.1 sq. mi.
Population density: 118 people per square mile
(very low).
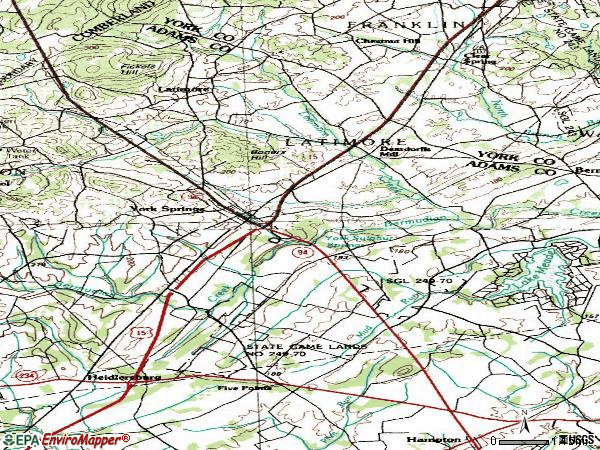
OSM Map
General Map
Google Map
MSN Map
OSM Map
General Map
Google Map
MSN Map
OSM Map
General Map
Google Map
MSN Map
OSM Map
General Map
Google Map
MSN Map
Please wait while loading the map...
Real estate property taxes paid for housing units in 2022:
This zip code:
1.2% ($3,142)
Pennsylvania:
1.3% ($3,094)
Median real estate property taxes paid for housing units with mortgages in 2022: $3,227 (1.2%) Median real estate property taxes paid for housing units with no mortgage in 2022: $3,020 (1.2%)
Business Search- 14 Million verified businesses
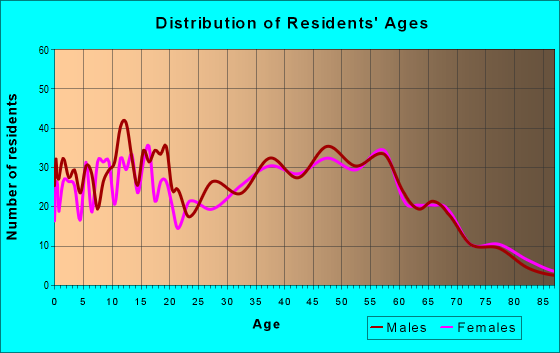
Males: 1,946
(50.6%)
Females: 1,899
(49.4%)
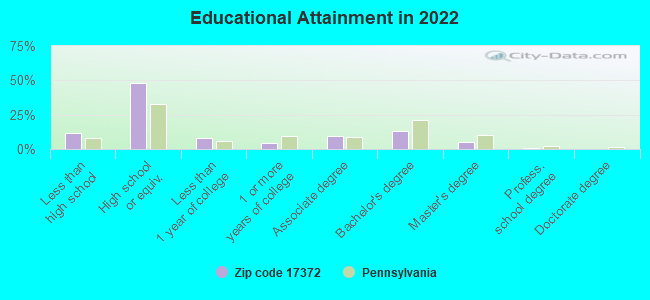
For population 25 years and over in 17372:
High school or higher: 87.8%
Bachelor's degree or higher: 18.3%
Graduate or professional degree: 5.6%
Unemployed: 3.1%
Mean travel time to work (commute): 31.4 minutes
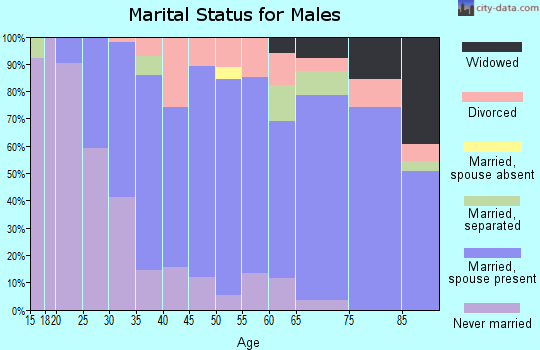
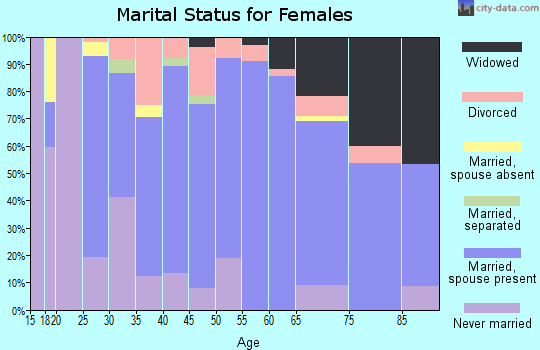
For population 15 years and over in 17372:
Never married: 25.4%
Now married: 61.1%
Separated: 2.1%
Widowed: 4.2%
Divorced: 7.3%
Zip code 17372 compared to state average:
Black race population percentage significantly below state average.
Hispanic race population percentage above state average.
Median age above state average.
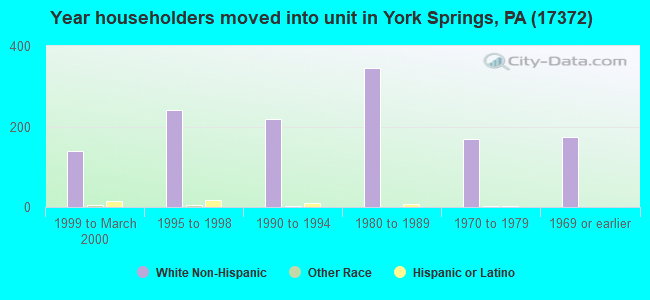
Length of stay since moving in significantly above state average.
Percentage of population with a bachelor's degree or higher below state average.
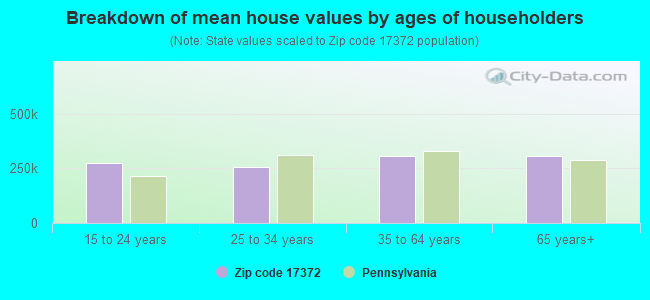
Estimated median house/condo value in 2022: $259,392
17372:
$259,392
Pennsylvania:
$245,500
According to our research of Pennsylvania and other state lists, there were 5 registered sex offenders living in 17372 zip code as of May 20, 2024. The ratio of all residents to sex offenders in zip code 17372 is 880 to 1. The ratio of registered sex offenders to all residents in this zip code is lower than the state average.
Median resident age:
This zip code:
45.5 years
Pennsylvania median age:
40.9 years
Average household size:
This zip code:
2.5 people
Pennsylvania:
2.4 people
Averages for the 2020 tax year for zip code 17372, filed in 2021:
Average Adjusted Gross Income (AGI) in 2020: $63,680 (Individual Income Tax Returns)
Here:
$63,680
State:
$75,707
Salary/wage: $53,465 (reported on 83.9% of returns)
Here:
$53,465
State:
$62,806
(% of AGI for various income ranges: 1268.8% for AGIs below $25k, 3782.4% for AGIs $25k-50k, 6591.2% for AGIs $50k-75k, 9541.2% for AGIs $75k-100k, 16791.0% for AGIs $100k-200k)
Taxable interest for individuals: $1,221 (reported on 29.0% of returns)
This zip code:
$1,221
Pennsylvania:
$1,633
(% of AGI for various income ranges: 11.6% for AGIs below $25k, 17.4% for AGIs $25k-50k, 32.4% for AGIs $50k-75k, 65.3% for AGIs $75k-100k, 72.4% for AGIs $100k-200k)
Ordinary dividends: $2,411 (reported on 17.5% of returns)
Here:
$2,411
State:
$7,382
(% of AGI for various income ranges: 13.3% for AGIs below $25k, 31.9% for AGIs $25k-50k, 30.4% for AGIs $50k-75k, 54.1% for AGIs $75k-100k, 98.1% for AGIs $100k-200k)
Net capital gain/loss in AGI: +$11,433 (reported on 13.8% of returns)
Here:
+$11,433
State:
+$23,522
(% of AGI for various income ranges: 7.7% for AGIs below $25k, 35.2% for AGIs $25k-50k, 64.4% for AGIs $50k-75k, 277.6% for AGIs $75k-100k, 306.7% for AGIs $100k-200k)
Profit/loss from business: +$13,792 (reported on 11.5% of returns)
Here:
+$13,792
State:
+$16,274
(% of AGI for various income ranges: 96.7% for AGIs below $25k, 129.5% for AGIs $25k-50k, 167.2% for AGIs $50k-75k, 312.9% for AGIs $75k-100k, 732.4% for AGIs $100k-200k)
Taxable individual retirement arrangement distribution: $14,710 (reported on 9.7% of returns)
17372:
$14,710
Pennsylvania:
$18,583
(% of AGI for various income ranges: 64.4% for AGIs below $25k, 98.1% for AGIs $25k-50k, 216.4% for AGIs $50k-75k, 297.1% for AGIs $75k-100k, 644.8% for AGIs $100k-200k)
Total itemized deductions: $31,982 (reported on 5.1% of returns)
Here:
$31,982
State:
$34,850
(% of AGI for various income ranges: 223.3% for AGIs $25k-50k, 337.1% for AGIs $75k-100k, 955.7% for AGIs $100k-200k)
Charity contributions: $9,150 (reported on 3.7% of returns)
Here:
$9,150
State:
$12,392
(% of AGI for various income ranges: 70.8% for AGIs $50k-75k, 264.3% for AGIs $100k-200k)
Taxes paid: $8,009 (reported on 5.1% of returns)
17372:
$8,009
State:
$8,200
(% of AGI for various income ranges: 59.0% for AGIs $25k-50k, 97.6% for AGIs $75k-100k, 222.4% for AGIs $100k-200k)
Earned income credit: $1,941 (reported on 10.1% of returns)
Here:
$1,941
State:
$2,100
(% of AGI for various income ranges: 49.3% for AGIs below $25k, 51.2% for AGIs $25k-50k)
Percentage of individuals using paid preparers for their 2020 taxes: 93.5%
Here:
94%
State:
92%
(% for various income ranges: 91.9% for AGIs below $25k, 94.5% for AGIs $25k-50k, 94.3% for AGIs $50k-75k, 96.0% for AGIs $75k-100k, 91.4% for AGIs $100k-200k, 100.0% for AGIs over 200k)
Averages for the 2012 tax year for zip code 17372, filed in 2013:
Average Adjusted Gross Income (AGI) in 2012: $52,500 (Individual Income Tax Returns)
Here:
$52,500
State:
$61,346
Salary/wage: $44,726 (reported on 85.6% of returns)
Here:
$44,726
State:
$51,902
(% of AGI for various income ranges: 73.3% for AGIs below $25k, 78.8% for AGIs $25k-50k, 76.1% for AGIs $50k-75k, 82.8% for AGIs $75k-100k, 80.1% for AGIs $100k-200k, 28.5% for AGIs over 200k)
Taxable interest for individuals: $997 (reported on 36.3% of returns)
This zip code:
$997
Pennsylvania:
$1,588
(% of AGI for various income ranges: 0.9% for AGIs below $25k, 1.0% for AGIs $25k-50k, 0.5% for AGIs $50k-75k, 0.3% for AGIs $75k-100k, 0.4% for AGIs $100k-200k, 1.5% for AGIs over 200k)
Ordinary dividends: $1,962 (reported on 19.4% of returns)
Here:
$1,962
State:
$5,827
(% of AGI for various income ranges: 1.4% for AGIs below $25k, 0.6% for AGIs $25k-50k, 0.4% for AGIs $50k-75k, 0.4% for AGIs $75k-100k, 1.4% for AGIs $100k-200k)
Net capital gain/loss in AGI: +$3,271 (reported on 11.9% of returns)
Here:
+$3,271
State:
+$14,495
(% of AGI for various income ranges: 0.2% for AGIs below $25k, 0.2% for AGIs $25k-50k, 1.2% for AGIs $75k-100k, 1.9% for AGIs $100k-200k)
Profit/loss from business: +$8,704 (reported on 13.9% of returns)
Here:
+$8,704
State:
+$16,268
(% of AGI for various income ranges: 6.4% for AGIs below $25k, 2.9% for AGIs $25k-50k, 2.9% for AGIs $50k-75k, 2.3% for AGIs $75k-100k, 1.3% for AGIs $100k-200k)
Taxable individual retirement arrangement distribution: $12,645 (reported on 10.0% of returns)
17372:
$12,645
Pennsylvania:
$14,550
(% of AGI for various income ranges: 3.4% for AGIs below $25k, 2.2% for AGIs $25k-50k, 4.2% for AGIs $50k-75k, 3.6% for AGIs $100k-200k)
Total itemized deductions: $19,851 (21% of AGI, reported on 33.3% of returns)
Here:
$19,851
State:
$23,538
Here:
21.3% of AGI
State:
18.4% of AGI
(% of AGI for various income ranges: 9.0% for AGIs below $25k, 10.0% for AGIs $25k-50k, 12.8% for AGIs $50k-75k, 13.8% for AGIs $75k-100k, 15.2% for AGIs $100k-200k, 11.0% for AGIs over 200k)
Charity contributions: $4,394 (reported on 23.9% of returns)
Here:
$4,394
State:
$4,025
(% of AGI for various income ranges: 0.9% for AGIs below $25k, 0.6% for AGIs $25k-50k, 1.4% for AGIs $50k-75k, 1.7% for AGIs $75k-100k, 2.2% for AGIs $100k-200k, 5.7% for AGIs over 200k)
Taxes paid: $7,088 (reported on 33.3% of returns)
17372:
$7,088
State:
$9,982
(% of AGI for various income ranges: 1.7% for AGIs below $25k, 2.6% for AGIs $25k-50k, 4.3% for AGIs $50k-75k, 5.6% for AGIs $75k-100k, 6.4% for AGIs $100k-200k, 3.8% for AGIs over 200k)
Earned income credit: $1,919 (reported on 12.9% of returns)
Here:
$1,919
State:
$2,106
(% of AGI for various income ranges: 4.1% for AGIs below $25k, 0.9% for AGIs $25k-50k)
Percentage of individuals using paid preparers for their 2012 taxes: 57.2%
Here:
57%
State:
53%
(% for various income ranges: 54.3% for AGIs below $25k, 57.7% for AGIs $25k-50k, 60.6% for AGIs $50k-75k, 54.5% for AGIs $75k-100k, 59.1% for AGIs $100k-200k, 100.0% for AGIs over 200k)
Averages for the 2004 tax year for zip code 17372, filed in 2005:
Average Adjusted Gross Income (AGI) in 2004: $42,276 (Individual Income Tax Returns)
Here:
$42,276
State:
$48,049
Salary/wage: $39,258 (reported on 87.3% of returns)
Here:
$39,258
State:
$42,646
(% of AGI for various income ranges: 117.9% for AGIs below $10k, 73.9% for AGIs $10k-25k, 83.6% for AGIs $25k-50k, 86.0% for AGIs $50k-75k, 85.2% for AGIs $75k-100k, 67.9% for AGIs over 100k)
Taxable interest for individuals: $1,249 (reported on 53.7% of returns)
This zip code:
$1,249
Pennsylvania:
$1,657
(% of AGI for various income ranges: 8.5% for AGIs below $10k, 2.2% for AGIs $10k-25k, 1.6% for AGIs $25k-50k, 0.6% for AGIs $50k-75k, 0.7% for AGIs $75k-100k, 3.0% for AGIs over 100k)
Taxable dividends: $1,435 (reported on 24.2% of returns)
Here:
$1,435
State:
$3,566
(% of AGI for various income ranges: 4.1% for AGIs below $10k, 1.5% for AGIs $10k-25k, 0.3% for AGIs $25k-50k, 0.8% for AGIs $50k-75k, 0.6% for AGIs $75k-100k, 1.2% for AGIs over 100k)
Net capital gain/loss: +$4,345 (reported on 15.4% of returns)
Here:
+$4,345
State:
+$9,716
(% of AGI for various income ranges: -1.6% for AGIs below $10k, 0.3% for AGIs $10k-25k, 0.5% for AGIs $25k-50k, 0.1% for AGIs $50k-75k, 1.4% for AGIs $75k-100k, 5.9% for AGIs over 100k)
Profit/loss from business: +$9,059 (reported on 15.5% of returns)
Here:
+$9,059
State:
+$14,267
(% of AGI for various income ranges: 11.8% for AGIs below $10k, 7.3% for AGIs $10k-25k, 3.9% for AGIs $25k-50k, 3.8% for AGIs $50k-75k, 2.5% for AGIs $75k-100k, 0.4% for AGIs over 100k)
IRA payment deduction: $2,852 (reported on 2.9% of returns)
17372:
$2,852
Pennsylvania:
$2,903
Total itemized deductions: $15,735 (23% of AGI, reported on 33.4% of returns)
Here:
$15,735
State:
$18,804
Here:
22.8% of AGI
State:
19.5% of AGI
(% of AGI for various income ranges: 18.1% for AGIs below $10k, 7.2% for AGIs $10k-25k, 9.9% for AGIs $25k-50k, 13.0% for AGIs $50k-75k, 14.6% for AGIs $75k-100k, 14.3% for AGIs over 100k)
Charity contributions deductions: $3,245 (4% of AGI, reported on 28.2% of returns)
Here:
$3,245
State:
$3,337
Here:
4.5% of AGI
State:
3.3% of AGI
(% of AGI for various income ranges: 0.9% for AGIs below $10k, 0.8% for AGIs $10k-25k, 1.1% for AGIs $25k-50k, 1.7% for AGIs $50k-75k, 2.6% for AGIs $75k-100k, 4.3% for AGIs over 100k)
Total tax: $5,278 (reported on 77.2% of returns)
17372:
$5,278
State:
$8,008
(% of AGI for various income ranges: 4.1% for AGIs below $10k, 4.8% for AGIs $10k-25k, 6.9% for AGIs $25k-50k, 8.6% for AGIs $50k-75k, 10.2% for AGIs $75k-100k, 16.4% for AGIs over 100k)
Earned income credit: $1,532 (reported on 11.0% of returns)
Here:
$1,532
State:
$1,643
Percentage of individuals using paid preparers for their 2004 taxes: 55.7%
Here:
56%
State:
56%
(% for various income ranges: 49.3% for AGIs below $10k, 54.4% for AGIs $10k-25k, 57.6% for AGIs $25k-50k, 59.0% for AGIs $50k-75k, 55.2% for AGIs $75k-100k, 62.0% for AGIs over 100k)
Household received Food Stamps/SNAP in the past 12 months: 88 Household did not receive Food Stamps/SNAP in the past 12 months: 1,432
Women who had a birth in the past 12 months: 30 (8 now married, 19 unmarried) Women who did not have a birth in the past 12 months: 760 (360 now married, 397 unmarried)
Housing units in zip code 17372 with a mortgage: 785 (100 second mortgage, 98 both second mortgage and home equity loan) Houses without a mortgage: 91
Median monthly owner costs for units with a mortgage: $1,578 Median monthly owner costs for units without a mortgage: $608
Residents with income below the poverty level in 2022:
This zip code:
9.4%
Whole state:
11.8%
Residents with income below 50% of the poverty level in 2022:
This zip code:
2.3%
Whole state:
6.1%
Median number of rooms in houses and condos:
Here:
6.8
State:
6.8
Median number of rooms in apartments:
Here:
4.7
State:
4.3
Notable locations in this zip code not listed on our city pages
In group quarters: 18 (-1 institutionalized population)
Size of family households: 555 2-persons, 209 3-persons, 144 4-persons, 46 5-persons, 39 6-persons, 24 7-or-more-persons
Size of nonfamily households: 386 1-person, 125 2-persons
595 married couples with children.
141 single-parent households (50 men, 91 women).
85.1% of residents of 17372 zip code speak English at home.
14.6% of residents speak Spanish at home (47% very well, 24% well, 28% not well, 1% not at all).
0.8% of residents speak other Indo-European language at home (48% very well, 52% not at all).
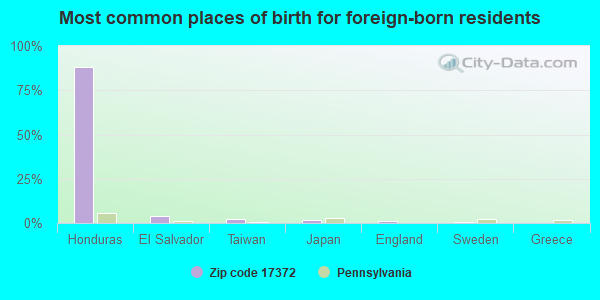
Foreign born population: 399 (10.4%) (51.9% of them are naturalized citizens)
This zip code:
10.4%
Whole state:
7.5%
88%Honduras
4%El Salvador
3%Taiwan
2%Japan
1%England
1%Sweden
0%Greece
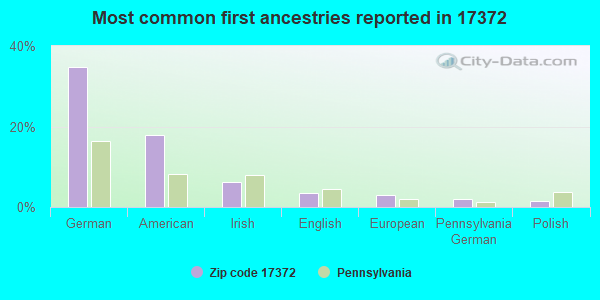
35%German
18%American
6%Irish
3%English
3%European
2%Pennsylvania German
1%Polish
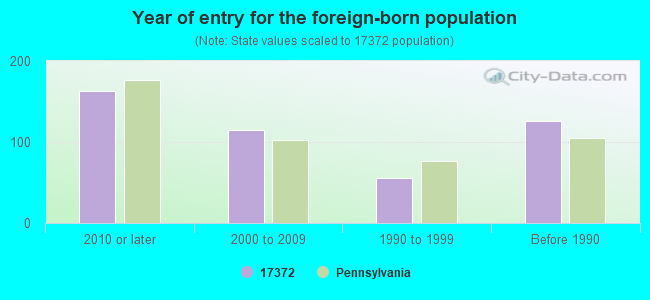
Year of entry for the foreign-born population
1632010 or later
1152000 to 2009
561990 to 1999
126Before 1990
Facilities with environmental interests located in this zip code:
BERMUDIAN SPRINGS HIGH SCH (7335 CARLISLE PIKE in YORK SPRINGS, PA)
COMPLIANCE ACTIVITY (Tracking inspections of insecticide, fungicide, and rodenticide, and toxic substances) STATE MASTER (Pennsylvania database) - PWSID-7010353, DRINKING WATER PROGRAM National Pollutant Discharge Elimination System NON-MAJOR (Tracking pollutant discharge elimination systems) - permit Business SIC classification: ELEMENTARY AND SECONDARY SCHOOLS Organizations: BERMUDIAN SPRINGS SCHOOL DISTRICT (CONTACT/OWNER)
Alternative names: BERMUDIAN SPRINGS S.D., BERMUDIAN SPRINGS SCHOOL DIST
BERMUDIAN SPRINGS EL SCH ( in YORK SPRINGS, PA)
(National Center for Education Statistics) - STATE ID-7302 Organizations: BERMUDIAN SPRINGS SD (SCHOOL DISTRICT)
BERMUDIAN SPRINGS HS ( in YORK SPRINGS, PA)
(National Center for Education Statistics) - STATE ID-0003 Organizations: BERMUDIAN SPRINGS SD (SCHOOL DISTRICT)
BERMUDIAN SPRINGS MS ( in YORK SPRINGS, PA)
(National Center for Education Statistics) - STATE ID-6921 Organizations: BERMUDIAN SPRINGS SD (SCHOOL DISTRICT)
Housing units lacking complete kitchen facilities: 0.3%
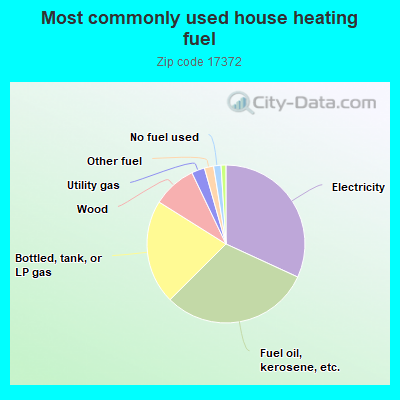
31.9%Electricity
30.7%Fuel oil, kerosene, etc.
21.4%Bottled, tank, or LP gas
9.0%Wood
2.7%Utility gas
1.9%Other fuel
1.5%No fuel used
1.0%Coal or coke
Population in 1990: 3,042. Population change in the 1990s: +648 (+21.3%).
Place of birth for U.S.-born residents:
This state: 2,671
Northeast: 196
Midwest: 91
South: 349
West: 72
70% of the 17372 zip code residents lived in the same house 5 years ago. Out of people who lived in different houses, 54% lived in this county. Out of people who lived in different counties, 50% lived in Pennsylvania.
94% of the 17372 zip code residents lived in the same house 1 year ago. Out of people who lived in different houses, 39% moved from this county. Out of people who lived in different houses, 39% moved from different county within same state. Out of people who lived in different houses, 19% moved from different state. Out of people who lived in different houses, 4% moved from abroad.
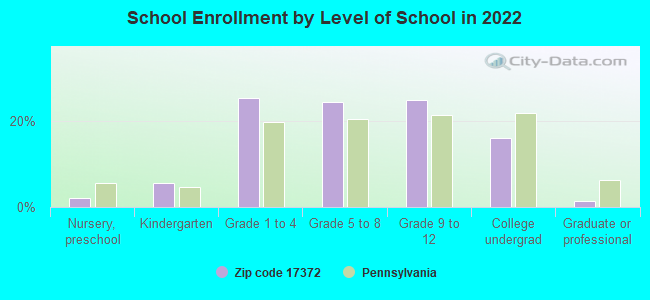
Private vs. public school enrollment:
Students in private schools in grades 1 to 8 (elementary and middle school): 7
Here:
1.9%
Pennsylvania:
15.7%
Students in private schools in grades 9 to 12 (high school): 4
Here:
2.5%
Pennsylvania:
13.4%
Students in private undergraduate colleges: 5
Here:
4.1%
Pennsylvania:
39.8%
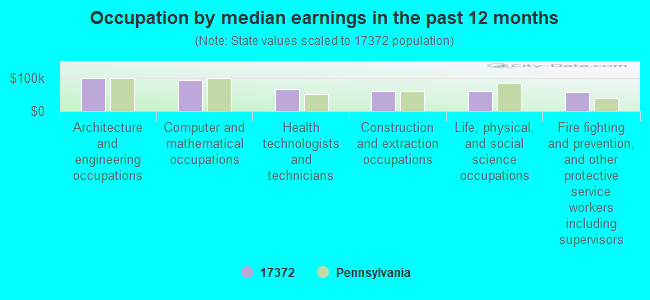
Occupation by median earnings in the past 12 months ($)
97,857Architecture and engineering occupations
92,709Computer and mathematical occupations
65,916Health technologists and technicians
60,006Construction and extraction occupations
59,141Life, physical, and social science occupations
56,829Fire fighting and prevention, and other protective service workers including supervisors
Top industries in this zip code by the number of employees in 2005:
Construction: Commercial and Institutional Building Construction (20-49 employees: 1 establishment)
Other Services (except Public Administration): Religious Organizations (5-9: 1, 1-4: 7)
Construction: New Single-Family Housing Construction (except Operative Builders) (5-9: 2, 1-4: 1)
Wholesale Trade: Petroleum Bulk Stations and Terminals (10-19: 1)
Wholesale Trade: Other Farm Product Raw Material Merchant Wholesalers (10-19: 1)
Other Services (except Public Administration): General Automotive Repair (5-9: 1)
People in group quarters in 2000:
41 people in nursing homes
5 people in agriculture workers' dormitories on farms
Fatal accident statistics in 2011:
Fatal accident count: 1
Vehicles involved in fatal accidents: 1
Fatal accidents caused by drunken drivers: 0
Fatalities: 1
Persons involved in fatal accidents: 5
Pedestrians involved in fatal accidents: 0
2003 - 2018 National Fire Incident Reporting System (NFIRS) incidents
Based on the data from the years 2003 - 2018 the average number of fires per year is 17. The highest number of fires - 63 took place in 2016, and the least - 1 in 2003. The data has a rising trend.
When looking into fire subcategories, the most incidents belonged to: Structure Fires (63.7%), and Outside Fires (17.8%).
Fire incident types reported to NFIRS in Zip Code 17372


 Nearest zip codes: 17316, 17350, 17007, 17019, 17304, 17324.
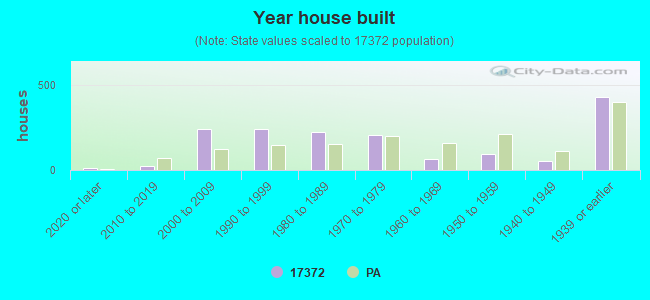


 Based on the data from the years 2003 - 2018 the average number of fires per year is 17. The highest number of fires - 63 took place in 2016, and the least - 1 in 2003. The data has a rising trend.
 When looking into fire subcategories, the most incidents belonged to: Structure Fires (63.7%), and Outside Fires (17.8%).