Estimated zip code population in 2022: 5,061 Zip code population in 2010: 4,664 Zip code population in 2000: 4,661
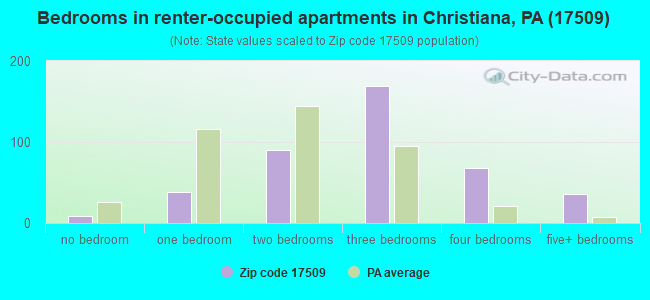
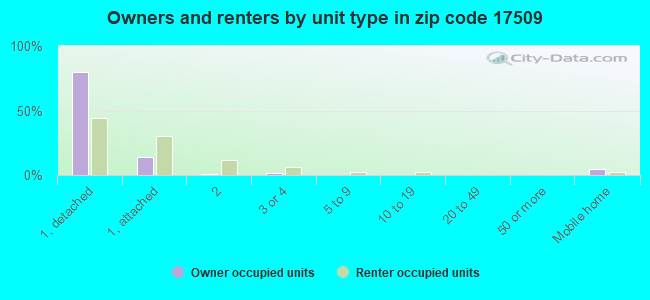
Houses and condos: 1,454 Renter-occupied apartments: 421
% of renters here:
30%
State:
31%
March 2022 cost of living index in zip code 17509: 93.9 (less than average, U.S. average is 100)
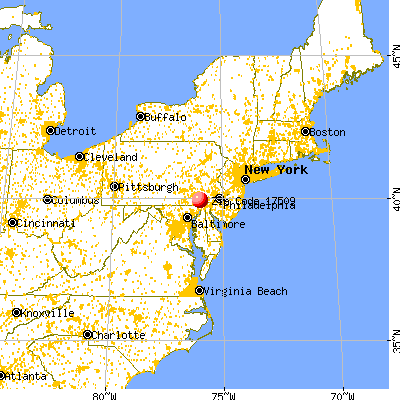
Land area: 25.8 sq. mi. Water area: 0.1 sq. mi.
Population density: 196 people per square mile
(very low).
OSM Map
General Map
Google Map
MSN Map
OSM Map
General Map
Google Map
MSN Map
OSM Map
General Map
Google Map
MSN Map
OSM Map
General Map
Google Map
MSN Map
Please wait while loading the map...
Real estate property taxes paid for housing units in 2022:
This zip code:
1.4% ($4,282)
Pennsylvania:
1.3% ($3,094)
Median real estate property taxes paid for housing units with mortgages in 2022: $4,524 (1.4%) Median real estate property taxes paid for housing units with no mortgage in 2022: $3,811 (1.4%)
Business Search- 14 Million verified businesses
Males: 2,458
(48.6%)
Females: 2,602
(51.4%)
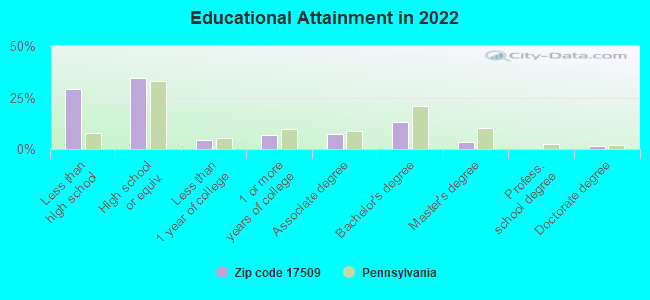
For population 25 years and over in 17509:
High school or higher: 67.9%
Bachelor's degree or higher: 17.2%
Graduate or professional degree: 4.9%
Unemployed: 2.3%
Mean travel time to work (commute): 24.7 minutes
For population 15 years and over in 17509:
Never married: 30.7%
Now married: 58.4%
Separated: 1.3%
Widowed: 5.1%
Divorced: 4.6%
Zip code 17509 compared to state average:
Unemployed percentage below state average.
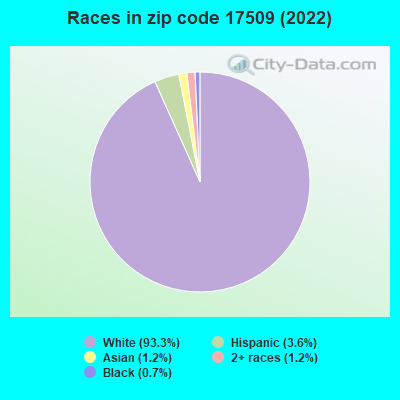
Black race population percentage significantly below state average.
Hispanic race population percentage below state average.
Median age significantly below state average.
Foreign-born population percentage significantly below state average.
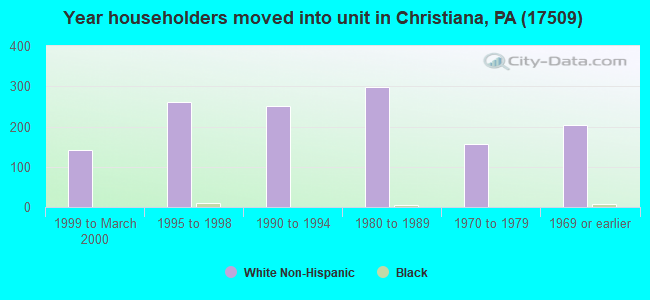
Length of stay since moving in above state average.
Number of college students below state average.
Percentage of population with a bachelor's degree or higher significantly below state average.
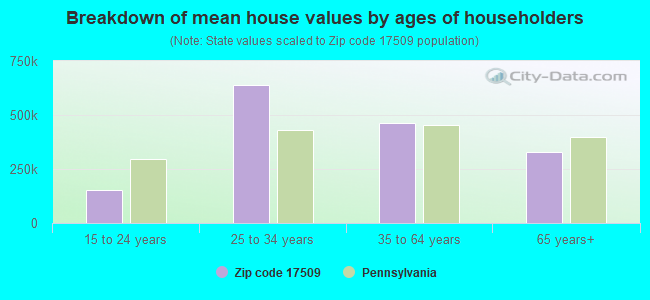
Estimated median house/condo value in 2022: $304,976
17509:
$304,976
Pennsylvania:
$245,500
According to our research of Pennsylvania and other state lists, there were 5 registered sex offenders living in 17509 zip code as of May 22, 2024. The ratio of all residents to sex offenders in zip code 17509 is 1,002 to 1. The ratio of registered sex offenders to all residents in this zip code is lower than the state average.
Median resident age:
This zip code:
27.5 years
Pennsylvania median age:
40.9 years
Average household size:
This zip code:
3.5 people
Pennsylvania:
2.4 people
Averages for the 2020 tax year for zip code 17509, filed in 2021:
Average Adjusted Gross Income (AGI) in 2020: $64,503 (Individual Income Tax Returns)
Here:
$64,503
State:
$75,707
Salary/wage: $46,561 (reported on 74.8% of returns)
Here:
$46,561
State:
$62,806
(% of AGI for various income ranges: 1514.6% for AGIs below $25k, 5133.9% for AGIs $25k-50k, 8233.9% for AGIs $50k-75k, 10715.5% for AGIs $75k-100k, 15983.8% for AGIs $100k-200k)
Taxable interest for individuals: $1,964 (reported on 32.5% of returns)
This zip code:
$1,964
Pennsylvania:
$1,633
(% of AGI for various income ranges: 56.4% for AGIs below $25k, 60.4% for AGIs $25k-50k, 124.4% for AGIs $50k-75k, 115.5% for AGIs $75k-100k, 103.8% for AGIs $100k-200k)
Ordinary dividends: $8,473 (reported on 12.6% of returns)
Here:
$8,473
State:
$7,382
(% of AGI for various income ranges: 28.9% for AGIs below $25k, 53.6% for AGIs $25k-50k, 99.4% for AGIs $50k-75k, 68.2% for AGIs $75k-100k, 198.5% for AGIs $100k-200k)
Net capital gain/loss in AGI: +$20,344 (reported on 15.5% of returns)
Here:
+$20,344
State:
+$23,522
(% of AGI for various income ranges: 30.7% for AGIs below $25k, 106.4% for AGIs $25k-50k, 173.9% for AGIs $50k-75k, 504.5% for AGIs $75k-100k, 546.2% for AGIs $100k-200k)
Profit/loss from business: +$26,472 (reported on 26.2% of returns)
Here:
+$26,472
State:
+$16,274
(% of AGI for various income ranges: 349.3% for AGIs below $25k, 348.9% for AGIs $25k-50k, 687.8% for AGIs $50k-75k, 1279.1% for AGIs $75k-100k, 3139.2% for AGIs $100k-200k)
Taxable individual retirement arrangement distribution: $14,700 (reported on 8.3% of returns)
17509:
$14,700
Pennsylvania:
$18,583
(% of AGI for various income ranges: 88.9% for AGIs below $25k, 108.2% for AGIs $25k-50k, 311.7% for AGIs $50k-75k, 1066.2% for AGIs $100k-200k)
Total itemized deductions: $33,627 (reported on 7.3% of returns)
Here:
$33,627
State:
$34,850
(% of AGI for various income ranges: 262.1% for AGIs $25k-50k, 584.4% for AGIs $50k-75k, 1239.2% for AGIs $100k-200k)
Charity contributions: $15,255 (reported on 5.3% of returns)
Here:
$15,255
State:
$12,392
(% of AGI for various income ranges: 102.2% for AGIs $50k-75k, 285.4% for AGIs $100k-200k)
Taxes paid: $7,007 (reported on 7.3% of returns)
17509:
$7,007
State:
$8,200
(% of AGI for various income ranges: 43.9% for AGIs $25k-50k, 147.2% for AGIs $50k-75k, 321.5% for AGIs $100k-200k)
Earned income credit: $2,112 (reported on 7.8% of returns)
Here:
$2,112
State:
$2,100
(% of AGI for various income ranges: 62.5% for AGIs below $25k, 58.2% for AGIs $25k-50k)
Percentage of individuals using paid preparers for their 2020 taxes: 92.7%
Here:
93%
State:
92%
(% for various income ranges: 90.5% for AGIs below $25k, 92.7% for AGIs $25k-50k, 94.4% for AGIs $50k-75k, 95.2% for AGIs $75k-100k, 91.7% for AGIs $100k-200k, 100.0% for AGIs over 200k)
Averages for the 2012 tax year for zip code 17509, filed in 2013:
Average Adjusted Gross Income (AGI) in 2012: $49,419 (Individual Income Tax Returns)
Here:
$49,419
State:
$61,346
Salary/wage: $39,716 (reported on 78.3% of returns)
Here:
$39,716
State:
$51,902
(% of AGI for various income ranges: 71.4% for AGIs below $25k, 70.9% for AGIs $25k-50k, 67.6% for AGIs $50k-75k, 69.6% for AGIs $75k-100k, 69.1% for AGIs $100k-200k, 27.0% for AGIs over 200k)
Taxable interest for individuals: $1,781 (reported on 36.0% of returns)
This zip code:
$1,781
Pennsylvania:
$1,588
(% of AGI for various income ranges: 3.0% for AGIs below $25k, 1.3% for AGIs $25k-50k, 0.8% for AGIs $50k-75k, 0.8% for AGIs $75k-100k, 0.7% for AGIs $100k-200k, 2.2% for AGIs over 200k)
Ordinary dividends: $3,114 (reported on 15.3% of returns)
Here:
$3,114
State:
$5,827
(% of AGI for various income ranges: 1.3% for AGIs below $25k, 0.7% for AGIs $25k-50k, 0.2% for AGIs $50k-75k, 0.5% for AGIs $75k-100k, 0.7% for AGIs $100k-200k, 2.8% for AGIs over 200k)
Net capital gain/loss in AGI: +$9,244 (reported on 14.3% of returns)
Here:
+$9,244
State:
+$14,495
(% of AGI for various income ranges: 2.0% for AGIs below $25k, 2.0% for AGIs $25k-50k, 2.5% for AGIs $50k-75k, 2.0% for AGIs $75k-100k, 6.3% for AGIs $100k-200k)
Profit/loss from business: +$19,800 (reported on 23.8% of returns)
Here:
+$19,800
State:
+$16,268
(% of AGI for various income ranges: 12.4% for AGIs below $25k, 8.2% for AGIs $25k-50k, 7.6% for AGIs $50k-75k, 9.1% for AGIs $75k-100k, 18.5% for AGIs $100k-200k)
Taxable individual retirement arrangement distribution: $10,759 (reported on 9.0% of returns)
17509:
$10,759
Pennsylvania:
$14,550
(% of AGI for various income ranges: 2.2% for AGIs below $25k, 1.9% for AGIs $25k-50k, 1.9% for AGIs $50k-75k, 2.8% for AGIs $75k-100k, 2.6% for AGIs $100k-200k)
Total itemized deductions: $22,909 (23% of AGI, reported on 28.0% of returns)
Here:
$22,909
State:
$23,538
Here:
23.5% of AGI
State:
18.4% of AGI
(% of AGI for various income ranges: 9.8% for AGIs below $25k, 9.3% for AGIs $25k-50k, 12.8% for AGIs $50k-75k, 12.5% for AGIs $75k-100k, 15.9% for AGIs $100k-200k, 16.5% for AGIs over 200k)
Charity contributions: $5,546 (reported on 21.7% of returns)
Here:
$5,546
State:
$4,025
(% of AGI for various income ranges: 0.8% for AGIs below $25k, 1.0% for AGIs $25k-50k, 1.7% for AGIs $50k-75k, 2.3% for AGIs $75k-100k, 2.9% for AGIs $100k-200k, 5.6% for AGIs over 200k)
Taxes paid: $8,575 (reported on 28.0% of returns)
17509:
$8,575
State:
$9,982
(% of AGI for various income ranges: 2.0% for AGIs below $25k, 3.3% for AGIs $25k-50k, 4.7% for AGIs $50k-75k, 5.2% for AGIs $75k-100k, 6.7% for AGIs $100k-200k, 5.9% for AGIs over 200k)
Earned income credit: $2,059 (reported on 11.6% of returns)
Here:
$2,059
State:
$2,106
(% of AGI for various income ranges: 3.4% for AGIs below $25k, 0.8% for AGIs $25k-50k)
Percentage of individuals using paid preparers for their 2012 taxes: 67.7%
Here:
68%
State:
53%
(% for various income ranges: 63.2% for AGIs below $25k, 72.9% for AGIs $25k-50k, 69.2% for AGIs $50k-75k, 65.0% for AGIs $75k-100k, 73.3% for AGIs $100k-200k, 75.0% for AGIs over 200k)
Averages for the 2004 tax year for zip code 17509, filed in 2005:
Average Adjusted Gross Income (AGI) in 2004: $41,812 (Individual Income Tax Returns)
Here:
$41,812
State:
$48,049
Salary/wage: $36,917 (reported on 75.8% of returns)
Here:
$36,917
State:
$42,646
(% of AGI for various income ranges: 187.5% for AGIs below $10k, 63.0% for AGIs $10k-25k, 68.0% for AGIs $25k-50k, 75.2% for AGIs $50k-75k, 78.1% for AGIs $75k-100k, 49.2% for AGIs over 100k)
Taxable interest for individuals: $1,492 (reported on 49.7% of returns)
This zip code:
$1,492
Pennsylvania:
$1,657
(% of AGI for various income ranges: 13.6% for AGIs below $10k, 3.9% for AGIs $10k-25k, 1.6% for AGIs $25k-50k, 1.2% for AGIs $50k-75k, 1.1% for AGIs $75k-100k, 1.7% for AGIs over 100k)
Taxable dividends: $2,639 (reported on 20.0% of returns)
Here:
$2,639
State:
$3,566
(% of AGI for various income ranges: 8.2% for AGIs below $10k, 1.6% for AGIs $10k-25k, 1.1% for AGIs $25k-50k, 0.3% for AGIs $50k-75k, 0.6% for AGIs $75k-100k, 2.3% for AGIs over 100k)
Net capital gain/loss: +$16,911 (reported on 17.4% of returns)
Here:
+$16,911
State:
+$9,716
(% of AGI for various income ranges: 3.3% for AGIs below $10k, 2.6% for AGIs $10k-25k, 1.6% for AGIs $25k-50k, 3.0% for AGIs $50k-75k, 3.9% for AGIs $75k-100k, 19.3% for AGIs over 100k)
Profit/loss from business: +$15,883 (reported on 24.0% of returns)
Here:
+$15,883
State:
+$14,267
(% of AGI for various income ranges: 24.0% for AGIs below $10k, 10.5% for AGIs $10k-25k, 10.2% for AGIs $25k-50k, 6.9% for AGIs $50k-75k, 5.9% for AGIs $75k-100k, 11.0% for AGIs over 100k)
Profit/loss from farming: +$13,209 (reported on 10.4% of returns)
Here:
+$13,209
State:
+$274
(% of AGI for various income ranges: -17.1% for AGIs below $10k, 6.6% for AGIs $10k-25k, 7.6% for AGIs $25k-50k, 4.3% for AGIs $50k-75k, -0.2% for AGIs $75k-100k)
IRA payment deduction: $3,327 (reported on 3.1% of returns)
17509:
$3,327
Pennsylvania:
$2,903
Total itemized deductions: $17,047 (22% of AGI, reported on 29.2% of returns)
Here:
$17,047
State:
$18,804
Here:
21.9% of AGI
State:
19.5% of AGI
(% of AGI for various income ranges: 13.6% for AGIs below $10k, 7.1% for AGIs $10k-25k, 11.0% for AGIs $25k-50k, 12.5% for AGIs $50k-75k, 14.6% for AGIs $75k-100k, 12.3% for AGIs over 100k)
Charity contributions deductions: $3,222 (4% of AGI, reported on 25.2% of returns)
Here:
$3,222
State:
$3,337
Here:
3.9% of AGI
State:
3.3% of AGI
(% of AGI for various income ranges: 1.0% for AGIs $10k-25k, 1.6% for AGIs $25k-50k, 1.6% for AGIs $50k-75k, 2.8% for AGIs $75k-100k, 2.5% for AGIs over 100k)
Total tax: $5,972 (reported on 70.0% of returns)
17509:
$5,972
State:
$8,008
(% of AGI for various income ranges: 6.6% for AGIs below $10k, 4.0% for AGIs $10k-25k, 7.6% for AGIs $25k-50k, 7.1% for AGIs $50k-75k, 9.8% for AGIs $75k-100k, 17.1% for AGIs over 100k)
Earned income credit: $1,639 (reported on 8.4% of returns)
Here:
$1,639
State:
$1,643
Percentage of individuals using paid preparers for their 2004 taxes: 69.9%
Here:
70%
State:
56%
(% for various income ranges: 66.0% for AGIs below $10k, 69.9% for AGIs $10k-25k, 73.3% for AGIs $25k-50k, 68.2% for AGIs $50k-75k, 68.9% for AGIs $75k-100k, 72.1% for AGIs over 100k)
Likely homosexual households (counted as self-reported same-sex unmarried-partner households)
Lesbian couples: 0.3% of all households
Gay men: 0.0% of all households
Household received Food Stamps/SNAP in the past 12 months: 99 Household did not receive Food Stamps/SNAP in the past 12 months: 1,301
Women who had a birth in the past 12 months: 114 (122 now married, 0 unmarried) Women who did not have a birth in the past 12 months: 1,031 (472 now married, 556 unmarried)
Housing units in zip code 17509 with a mortgage: 609 (95 second mortgage, 6 home equity loan, 75 both second mortgage and home equity loan) Houses without a mortgage: 29
Median monthly owner costs for units with a mortgage: $1,743 Median monthly owner costs for units without a mortgage: $683
Residents with income below the poverty level in 2022:
This zip code:
12.4%
Whole state:
11.8%
Residents with income below 50% of the poverty level in 2022:
This zip code:
5.6%
Whole state:
6.1%
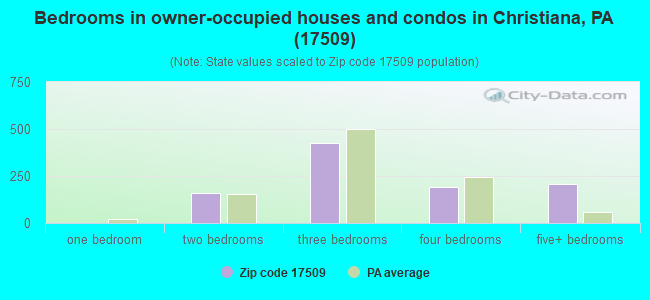
Median number of rooms in houses and condos:
Here:
7.1
State:
6.8
Median number of rooms in apartments:
Here:
5.3
State:
4.3
Notable locations in this zip code not listed on our city pages
In group quarters: 141 (-1 institutionalized population)
Size of family households: 342 2-persons, 163 3-persons, 140 4-persons, 125 5-persons, 99 6-persons, 222 7-or-more-persons
Size of nonfamily households: 243 1-person, 64 2-persons, 6 4-persons
1,526 married couples with children.
147 single-parent households (92 men, 55 women).
58.2% of residents of 17509 zip code speak English at home.
3.4% of residents speak Spanish at home (20% very well, 64% well, 16% not well).
38.3% of residents speak other Indo-European language at home (75% very well, 20% well, 4% not well, 1% not at all).
0.1% of residents speak Asian or Pacific Island language at home (100% very well).
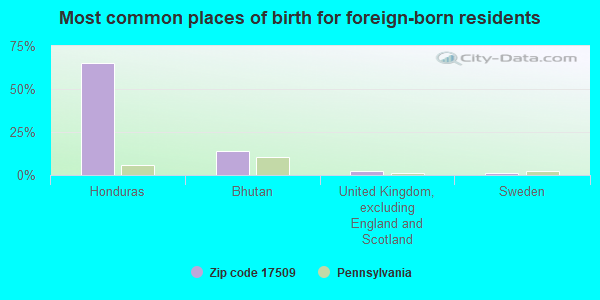
Foreign born population: 95 (1.9%) (44.5% of them are naturalized citizens)
This zip code:
1.9%
Whole state:
7.5%
65%Honduras
14%Bhutan
2%United Kingdom, excluding England and Scotland
1%Sweden
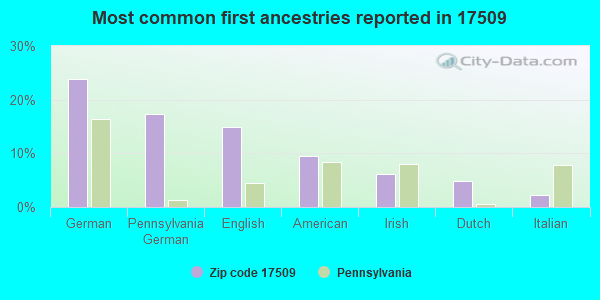
24%German
17%Pennsylvania German
15%English
10%American
6%Irish
5%Dutch
2%Italian
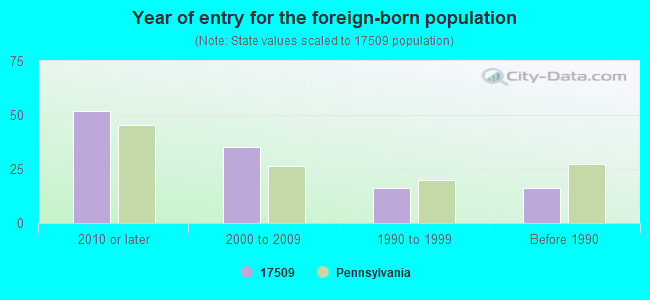
Year of entry for the foreign-born population
522010 or later
352000 to 2009
161990 to 1999
16Before 1990
Facilities with environmental interests located in this zip code:
BART-COLERAIN EL SCH ( in CHRISTIANA, PA)
(National Center for Education Statistics) - STATE ID-2656 Organizations: SOLANCO SD (SCHOOL DISTRICT)
BELL SCHOOL (RD 1 in CHRISTIANA, PA)
(Integrated Compliance Information System) - ICIS-03-1989-0877, FORMAL ENFORCEMENT ACTION COMPLIANCE ACTIVITY (Tracking inspections of insecticide, fungicide, and rodenticide, and toxic substances)
APECO CORP (MILL & SLOCUM STS in CHRISTIANA, PA)
(Resource Conservation and Recovery Act (tracking hazardous waste)) Business NAICS classification: ALL OTHER TRANSPORTATION EQUIPMENT MANUFACTURING. Organizations: OPERNAME (CONTACT/OPERATOR)
, OWNERNAME (CONTACT/OWNER)
APPLE AUTO SALES (423 NEWPORT AVENUE in CHRISTIANA, PA)
AIR MINOR (AIRS/AFS) Business SIC classification: TOP, BODY, AND UPHOLSTERY REPAIR SHOPS AND PAINT SHOPS; GENERAL AUTOMOTIVE REPAIR SHOPS; AUTOMOTIVE REPAIR SHOPS
Housing units lacking complete kitchen facilities: 0.4%
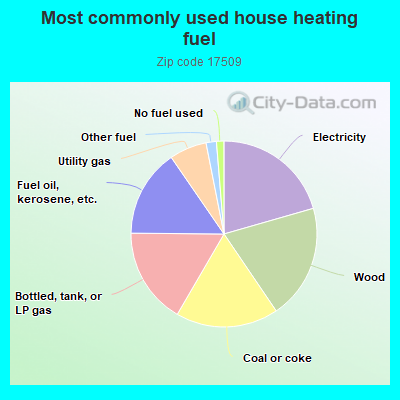
20.6%Electricity
20.0%Wood
17.9%Coal or coke
16.8%Bottled, tank, or LP gas
15.3%Fuel oil, kerosene, etc.
6.5%Utility gas
1.8%Other fuel
1.3%No fuel used
Population in 1990: 4,517. Population change in the 1990s: +144 (+3.2%).
Place of birth for U.S.-born residents:
This state: 4,599
Northeast: 111
Midwest: 46
South: 121
West: 20
73% of the 17509 zip code residents lived in the same house 5 years ago. Out of people who lived in different houses, 65% lived in this county. Out of people who lived in different counties, 50% lived in Pennsylvania.
92% of the 17509 zip code residents lived in the same house 1 year ago. Out of people who lived in different houses, 70% moved from this county. Out of people who lived in different houses, 22% moved from different county within same state. Out of people who lived in different houses, 3% moved from different state. Out of people who lived in different houses, 4% moved from abroad.
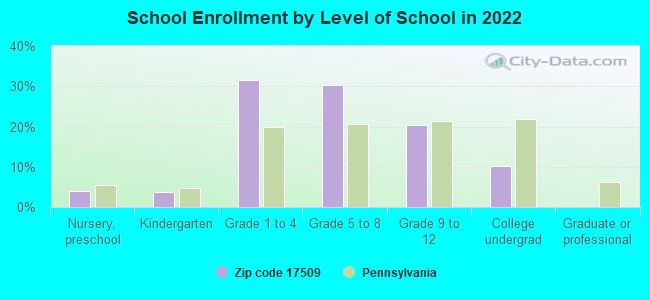
Private vs. public school enrollment:
Students in private schools in grades 1 to 8 (elementary and middle school): 484
Here:
62.9%
Pennsylvania:
15.7%
Students in private schools in grades 9 to 12 (high school): 23
Here:
9.7%
Pennsylvania:
13.4%
Students in private undergraduate colleges: 58
Here:
48.5%
Pennsylvania:
39.8%
Occupation by median earnings in the past 12 months ($)
212,862Computer and mathematical occupations
87,052Architecture and engineering occupations
74,358Installation, maintenance, and repair occupations
69,648Health diagnosing and treating practitioners and other technical occupations
67,115Business and financial operations occupations
55,130Construction and extraction occupations
Top industries in this zip code by the number of employees in 2005:
Health Care and Social Assistance: Nursing Care Facilities (100-249 employees: 1 establishment, 5-9 employees: 1 establishment)
Other Services (except Public Administration): Religious Organizations (10-19: 1, 5-9: 2, 1-4: 4)
Management of Companies and Enterprises: Corporate, Subsidiary, and Regional Managing Offices (20-49: 1)
Construction: New Single-Family Housing Construction (except Operative Builders) (5-9: 2, 1-4: 2)
Other Services (except Public Administration): Commercial and Industrial Machinery and Equipment (except Automotive and Electronic) Repair and Maintenance (10-19: 1, 1-4: 1)
People in group quarters in 2010:
125 people in nursing facilities/skilled-nursing facilities
16 people in workers' group living quarters and job corps centers
People in group quarters in 2000:
130 people in nursing homes
16 people in agriculture workers' dormitories on farms
5 people in other noninstitutional group quarters
Home Mortgage Disclosure Act Aggregated Statistics For Year 2009 (Based on 4 partial tracts)
A) FHA, FSA/RHS & VA Home Purchase Loans
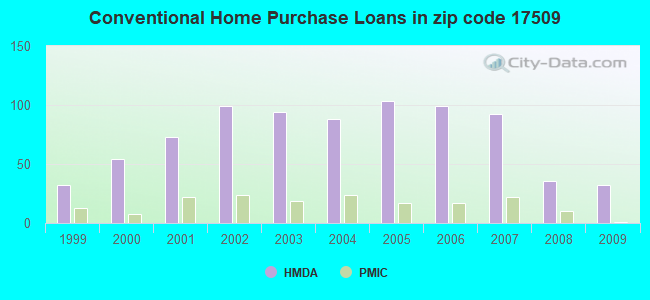
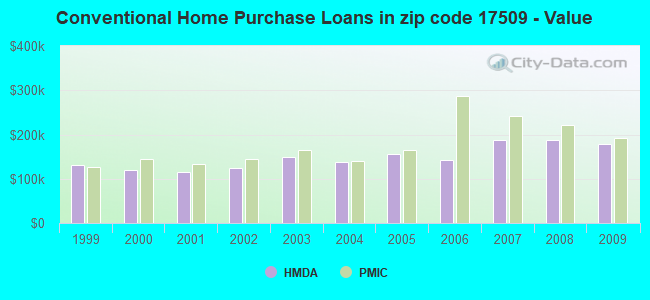
B) Conventional Home Purchase Loans
C) Refinancings
D) Home Improvement Loans
F) Non-occupant Loans on < 5 Family Dwellings (A B C & D)
G) Loans On Manufactured Home Dwelling (A B C & D)
Number
Average Value
Number
Average Value
Number
Average Value
Number
Average Value
Number
Average Value
Number
Average Value
LOANS ORIGINATED
18
$194,936
32
$178,005
181
$172,782
21
$83,993
13
$140,181
1
$56,020
APPLICATIONS APPROVED, NOT ACCEPTED
0
$0
1
$177,390
19
$217,964
1
$22,240
0
$0
0
$0
APPLICATIONS DENIED
2
$190,840
5
$238,306
60
$171,587
2
$29,765
7
$144,491
3
$75,003
APPLICATIONS WITHDRAWN
2
$176,825
3
$306,287
37
$167,229
1
$43,110
0
$0
0
$0
FILES CLOSED FOR INCOMPLETENESS
1
$269,640
0
$0
12
$176,161
0
$0
1
$107,820
0
$0
Aggregated Statistics For Year 2008 (Based on 4 partial tracts)
A) FHA, FSA/RHS & VA Home Purchase Loans
B) Conventional Home Purchase Loans
C) Refinancings
D) Home Improvement Loans
F) Non-occupant Loans on < 5 Family Dwellings (A B C & D)
G) Loans On Manufactured Home Dwelling (A B C & D)
Number
Average Value
Number
Average Value
Number
Average Value
Number
Average Value
Number
Average Value
Number
Average Value
LOANS ORIGINATED
12
$185,426
36
$187,373
116
$166,345
35
$49,166
17
$138,259
5
$103,244
APPLICATIONS APPROVED, NOT ACCEPTED
0
$0
4
$129,650
20
$157,946
2
$11,960
2
$137,595
1
$130,180
APPLICATIONS DENIED
1
$110,940
9
$173,891
71
$179,570
30
$75,531
2
$97,710
7
$60,466
APPLICATIONS WITHDRAWN
2
$262,005
6
$168,612
25
$191,296
4
$65,328
0
$0
0
$0
FILES CLOSED FOR INCOMPLETENESS
0
$0
2
$83,580
3
$180,393
2
$123,545
0
$0
1
$58,710
Aggregated Statistics For Year 2007 (Based on 4 partial tracts)
A) FHA, FSA/RHS & VA Home Purchase Loans
B) Conventional Home Purchase Loans
C) Refinancings
D) Home Improvement Loans
F) Non-occupant Loans on < 5 Family Dwellings (A B C & D)
G) Loans On Manufactured Home Dwelling (A B C & D)
Number
Average Value
Number
Average Value
Number
Average Value
Number
Average Value
Number
Average Value
Number
Average Value
LOANS ORIGINATED
6
$172,357
92
$187,161
146
$144,945
73
$57,429
18
$185,273
8
$95,084
APPLICATIONS APPROVED, NOT ACCEPTED
1
$162,810
11
$175,720
29
$135,336
6
$66,063
3
$177,543
2
$93,175
APPLICATIONS DENIED
0
$0
13
$107,323
83
$188,607
12
$88,652
1
$152,400
7
$96,810
APPLICATIONS WITHDRAWN
0
$0
6
$144,290
41
$170,248
2
$171,870
1
$116,450
1
$37,740
FILES CLOSED FOR INCOMPLETENESS
0
$0
4
$118,690
26
$211,895
1
$215,640
0
$0
1
$253,790
Aggregated Statistics For Year 2006 (Based on 4 partial tracts)
A) FHA, FSA/RHS & VA Home Purchase Loans
B) Conventional Home Purchase Loans
C) Refinancings
D) Home Improvement Loans
F) Non-occupant Loans on < 5 Family Dwellings (A B C & D)
G) Loans On Manufactured Home Dwelling (A B C & D)
Number
Average Value
Number
Average Value
Number
Average Value
Number
Average Value
Number
Average Value
Number
Average Value
LOANS ORIGINATED
4
$152,135
99
$142,898
206
$138,612
72
$56,626
18
$134,372
7
$89,573
APPLICATIONS APPROVED, NOT ACCEPTED
0
$0
11
$143,116
16
$167,251
5
$51,750
3
$165,003
1
$90,620
APPLICATIONS DENIED
1
$205,530
15
$129,410
71
$151,796
10
$75,526
4
$171,845
3
$81,463
APPLICATIONS WITHDRAWN
1
$153,100
8
$232,230
61
$148,640
5
$68,720
2
$115,485
1
$109,570
FILES CLOSED FOR INCOMPLETENESS
0
$0
2
$41,735
18
$157,756
0
$0
0
$0
0
$0
Aggregated Statistics For Year 2005 (Based on 4 partial tracts)
B) Conventional Home Purchase Loans
C) Refinancings
D) Home Improvement Loans
F) Non-occupant Loans on < 5 Family Dwellings (A B C & D)
G) Loans On Manufactured Home Dwelling (A B C & D)
Number
Average Value
Number
Average Value
Number
Average Value
Number
Average Value
Number
Average Value
LOANS ORIGINATED
103
$154,810
191
$121,482
61
$58,302
14
$125,733
8
$36,338
APPLICATIONS APPROVED, NOT ACCEPTED
10
$130,535
24
$119,623
1
$49,980
2
$90,315
3
$35,813
APPLICATIONS DENIED
28
$128,055
107
$151,314
21
$95,327
1
$34,200
13
$65,702
APPLICATIONS WITHDRAWN
12
$131,351
68
$161,570
11
$115,840
4
$149,120
1
$94,590
FILES CLOSED FOR INCOMPLETENESS
2
$216,225
10
$183,591
0
$0
0
$0
0
$0
Aggregated Statistics For Year 2004 (Based on 4 partial tracts)
A) FHA, FSA/RHS & VA Home Purchase Loans
B) Conventional Home Purchase Loans
C) Refinancings
D) Home Improvement Loans
F) Non-occupant Loans on < 5 Family Dwellings (A B C & D)
G) Loans On Manufactured Home Dwelling (A B C & D)
Number
Average Value
Number
Average Value
Number
Average Value
Number
Average Value
Number
Average Value
Number
Average Value
LOANS ORIGINATED
2
$129,990
88
$137,784
197
$117,645
57
$43,999
15
$134,855
2
$48,145
APPLICATIONS APPROVED, NOT ACCEPTED
0
$0
13
$113,330
46
$118,705
1
$51,350
0
$0
2
$73,865
APPLICATIONS DENIED
0
$0
7
$174,184
102
$139,323
15
$66,960
3
$85,117
7
$57,983
APPLICATIONS WITHDRAWN
0
$0
8
$116,426
65
$140,862
8
$87,158
3
$128,697
1
$67,830
FILES CLOSED FOR INCOMPLETENESS
0
$0
0
$0
18
$168,847
0
$0
0
$0
0
$0
Aggregated Statistics For Year 2003 (Based on 4 partial tracts)
A) FHA, FSA/RHS & VA Home Purchase Loans
B) Conventional Home Purchase Loans
C) Refinancings
D) Home Improvement Loans
F) Non-occupant Loans on < 5 Family Dwellings (A B C & D)
Number
Average Value
Number
Average Value
Number
Average Value
Number
Average Value
Number
Average Value
LOANS ORIGINATED
5
$104,152
94
$148,152
372
$110,011
42
$32,062
16
$144,034
APPLICATIONS APPROVED, NOT ACCEPTED
0
$0
7
$77,784
40
$95,904
9
$44,024
1
$66,850
APPLICATIONS DENIED
0
$0
10
$89,730
112
$116,953
11
$29,278
6
$60,530
APPLICATIONS WITHDRAWN
0
$0
5
$102,632
88
$142,930
4
$55,018
3
$206,710
FILES CLOSED FOR INCOMPLETENESS
0
$0
2
$212,115
5
$135,076
5
$56,806
0
$0
Aggregated Statistics For Year 2002 (Based on 4 partial tracts)
A) FHA, FSA/RHS & VA Home Purchase Loans
B) Conventional Home Purchase Loans
C) Refinancings
D) Home Improvement Loans
F) Non-occupant Loans on < 5 Family Dwellings (A B C & D)
Number
Average Value
Number
Average Value
Number
Average Value
Number
Average Value
Number
Average Value
LOANS ORIGINATED
10
$101,228
99
$124,981
220
$100,132
52
$28,467
21
$115,966
APPLICATIONS APPROVED, NOT ACCEPTED
1
$106,740
7
$95,714
31
$113,623
6
$64,847
0
$0
APPLICATIONS DENIED
0
$0
11
$101,661
85
$106,884
11
$26,898
4
$109,298
APPLICATIONS WITHDRAWN
0
$0
4
$91,138
67
$124,801
4
$22,455
0
$0
FILES CLOSED FOR INCOMPLETENESS
0
$0
0
$0
17
$123,562
0
$0
0
$0
Aggregated Statistics For Year 2001 (Based on 4 partial tracts)
A) FHA, FSA/RHS & VA Home Purchase Loans
B) Conventional Home Purchase Loans
C) Refinancings
D) Home Improvement Loans
F) Non-occupant Loans on < 5 Family Dwellings (A B C & D)
Number
Average Value
Number
Average Value
Number
Average Value
Number
Average Value
Number
Average Value
LOANS ORIGINATED
5
$134,178
73
$115,558
199
$92,565
47
$24,820
14
$79,513
APPLICATIONS APPROVED, NOT ACCEPTED
0
$0
4
$66,198
22
$91,900
4
$26,530
0
$0
APPLICATIONS DENIED
1
$181,280
15
$97,403
70
$99,783
20
$27,820
3
$92,507
APPLICATIONS WITHDRAWN
0
$0
6
$98,968
41
$128,052
4
$25,905
1
$41,420
FILES CLOSED FOR INCOMPLETENESS
0
$0
0
$0
4
$72,735
0
$0
0
$0
Aggregated Statistics For Year 2000 (Based on 4 partial tracts)
A) FHA, FSA/RHS & VA Home Purchase Loans
B) Conventional Home Purchase Loans
C) Refinancings
D) Home Improvement Loans
E) Loans on Dwellings For 5+ Families
F) Non-occupant Loans on < 5 Family Dwellings (A B C & D)
Number
Average Value
Number
Average Value
Number
Average Value
Number
Average Value
Number
Average Value
Number
Average Value
LOANS ORIGINATED
4
$117,958
54
$120,440
67
$72,902
54
$23,735
1
$159,570
8
$64,732
APPLICATIONS APPROVED, NOT ACCEPTED
0
$0
1
$240,820
21
$74,360
9
$34,418
0
$0
0
$0
APPLICATIONS DENIED
0
$0
21
$65,411
45
$92,857
18
$16,204
0
$0
4
$66,312
APPLICATIONS WITHDRAWN
0
$0
5
$131,218
35
$99,111
4
$22,240
0
$0
2
$86,990
FILES CLOSED FOR INCOMPLETENESS
0
$0
0
$0
6
$67,742
0
$0
0
$0
0
$0
Aggregated Statistics For Year 1999 (Based on 2 partial tracts)
A) FHA, FSA/RHS & VA Home Purchase Loans
B) Conventional Home Purchase Loans
C) Refinancings
D) Home Improvement Loans
E) Loans on Dwellings For 5+ Families
F) Non-occupant Loans on < 5 Family Dwellings (A B C & D)
Detailed PMIC statistics for the following Tracts:0143.00
, 0146.02
2002 - 2018 National Fire Incident Reporting System (NFIRS) incidents
According to the data from the years 2002 - 2018 the average number of fire incidents per year is 36. The highest number of fires - 73 took place in 2008, and the least - 10 in 2002. The data has an increasing trend.
When looking into fire subcategories, the most reports belonged to: Structure Fires (52.4%), and Outside Fires (23.3%).
Fire incident types reported to NFIRS in Zip Code 17509


 Nearest zip codes: 19310, 17535, 17536, 17562, 17572, 17527.


 According to the data from the years 2002 - 2018 the average number of fire incidents per year is 36. The highest number of fires - 73 took place in 2008, and the least - 10 in 2002. The data has an increasing trend.
 When looking into fire subcategories, the most reports belonged to: Structure Fires (52.4%), and Outside Fires (23.3%).