Estimated zip code population in 2022: 2,974 Zip code population in 2010: 3,158 Zip code population in 2000: 3,547
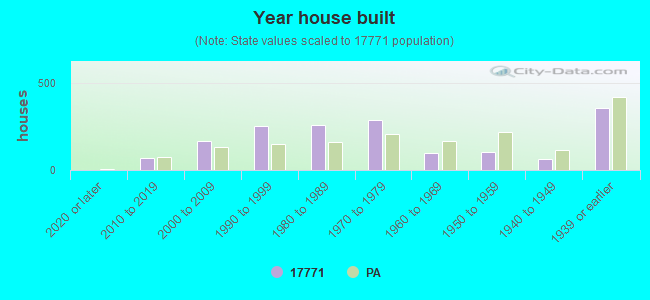
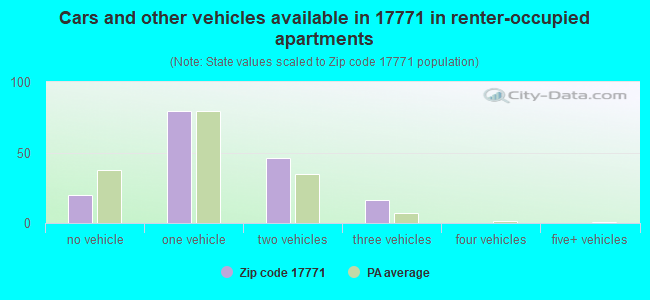
Houses and condos: 1,666 Renter-occupied apartments: 161
% of renters here:
13%
State:
31%
March 2022 cost of living index in zip code 17771: 92.3 (less than average, U.S. average is 100)
Land area: 215.8 sq. mi. Water area: 1.8 sq. mi.
Population density: 14 people per square mile
(very low).
OSM Map
General Map
Google Map
MSN Map
OSM Map
General Map
Google Map
MSN Map
OSM Map
General Map
Google Map
MSN Map
OSM Map
General Map
Google Map
MSN Map
Please wait while loading the map...
Real estate property taxes paid for housing units in 2022:
This zip code:
1.1% ($2,258)
Pennsylvania:
1.3% ($3,094)
Median real estate property taxes paid for housing units with mortgages in 2022: $2,314 (1.0%) Median real estate property taxes paid for housing units with no mortgage in 2022: $2,182 (1.2%)
Business Search- 14 Million verified businesses
Males: 1,532
(51.5%)
Females: 1,441
(48.5%)
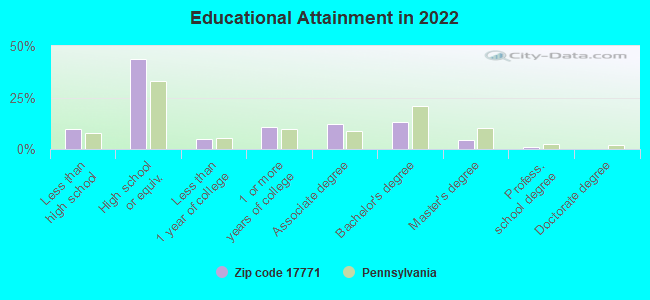
For population 25 years and over in 17771:
High school or higher: 89.3%
Bachelor's degree or higher: 18.8%
Graduate or professional degree: 5.9%
Unemployed: 3.3%
Mean travel time to work (commute): 28.8 minutes
For population 15 years and over in 17771:
Never married: 27.5%
Now married: 54.3%
Separated: 0.7%
Widowed: 7.2%
Divorced: 10.3%
Zip code 17771 compared to state average:
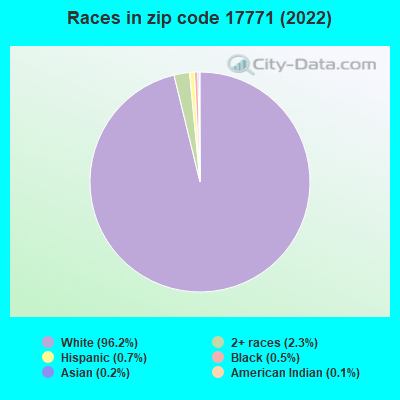
Black race population percentage significantly below state average.
Hispanic race population percentage significantly below state average.
Median age above state average.
Foreign-born population percentage significantly below state average.
Renting percentage significantly below state average.
Length of stay since moving in significantly above state average.
Number of college students below state average.
Percentage of population with a bachelor's degree or higher below state average.
Estimated median house/condo value in 2022: $203,498
17771:
$203,498
Pennsylvania:
$245,500
According to our research of Pennsylvania and other state lists, there were 5 registered sex offenders living in 17771 zip code as of May 22, 2024. The ratio of all residents to sex offenders in zip code 17771 is 664 to 1. The ratio of registered sex offenders to all residents in this zip code is near the state average.
Median resident age:
This zip code:
47.2 years
Pennsylvania median age:
40.9 years
Average household size:
This zip code:
2.4 people
Pennsylvania:
2.4 people
Averages for the 2020 tax year for zip code 17771, filed in 2021:
Average Adjusted Gross Income (AGI) in 2020: $57,676 (Individual Income Tax Returns)
Here:
$57,676
State:
$75,707
Salary/wage: $46,482 (reported on 73.0% of returns)
Here:
$46,482
State:
$62,806
(% of AGI for various income ranges: 1061.7% for AGIs below $25k, 3007.9% for AGIs $25k-50k, 5416.8% for AGIs $50k-75k, 8178.5% for AGIs $75k-100k, 12852.7% for AGIs $100k-200k)
Taxable interest for individuals: $896 (reported on 31.6% of returns)
This zip code:
$896
Pennsylvania:
$1,633
(% of AGI for various income ranges: 12.7% for AGIs below $25k, 25.5% for AGIs $25k-50k, 7.9% for AGIs $50k-75k, 24.6% for AGIs $75k-100k, 104.5% for AGIs $100k-200k)
Ordinary dividends: $4,017 (reported on 19.7% of returns)
Here:
$4,017
State:
$7,382
(% of AGI for various income ranges: 35.3% for AGIs below $25k, 63.1% for AGIs $25k-50k, 92.1% for AGIs $50k-75k, 68.5% for AGIs $75k-100k, 75.5% for AGIs $100k-200k)
Net capital gain/loss in AGI: +$9,033 (reported on 13.8% of returns)
Here:
+$9,033
State:
+$23,522
(% of AGI for various income ranges: 29.3% for AGIs below $25k, 35.9% for AGIs $25k-50k, 96.8% for AGIs $50k-75k, 203.1% for AGIs $75k-100k, 387.3% for AGIs $100k-200k)
Profit/loss from business: +$9,545 (reported on 13.2% of returns)
Here:
+$9,545
State:
+$16,274
(% of AGI for various income ranges: 86.3% for AGIs below $25k, 107.9% for AGIs $25k-50k, 255.3% for AGIs $50k-75k, 74.6% for AGIs $75k-100k, 686.4% for AGIs $100k-200k)
Taxable individual retirement arrangement distribution: $11,955 (reported on 13.2% of returns)
17771:
$11,955
Pennsylvania:
$18,583
(% of AGI for various income ranges: 116.0% for AGIs below $25k, 166.9% for AGIs $25k-50k, 334.7% for AGIs $50k-75k, 839.1% for AGIs $100k-200k)
Total itemized deductions: $31,857 (reported on 4.6% of returns)
Here:
$31,857
State:
$34,850
(% of AGI for various income ranges: 543.2% for AGIs $50k-75k, 1089.1% for AGIs $100k-200k)
Charity contributions: $16,680 (reported on 3.3% of returns)
Here:
$16,680
State:
$12,392
(% of AGI for various income ranges: 74.1% for AGIs $25k-50k, 562.7% for AGIs $100k-200k)
Taxes paid: $7,157 (reported on 4.6% of returns)
17771:
$7,157
State:
$8,200
(% of AGI for various income ranges: 116.3% for AGIs $50k-75k, 254.5% for AGIs $100k-200k)
Earned income credit: $2,176 (reported on 11.2% of returns)
Here:
$2,176
State:
$2,100
(% of AGI for various income ranges: 65.0% for AGIs below $25k, 60.3% for AGIs $25k-50k)
Percentage of individuals using paid preparers for their 2020 taxes: 95.4%
Here:
95%
State:
92%
(% for various income ranges: 93.9% for AGIs below $25k, 94.6% for AGIs $25k-50k, 96.2% for AGIs $50k-75k, 94.4% for AGIs $75k-100k, 100.0% for AGIs $100k-200k, 100.0% for AGIs over 200k)
Averages for the 2012 tax year for zip code 17771, filed in 2013:
Average Adjusted Gross Income (AGI) in 2012: $55,617 (Individual Income Tax Returns)
Here:
$55,617
State:
$61,346
Salary/wage: $40,914 (reported on 82.1% of returns)
Here:
$40,914
State:
$51,902
(% of AGI for various income ranges: 67.5% for AGIs below $25k, 73.1% for AGIs $25k-50k, 75.7% for AGIs $50k-75k, 75.6% for AGIs $75k-100k, 63.8% for AGIs $100k-200k, 20.2% for AGIs over 200k)
Taxable interest for individuals: $654 (reported on 34.6% of returns)
This zip code:
$654
Pennsylvania:
$1,588
(% of AGI for various income ranges: 1.1% for AGIs below $25k, 0.8% for AGIs $25k-50k, 0.5% for AGIs $50k-75k, 0.2% for AGIs $75k-100k, 0.3% for AGIs $100k-200k, 0.1% for AGIs over 200k)
Ordinary dividends: $3,147 (reported on 19.2% of returns)
Here:
$3,147
State:
$5,827
(% of AGI for various income ranges: 1.4% for AGIs below $25k, 1.5% for AGIs $25k-50k, 1.0% for AGIs $50k-75k, 0.5% for AGIs $75k-100k, 2.1% for AGIs $100k-200k)
Net capital gain/loss in AGI: +$9,119 (reported on 13.5% of returns)
Here:
+$9,119
State:
+$14,495
(% of AGI for various income ranges: 1.0% for AGIs $25k-50k, 2.4% for AGIs $50k-75k, 0.9% for AGIs $75k-100k, 4.6% for AGIs $100k-200k, 2.3% for AGIs over 200k)
Profit/loss from business: +$9,762 (reported on 15.4% of returns)
Here:
+$9,762
State:
+$16,268
(% of AGI for various income ranges: 7.1% for AGIs below $25k, 1.9% for AGIs $25k-50k, 1.3% for AGIs $50k-75k, 1.1% for AGIs $75k-100k, 6.4% for AGIs $100k-200k)
Taxable individual retirement arrangement distribution: $10,871 (reported on 10.9% of returns)
17771:
$10,871
Pennsylvania:
$14,550
(% of AGI for various income ranges: 3.9% for AGIs below $25k, 2.7% for AGIs $25k-50k, 1.7% for AGIs $50k-75k, 1.7% for AGIs $75k-100k, 3.8% for AGIs $100k-200k)
Total itemized deductions: $18,597 (16% of AGI, reported on 23.7% of returns)
Here:
$18,597
State:
$23,538
Here:
16.4% of AGI
State:
18.4% of AGI
(% of AGI for various income ranges: 5.2% for AGIs below $25k, 5.1% for AGIs $25k-50k, 7.9% for AGIs $50k-75k, 9.0% for AGIs $75k-100k, 10.8% for AGIs $100k-200k, 7.2% for AGIs over 200k)
Charity contributions: $4,656 (reported on 16.0% of returns)
Here:
$4,656
State:
$4,025
(% of AGI for various income ranges: 0.5% for AGIs $25k-50k, 0.8% for AGIs $50k-75k, 1.1% for AGIs $75k-100k, 1.6% for AGIs $100k-200k, 2.9% for AGIs over 200k)
Taxes paid: $7,192 (reported on 23.1% of returns)
17771:
$7,192
State:
$9,982
(% of AGI for various income ranges: 1.0% for AGIs below $25k, 1.3% for AGIs $25k-50k, 2.8% for AGIs $50k-75k, 3.7% for AGIs $75k-100k, 4.3% for AGIs $100k-200k, 3.3% for AGIs over 200k)
Earned income credit: $2,022 (reported on 14.7% of returns)
Here:
$2,022
State:
$2,106
(% of AGI for various income ranges: 5.0% for AGIs below $25k, 0.8% for AGIs $25k-50k)
Percentage of individuals using paid preparers for their 2012 taxes: 61.5%
Here:
62%
State:
53%
(% for various income ranges: 55.0% for AGIs below $25k, 56.8% for AGIs $25k-50k, 68.0% for AGIs $50k-75k, 66.7% for AGIs $75k-100k, 73.3% for AGIs $100k-200k, 100.0% for AGIs over 200k)
Averages for the 2004 tax year for zip code 17771, filed in 2005:
Average Adjusted Gross Income (AGI) in 2004: $34,688 (Individual Income Tax Returns)
Here:
$34,688
State:
$48,049
Salary/wage: $32,650 (reported on 82.4% of returns)
Here:
$32,650
State:
$42,646
(% of AGI for various income ranges: 104.6% for AGIs below $10k, 70.6% for AGIs $10k-25k, 81.9% for AGIs $25k-50k, 86.5% for AGIs $50k-75k, 75.8% for AGIs $75k-100k, 56.9% for AGIs over 100k)
Taxable interest for individuals: $854 (reported on 46.1% of returns)
This zip code:
$854
Pennsylvania:
$1,657
(% of AGI for various income ranges: 5.8% for AGIs below $10k, 2.8% for AGIs $10k-25k, 1.2% for AGIs $25k-50k, 0.6% for AGIs $50k-75k, 0.2% for AGIs $75k-100k, 0.6% for AGIs over 100k)
Taxable dividends: $1,407 (reported on 23.2% of returns)
Here:
$1,407
State:
$3,566
(% of AGI for various income ranges: 6.6% for AGIs below $10k, 1.2% for AGIs $10k-25k, 0.8% for AGIs $25k-50k, 0.3% for AGIs $50k-75k, 0.3% for AGIs $75k-100k, 2.0% for AGIs over 100k)
Net capital gain/loss: +$5,732 (reported on 16.5% of returns)
Here:
+$5,732
State:
+$9,716
(% of AGI for various income ranges: -2.7% for AGIs below $10k, 0.2% for AGIs $10k-25k, 1.5% for AGIs $25k-50k, 0.6% for AGIs $50k-75k, 6.7% for AGIs $75k-100k, 8.5% for AGIs over 100k)
Profit/loss from business: +$5,247 (reported on 17.1% of returns)
Here:
+$5,247
State:
+$14,267
(% of AGI for various income ranges: 5.2% for AGIs below $10k, 8.0% for AGIs $10k-25k, 1.3% for AGIs $25k-50k, 1.7% for AGIs $50k-75k, 0.5% for AGIs $75k-100k, 3.5% for AGIs over 100k)
Profit/loss from farming: +$2,000 (reported on 2.6% of returns)
Here:
+$2,000
State:
+$274
IRA payment deduction: $2,122 (reported on 3.2% of returns)
17771:
$2,122
Pennsylvania:
$2,903
Total itemized deductions: $14,550 (23% of AGI, reported on 23.3% of returns)
Here:
$14,550
State:
$18,804
Here:
23.0% of AGI
State:
19.5% of AGI
(% of AGI for various income ranges: 6.1% for AGIs $10k-25k, 8.5% for AGIs $25k-50k, 11.8% for AGIs $50k-75k, 11.1% for AGIs $75k-100k, 12.1% for AGIs over 100k)
Charity contributions deductions: $2,486 (4% of AGI, reported on 18.9% of returns)
Here:
$2,486
State:
$3,337
Here:
3.7% of AGI
State:
3.3% of AGI
(% of AGI for various income ranges: 0.8% for AGIs $10k-25k, 0.8% for AGIs $25k-50k, 1.3% for AGIs $50k-75k, 2.0% for AGIs $75k-100k, 2.7% for AGIs over 100k)
Total tax: $4,090 (reported on 72.3% of returns)
17771:
$4,090
State:
$8,008
(% of AGI for various income ranges: 4.0% for AGIs below $10k, 4.3% for AGIs $10k-25k, 6.1% for AGIs $25k-50k, 8.6% for AGIs $50k-75k, 10.6% for AGIs $75k-100k, 15.8% for AGIs over 100k)
Earned income credit: $1,605 (reported on 16.9% of returns)
Here:
$1,605
State:
$1,643
Percentage of individuals using paid preparers for their 2004 taxes: 58.6%
Here:
59%
State:
56%
(% for various income ranges: 52.6% for AGIs below $10k, 60.3% for AGIs $10k-25k, 59.6% for AGIs $25k-50k, 59.4% for AGIs $50k-75k, 61.6% for AGIs $75k-100k, 67.3% for AGIs over 100k)
Household received Food Stamps/SNAP in the past 12 months: 166 Household did not receive Food Stamps/SNAP in the past 12 months: 1,095
Women who had a birth in the past 12 months: 23 (13 now married, 9 unmarried) Women who did not have a birth in the past 12 months: 473 (203 now married, 269 unmarried)
Housing units in zip code 17771 with a mortgage: 560 (74 second mortgage, 2 home equity loan, 65 both second mortgage and home equity loan) Houses without a mortgage: 39
Median monthly owner costs for units with a mortgage: $1,315 Median monthly owner costs for units without a mortgage: $540
Residents with income below the poverty level in 2022:
This zip code:
11.6%
Whole state:
11.8%
Residents with income below 50% of the poverty level in 2022:
This zip code:
6.1%
Whole state:
6.1%
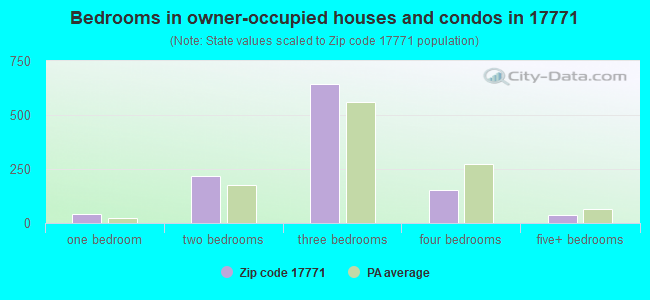
Median number of rooms in houses and condos:
Here:
6.0
State:
6.8
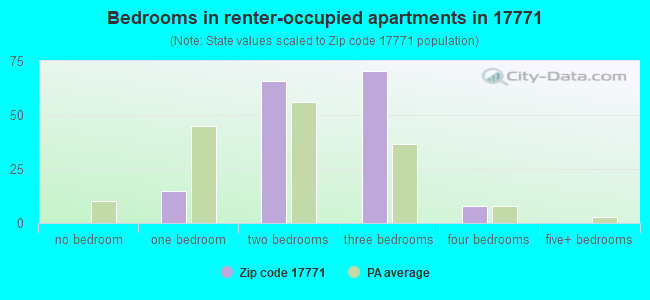
Median number of rooms in apartments:
Here:
4.9
State:
4.3
Notable locations in this zip code not listed on our city pages
Notable locations in zip code 17771: English (A), Elk Knob Vista (B), Lycoming Club (C), Cogan House (D), Fields Station (E), Jackson Corners (F), Trout Run Volunteer Fire Company (G). Display/hide their locations on the map
Churches in zip code 17771 include: Rose Valley Church (A), Church of the Assumption (B), Hoffman Church (C), Steam Valley Church (D), Summit Church (E), Centennial Church (F). Display/hide their locations on the map
Streams, rivers, and creeks: Rock Spring Run (A), Glendenen Run (B), Pleasant Stream (C), Pigeon Run (D), Packhorse Creek (E), Slacks Run (F), Shoemaker Run (G), Graveyard Run (H), Big Sandy Run (I). Display/hide their locations on the map
341 married couples with children.
227 single-parent households (161 men, 66 women).
98.8% of residents of 17771 zip code speak English at home.
0.3% of residents speak Spanish at home (100% very well).
0.2% of residents speak other Indo-European language at home (43% very well, 57% well).
0.2% of residents speak other language at home (100% very well).
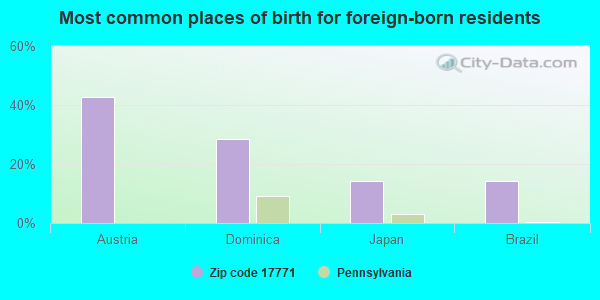
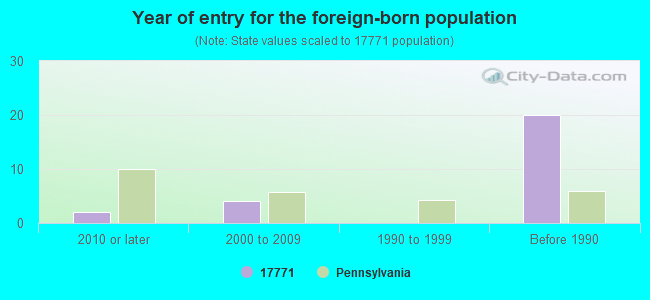
Foreign born population: 7 (0.2%) (43.9% of them are naturalized citizens)
This zip code:
0.2%
Whole state:
7.5%
43%Austria
29%Dominica
14%Japan
14%Brazil
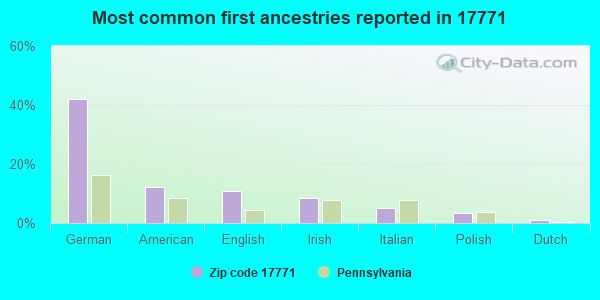
42%German
12%American
11%English
9%Irish
5%Italian
3%Polish
1%Dutch
Year of entry for the foreign-born population
22010 or later
42000 to 2009
01990 to 1999
20Before 1990
Facilities with environmental interests located in this zip code:
BITTNERS MHP (BITTNER PARK RD in TROUT RUN, PA)
National Pollutant Discharge Elimination System NON-MAJOR (Tracking pollutant discharge elimination systems) - permit Business SIC classification: SEWERAGE SYSTEMS Alternative names: BITTNER, GEORGE, GEORGE BITTNER
Housing units lacking complete plumbing facilities: 9.6% Housing units lacking complete kitchen facilities: 6.6%
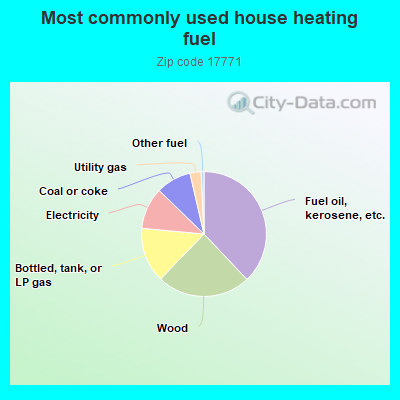
37.9%Fuel oil, kerosene, etc.
24.2%Wood
14.2%Bottled, tank, or LP gas
10.8%Electricity
9.1%Coal or coke
2.9%Utility gas
0.7%Other fuel
Population in 1990: 4,449.
Place of birth for U.S.-born residents:
This state: 2,616
Northeast: 147
Midwest: 73
South: 32
West: 53
70% of the 17771 zip code residents lived in the same house 5 years ago. Out of people who lived in different houses, 71% lived in this county. Out of people who lived in different counties, 50% lived in Pennsylvania.
96% of the 17771 zip code residents lived in the same house 1 year ago. Out of people who lived in different houses, 78% moved from this county. Out of people who lived in different houses, 18% moved from different county within same state. Out of people who lived in different houses, 7% moved from different state.
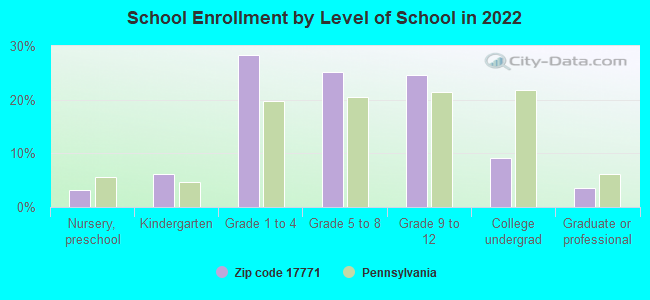
Private vs. public school enrollment:
Students in private schools in grades 1 to 8 (elementary and middle school): 138
Here:
41.7%
Pennsylvania:
15.7%
Students in private schools in grades 9 to 12 (high school): 6
Here:
4.4%
Pennsylvania:
13.4%
Students in private undergraduate colleges: 11
Here:
21.5%
Pennsylvania:
39.8%
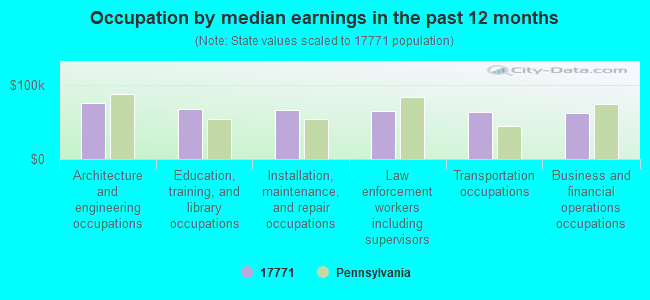
Occupation by median earnings in the past 12 months ($)
74,616Architecture and engineering occupations
66,882Education, training, and library occupations
65,501Installation, maintenance, and repair occupations
64,990Law enforcement workers including supervisors
62,633Transportation occupations
62,321Business and financial operations occupations
Top industries in this zip code by the number of employees in 2005:
Administrative and Support and Waste Management and Remediation Services: Telemarketing Bureaus (100-249 employees: 1 establishment)
Accommodation and Food Services: Full-Service Restaurants (20-49: 2)
Other Services (except Public Administration): Religious Organizations (10-19: 1, 1-4: 1)
Accommodation and Food Services: Drinking Places (Alcoholic Beverages) (10-19: 1)
Other Services (except Public Administration): General Automotive Repair (1-4: 2)
Construction: New Single-Family Housing Construction (except Operative Builders) (1-4: 2)
People in group quarters in 2000:
18 people in homes or halfway houses for drug/alcohol abuse
Fatal accident statistics in 2013:
Fatal accident count: 1
Vehicles involved in fatal accidents: 1
Fatal accidents caused by drunken drivers: 1
Fatalities: 1
Persons involved in fatal accidents: 1
Pedestrians involved in fatal accidents: 0
Fatal accident statistics in 2011:
Fatal accident count: 3
Vehicles involved in fatal accidents: 5
Fatal accidents caused by drunken drivers: 1
Fatalities: 3
Persons involved in fatal accidents: 6
Pedestrians involved in fatal accidents: 0
Home Mortgage Disclosure Act Aggregated Statistics For Year 2009 (Based on 6 partial tracts)
A) FHA, FSA/RHS & VA Home Purchase Loans
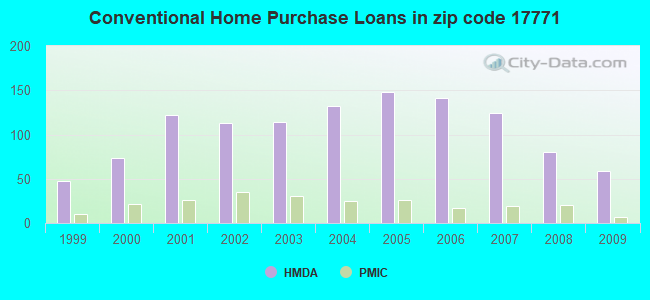
B) Conventional Home Purchase Loans
C) Refinancings
D) Home Improvement Loans
F) Non-occupant Loans on < 5 Family Dwellings (A B C & D)
G) Loans On Manufactured Home Dwelling (A B C & D)
Number
Average Value
Number
Average Value
Number
Average Value
Number
Average Value
Number
Average Value
Number
Average Value
LOANS ORIGINATED
20
$138,162
59
$133,662
227
$141,793
46
$42,287
17
$108,458
8
$33,879
APPLICATIONS APPROVED, NOT ACCEPTED
1
$38,470
1
$123,520
20
$127,560
3
$17,767
2
$112,520
1
$16,070
APPLICATIONS DENIED
3
$90,627
12
$131,240
99
$124,442
26
$22,534
8
$111,769
7
$54,376
APPLICATIONS WITHDRAWN
5
$164,712
7
$134,600
60
$145,294
8
$133,171
4
$195,728
1
$55,090
FILES CLOSED FOR INCOMPLETENESS
1
$163,280
0
$0
13
$147,408
2
$117,570
1
$160,740
1
$115,000
Aggregated Statistics For Year 2008 (Based on 6 partial tracts)
A) FHA, FSA/RHS & VA Home Purchase Loans
B) Conventional Home Purchase Loans
C) Refinancings
D) Home Improvement Loans
E) Loans on Dwellings For 5+ Families
F) Non-occupant Loans on < 5 Family Dwellings (A B C & D)
G) Loans On Manufactured Home Dwelling (A B C & D)
Number
Average Value
Number
Average Value
Number
Average Value
Number
Average Value
Number
Average Value
Number
Average Value
Number
Average Value
LOANS ORIGINATED
17
$122,982
80
$126,843
144
$104,530
75
$42,112
1
$109,300
22
$102,901
12
$58,467
APPLICATIONS APPROVED, NOT ACCEPTED
3
$130,727
3
$72,013
25
$89,453
8
$42,036
0
$0
0
$0
3
$72,587
APPLICATIONS DENIED
1
$98,810
12
$98,534
91
$115,364
25
$55,637
0
$0
5
$125,760
8
$48,722
APPLICATIONS WITHDRAWN
1
$178,380
6
$116,182
45
$116,238
3
$38,107
0
$0
1
$108,290
3
$47,563
FILES CLOSED FOR INCOMPLETENESS
0
$0
1
$108,290
6
$101,030
1
$13,540
0
$0
1
$108,290
0
$0
Aggregated Statistics For Year 2007 (Based on 6 partial tracts)
A) FHA, FSA/RHS & VA Home Purchase Loans
B) Conventional Home Purchase Loans
C) Refinancings
D) Home Improvement Loans
F) Non-occupant Loans on < 5 Family Dwellings (A B C & D)
G) Loans On Manufactured Home Dwelling (A B C & D)
Number
Average Value
Number
Average Value
Number
Average Value
Number
Average Value
Number
Average Value
Number
Average Value
LOANS ORIGINATED
13
$120,570
124
$117,961
197
$93,355
93
$40,190
27
$121,390
27
$42,642
APPLICATIONS APPROVED, NOT ACCEPTED
0
$0
12
$125,872
38
$85,766
13
$33,218
3
$106,930
3
$57,980
APPLICATIONS DENIED
2
$109,625
29
$90,036
150
$102,820
44
$49,297
8
$59,062
24
$55,605
APPLICATIONS WITHDRAWN
1
$110,830
11
$123,835
74
$114,709
9
$40,207
2
$68,475
7
$92,114
FILES CLOSED FOR INCOMPLETENESS
0
$0
4
$80,698
21
$120,100
2
$37,090
2
$108,365
0
$0
Aggregated Statistics For Year 2006 (Based on 6 partial tracts)
A) FHA, FSA/RHS & VA Home Purchase Loans
B) Conventional Home Purchase Loans
C) Refinancings
D) Home Improvement Loans
E) Loans on Dwellings For 5+ Families
F) Non-occupant Loans on < 5 Family Dwellings (A B C & D)
G) Loans On Manufactured Home Dwelling (A B C & D)
Number
Average Value
Number
Average Value
Number
Average Value
Number
Average Value
Number
Average Value
Number
Average Value
Number
Average Value
LOANS ORIGINATED
7
$121,746
141
$115,649
220
$82,606
122
$46,045
0
$0
32
$107,350
31
$58,216
APPLICATIONS APPROVED, NOT ACCEPTED
2
$116,170
11
$110,385
43
$83,222
19
$25,815
0
$0
4
$54,348
1
$16,920
APPLICATIONS DENIED
3
$98,423
31
$77,058
197
$100,710
42
$37,413
1
$92,430
11
$60,562
18
$60,498
APPLICATIONS WITHDRAWN
1
$92,690
23
$97,129
100
$98,099
10
$62,710
0
$0
4
$72,575
4
$110,260
FILES CLOSED FOR INCOMPLETENESS
0
$0
4
$131,758
29
$117,546
2
$60,580
0
$0
3
$150,490
0
$0
Aggregated Statistics For Year 2005 (Based on 6 partial tracts)
A) FHA, FSA/RHS & VA Home Purchase Loans
B) Conventional Home Purchase Loans
C) Refinancings
D) Home Improvement Loans
F) Non-occupant Loans on < 5 Family Dwellings (A B C & D)
G) Loans On Manufactured Home Dwelling (A B C & D)
Number
Average Value
Number
Average Value
Number
Average Value
Number
Average Value
Number
Average Value
Number
Average Value
LOANS ORIGINATED
5
$129,204
148
$107,561
272
$86,724
95
$40,155
28
$77,712
36
$56,560
APPLICATIONS APPROVED, NOT ACCEPTED
1
$51,590
17
$89,329
57
$90,603
18
$25,033
1
$214,960
10
$49,057
APPLICATIONS DENIED
0
$0
45
$87,326
226
$101,237
62
$40,924
11
$77,075
24
$44,501
APPLICATIONS WITHDRAWN
0
$0
17
$80,487
167
$112,406
22
$105,607
7
$88,161
7
$86,956
FILES CLOSED FOR INCOMPLETENESS
0
$0
2
$114,650
15
$125,943
3
$44,837
0
$0
0
$0
Aggregated Statistics For Year 2004 (Based on 6 partial tracts)
A) FHA, FSA/RHS & VA Home Purchase Loans
B) Conventional Home Purchase Loans
C) Refinancings
D) Home Improvement Loans
F) Non-occupant Loans on < 5 Family Dwellings (A B C & D)
G) Loans On Manufactured Home Dwelling (A B C & D)
Number
Average Value
Number
Average Value
Number
Average Value
Number
Average Value
Number
Average Value
Number
Average Value
LOANS ORIGINATED
8
$105,311
132
$110,032
288
$90,329
89
$30,797
29
$83,519
15
$55,157
APPLICATIONS APPROVED, NOT ACCEPTED
1
$92,690
14
$121,462
80
$80,426
15
$43,815
2
$152,620
7
$32,960
APPLICATIONS DENIED
1
$46,530
24
$78,296
220
$103,607
49
$31,452
5
$58,546
15
$59,457
APPLICATIONS WITHDRAWN
0
$0
7
$99,150
154
$102,272
8
$43,988
1
$75,240
0
$0
FILES CLOSED FOR INCOMPLETENESS
0
$0
3
$68,500
28
$112,791
4
$57,315
1
$9,620
1
$114,210
Aggregated Statistics For Year 2003 (Based on 6 partial tracts)
A) FHA, FSA/RHS & VA Home Purchase Loans
B) Conventional Home Purchase Loans
C) Refinancings
D) Home Improvement Loans
F) Non-occupant Loans on < 5 Family Dwellings (A B C & D)
Number
Average Value
Number
Average Value
Number
Average Value
Number
Average Value
Number
Average Value
LOANS ORIGINATED
9
$98,147
114
$95,808
512
$96,322
74
$23,271
21
$86,675
APPLICATIONS APPROVED, NOT ACCEPTED
0
$0
5
$69,692
90
$96,475
8
$39,418
5
$59,054
APPLICATIONS DENIED
0
$0
29
$65,871
228
$95,190
30
$23,967
3
$107,623
APPLICATIONS WITHDRAWN
0
$0
13
$111,678
118
$97,712
4
$42,442
2
$81,760
FILES CLOSED FOR INCOMPLETENESS
0
$0
3
$82,600
16
$100,067
5
$35,832
1
$34,390
Aggregated Statistics For Year 2002 (Based on 6 partial tracts)
A) FHA, FSA/RHS & VA Home Purchase Loans
B) Conventional Home Purchase Loans
C) Refinancings
D) Home Improvement Loans
F) Non-occupant Loans on < 5 Family Dwellings (A B C & D)
Number
Average Value
Number
Average Value
Number
Average Value
Number
Average Value
Number
Average Value
LOANS ORIGINATED
6
$94,623
113
$85,602
328
$88,623
72
$29,701
23
$78,786
APPLICATIONS APPROVED, NOT ACCEPTED
2
$65,035
13
$56,535
63
$81,372
15
$18,359
1
$34,100
APPLICATIONS DENIED
3
$65,290
28
$42,963
143
$83,093
21
$22,771
2
$97,715
APPLICATIONS WITHDRAWN
1
$117,150
8
$113,159
69
$97,383
3
$57,437
1
$8,740
FILES CLOSED FOR INCOMPLETENESS
0
$0
0
$0
15
$88,370
0
$0
3
$93,760
Aggregated Statistics For Year 2001 (Based on 6 partial tracts)
A) FHA, FSA/RHS & VA Home Purchase Loans
B) Conventional Home Purchase Loans
C) Refinancings
D) Home Improvement Loans
F) Non-occupant Loans on < 5 Family Dwellings (A B C & D)
Number
Average Value
Number
Average Value
Number
Average Value
Number
Average Value
Number
Average Value
LOANS ORIGINATED
13
$93,840
122
$86,407
273
$75,664
86
$25,926
18
$60,363
APPLICATIONS APPROVED, NOT ACCEPTED
1
$63,830
21
$54,416
56
$75,538
13
$33,838
2
$71,145
APPLICATIONS DENIED
2
$55,545
45
$43,859
104
$77,315
34
$27,120
2
$21,330
APPLICATIONS WITHDRAWN
0
$0
6
$96,097
62
$94,782
5
$18,086
3
$73,307
FILES CLOSED FOR INCOMPLETENESS
0
$0
0
$0
6
$94,160
1
$11,370
0
$0
Aggregated Statistics For Year 2000 (Based on 6 partial tracts)
A) FHA, FSA/RHS & VA Home Purchase Loans
B) Conventional Home Purchase Loans
C) Refinancings
D) Home Improvement Loans
F) Non-occupant Loans on < 5 Family Dwellings (A B C & D)
Number
Average Value
Number
Average Value
Number
Average Value
Number
Average Value
Number
Average Value
LOANS ORIGINATED
13
$77,215
74
$75,091
95
$62,165
102
$19,144
12
$44,143
APPLICATIONS APPROVED, NOT ACCEPTED
2
$47,655
11
$79,155
29
$58,749
6
$16,153
2
$27,330
APPLICATIONS DENIED
1
$64,490
44
$54,092
71
$54,778
22
$23,679
6
$80,917
APPLICATIONS WITHDRAWN
0
$0
7
$114,534
47
$64,332
2
$13,555
4
$138,602
FILES CLOSED FOR INCOMPLETENESS
0
$0
0
$0
12
$44,241
2
$26,990
1
$62,960
Aggregated Statistics For Year 1999 (Based on 3 partial tracts)
A) FHA, FSA/RHS & VA Home Purchase Loans
B) Conventional Home Purchase Loans
C) Refinancings
D) Home Improvement Loans
F) Non-occupant Loans on < 5 Family Dwellings (A B C & D)


 Nearest zip codes: 17763, 17728, 17765, 16930, 17754, 17701.