Estimated zip code population in 2022: 10,213 Zip code population in 2010: 10,042 Zip code population in 2000: 9,583
Houses and condos: 4,472 Renter-occupied apartments: 1,207
% of renters here:
30%
State:
31%
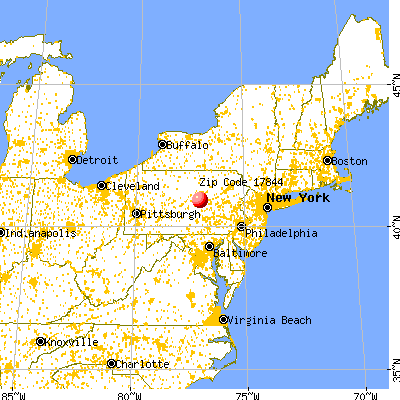
March 2022 cost of living index in zip code 17844: 92.9 (less than average, U.S. average is 100)
Land area: 112.1 sq. mi. Water area: 0.4 sq. mi.
Population density: 91 people per square mile
(very low).
OSM Map
General Map
Google Map
MSN Map
OSM Map
General Map
Google Map
MSN Map
OSM Map
General Map
Google Map
MSN Map
OSM Map
General Map
Google Map
MSN Map
Please wait while loading the map...
Real estate property taxes paid for housing units in 2022:
This zip code:
1.0% ($2,218)
Pennsylvania:
1.3% ($3,094)
Median real estate property taxes paid for housing units with mortgages in 2022: $2,219 (1.0%) Median real estate property taxes paid for housing units with no mortgage in 2022: $2,216 (1.0%)
Estimated median house/condo value in 2022: $223,251
17844:
$223,251
Pennsylvania:
$245,500
According to our research of Pennsylvania and other state lists, there were 11 registered sex offenders living in 17844 zip code as of June 03, 2024. The ratio of all residents to sex offenders in zip code 17844 is 963 to 1. The ratio of registered sex offenders to all residents in this zip code is lower than the state average.
Median resident age:
This zip code:
37.3 years
Pennsylvania median age:
40.9 years
Average household size:
This zip code:
2.6 people
Pennsylvania:
2.4 people
Averages for the 2020 tax year for zip code 17844, filed in 2021:
Average Adjusted Gross Income (AGI) in 2020: $59,285 (Individual Income Tax Returns)
Here:
$59,285
State:
$75,707
Salary/wage: $47,430 (reported on 75.8% of returns)
Here:
$47,430
State:
$62,806
(% of AGI for various income ranges: 1158.3% for AGIs below $25k, 3576.3% for AGIs $25k-50k, 6482.3% for AGIs $50k-75k, 8978.4% for AGIs $75k-100k, 15006.1% for AGIs $100k-200k, 98010.0% for AGIs over 200k)
Taxable interest for individuals: $1,573 (reported on 38.2% of returns)
This zip code:
$1,573
Pennsylvania:
$1,633
(% of AGI for various income ranges: 36.0% for AGIs below $25k, 44.4% for AGIs $25k-50k, 75.0% for AGIs $50k-75k, 59.7% for AGIs $75k-100k, 155.2% for AGIs $100k-200k, 5405.0% for AGIs over 200k)
Ordinary dividends: $4,505 (reported on 17.9% of returns)
Here:
$4,505
State:
$7,382
(% of AGI for various income ranges: 38.8% for AGIs below $25k, 30.7% for AGIs $25k-50k, 93.8% for AGIs $50k-75k, 126.2% for AGIs $75k-100k, 409.4% for AGIs $100k-200k, 5010.0% for AGIs over 200k)
Net capital gain/loss in AGI: +$9,508 (reported on 16.2% of returns)
Here:
+$9,508
State:
+$23,522
(% of AGI for various income ranges: 15.2% for AGIs below $25k, 59.7% for AGIs $25k-50k, 170.8% for AGIs $50k-75k, 126.2% for AGIs $75k-100k, 585.8% for AGIs $100k-200k, 17480.0% for AGIs over 200k)
Profit/loss from business: +$18,644 (reported on 17.9% of returns)
Here:
+$18,644
State:
+$16,274
(% of AGI for various income ranges: 163.2% for AGIs below $25k, 234.6% for AGIs $25k-50k, 559.6% for AGIs $50k-75k, 502.2% for AGIs $75k-100k, 1216.1% for AGIs $100k-200k, 19920.0% for AGIs over 200k)
Taxable individual retirement arrangement distribution: $13,251 (reported on 11.1% of returns)
17844:
$13,251
Pennsylvania:
$18,583
(% of AGI for various income ranges: 87.4% for AGIs below $25k, 142.4% for AGIs $25k-50k, 261.9% for AGIs $50k-75k, 332.5% for AGIs $75k-100k, 519.1% for AGIs $100k-200k, 4675.0% for AGIs over 200k)
Total itemized deductions: $31,735 (reported on 3.6% of returns)
Here:
$31,735
State:
$34,850
(% of AGI for various income ranges: 67.4% for AGIs below $25k, 256.2% for AGIs $50k-75k, 613.9% for AGIs $100k-200k, 7660.0% for AGIs over 200k)
Charity contributions: $14,569 (reported on 2.7% of returns)
Here:
$14,569
State:
$12,392
(% of AGI for various income ranges: 71.2% for AGIs $50k-75k, 267.9% for AGIs $100k-200k, 3340.0% for AGIs over 200k)
Taxes paid: $6,959 (reported on 3.6% of returns)
17844:
$6,959
State:
$8,200
(% of AGI for various income ranges: 9.8% for AGIs below $25k, 51.0% for AGIs $50k-75k, 146.1% for AGIs $100k-200k, 1840.0% for AGIs over 200k)
Earned income credit: $1,984 (reported on 11.6% of returns)
Here:
$1,984
State:
$2,100
(% of AGI for various income ranges: 69.0% for AGIs below $25k, 52.8% for AGIs $25k-50k)
Percentage of individuals using paid preparers for their 2020 taxes: 92.6%
Here:
93%
State:
92%
(% for various income ranges: 90.6% for AGIs below $25k, 93.5% for AGIs $25k-50k, 93.3% for AGIs $50k-75k, 93.8% for AGIs $75k-100k, 94.9% for AGIs $100k-200k, 90.9% for AGIs over 200k)
Averages for the 2012 tax year for zip code 17844, filed in 2013:
Average Adjusted Gross Income (AGI) in 2012: $45,504 (Individual Income Tax Returns)
Here:
$45,504
State:
$61,346
Salary/wage: $37,978 (reported on 78.5% of returns)
Here:
$37,978
State:
$51,902
(% of AGI for various income ranges: 65.6% for AGIs below $25k, 72.8% for AGIs $25k-50k, 73.4% for AGIs $50k-75k, 71.6% for AGIs $75k-100k, 64.8% for AGIs $100k-200k, 28.9% for AGIs over 200k)
Taxable interest for individuals: $1,034 (reported on 38.1% of returns)
This zip code:
$1,034
Pennsylvania:
$1,588
(% of AGI for various income ranges: 2.1% for AGIs below $25k, 1.0% for AGIs $25k-50k, 0.7% for AGIs $50k-75k, 0.5% for AGIs $75k-100k, 0.6% for AGIs $100k-200k, 0.8% for AGIs over 200k)
Ordinary dividends: $3,115 (reported on 18.9% of returns)
Here:
$3,115
State:
$5,827
(% of AGI for various income ranges: 1.8% for AGIs below $25k, 1.2% for AGIs $25k-50k, 1.1% for AGIs $50k-75k, 1.1% for AGIs $75k-100k, 1.4% for AGIs $100k-200k, 1.5% for AGIs over 200k)
Net capital gain/loss in AGI: +$8,110 (reported on 14.4% of returns)
Here:
+$8,110
State:
+$14,495
(% of AGI for various income ranges: 0.4% for AGIs below $25k, 1.0% for AGIs $25k-50k, 0.9% for AGIs $50k-75k, 1.3% for AGIs $75k-100k, 3.0% for AGIs $100k-200k, 11.8% for AGIs over 200k)
Profit/loss from business: +$14,762 (reported on 16.6% of returns)
Here:
+$14,762
State:
+$16,268
(% of AGI for various income ranges: 7.9% for AGIs below $25k, 5.1% for AGIs $25k-50k, 5.2% for AGIs $50k-75k, 4.5% for AGIs $75k-100k, 4.7% for AGIs $100k-200k, 6.3% for AGIs over 200k)
Taxable individual retirement arrangement distribution: $10,265 (reported on 10.3% of returns)
17844:
$10,265
Pennsylvania:
$14,550
(% of AGI for various income ranges: 3.4% for AGIs below $25k, 2.1% for AGIs $25k-50k, 2.1% for AGIs $50k-75k, 2.2% for AGIs $75k-100k, 3.7% for AGIs $100k-200k)
Total itemized deductions: $18,735 (20% of AGI, reported on 20.9% of returns)
Here:
$18,735
State:
$23,538
Here:
20.0% of AGI
State:
18.4% of AGI
(% of AGI for various income ranges: 5.1% for AGIs below $25k, 6.2% for AGIs $25k-50k, 7.6% for AGIs $50k-75k, 9.8% for AGIs $75k-100k, 12.1% for AGIs $100k-200k, 10.3% for AGIs over 200k)
Charity contributions: $5,376 (reported on 15.3% of returns)
Here:
$5,376
State:
$4,025
(% of AGI for various income ranges: 0.5% for AGIs below $25k, 1.0% for AGIs $25k-50k, 1.5% for AGIs $50k-75k, 1.8% for AGIs $75k-100k, 2.6% for AGIs $100k-200k, 4.0% for AGIs over 200k)
Taxes paid: $6,959 (reported on 20.9% of returns)
17844:
$6,959
State:
$9,982
(% of AGI for various income ranges: 0.8% for AGIs below $25k, 1.8% for AGIs $25k-50k, 2.6% for AGIs $50k-75k, 3.7% for AGIs $75k-100k, 5.2% for AGIs $100k-200k, 4.8% for AGIs over 200k)
Earned income credit: $1,959 (reported on 15.3% of returns)
Here:
$1,959
State:
$2,106
(% of AGI for various income ranges: 4.1% for AGIs below $25k, 1.1% for AGIs $25k-50k)
Percentage of individuals using paid preparers for their 2012 taxes: 60.6%
Here:
61%
State:
53%
(% for various income ranges: 55.2% for AGIs below $25k, 61.7% for AGIs $25k-50k, 65.8% for AGIs $50k-75k, 65.1% for AGIs $75k-100k, 67.7% for AGIs $100k-200k, 83.3% for AGIs over 200k)
Averages for the 2004 tax year for zip code 17844, filed in 2005:
Average Adjusted Gross Income (AGI) in 2004: $37,392 (Individual Income Tax Returns)
Here:
$37,392
State:
$48,049
Salary/wage: $33,037 (reported on 79.7% of returns)
Here:
$33,037
State:
$42,646
(% of AGI for various income ranges: 109.9% for AGIs below $10k, 65.0% for AGIs $10k-25k, 77.4% for AGIs $25k-50k, 80.1% for AGIs $50k-75k, 77.7% for AGIs $75k-100k, 44.4% for AGIs over 100k)
Taxable interest for individuals: $1,284 (reported on 51.4% of returns)
This zip code:
$1,284
Pennsylvania:
$1,657
(% of AGI for various income ranges: 8.2% for AGIs below $10k, 3.3% for AGIs $10k-25k, 1.6% for AGIs $25k-50k, 0.9% for AGIs $50k-75k, 1.1% for AGIs $75k-100k, 2.1% for AGIs over 100k)
Taxable dividends: $3,133 (reported on 22.1% of returns)
Here:
$3,133
State:
$3,566
(% of AGI for various income ranges: 7.3% for AGIs below $10k, 1.9% for AGIs $10k-25k, 1.2% for AGIs $25k-50k, 1.0% for AGIs $50k-75k, 1.5% for AGIs $75k-100k, 3.5% for AGIs over 100k)
Net capital gain/loss: +$6,044 (reported on 17.4% of returns)
Here:
+$6,044
State:
+$9,716
(% of AGI for various income ranges: -1.3% for AGIs below $10k, 0.7% for AGIs $10k-25k, 0.9% for AGIs $25k-50k, 1.4% for AGIs $50k-75k, 2.0% for AGIs $75k-100k, 9.0% for AGIs over 100k)
Profit/loss from business: +$11,456 (reported on 18.0% of returns)
Here:
+$11,456
State:
+$14,267
(% of AGI for various income ranges: 9.6% for AGIs below $10k, 9.0% for AGIs $10k-25k, 4.9% for AGIs $25k-50k, 3.5% for AGIs $50k-75k, 3.2% for AGIs $75k-100k, 7.9% for AGIs over 100k)
Profit/loss from farming: +$9,630 (reported on 4.2% of returns)
Here:
+$9,630
State:
+$274
(% of AGI for various income ranges: -7.5% for AGIs below $10k, 0.6% for AGIs $10k-25k, 2.1% for AGIs $25k-50k, 2.4% for AGIs $50k-75k, -0.1% for AGIs $75k-100k)
IRA payment deduction: $2,602 (reported on 2.5% of returns)
17844:
$2,602
Pennsylvania:
$2,903
(% of AGI for various income ranges: 0.3% for AGIs $10k-25k, 0.1% for AGIs $25k-50k, 0.2% for AGIs $50k-75k, 0.3% for AGIs $75k-100k)
Self-employed pension: $11,833 (reported on 0.4% of returns)
Here:
$11,833
Pennsylvania:
$14,674
Total itemized deductions: $15,283 (20% of AGI, reported on 22.2% of returns)
Here:
$15,283
State:
$18,804
Here:
20.1% of AGI
State:
19.5% of AGI
(% of AGI for various income ranges: 13.1% for AGIs below $10k, 6.3% for AGIs $10k-25k, 7.0% for AGIs $25k-50k, 9.6% for AGIs $50k-75k, 13.5% for AGIs $75k-100k, 9.5% for AGIs over 100k)
Charity contributions deductions: $3,524 (4% of AGI, reported on 18.1% of returns)
Here:
$3,524
State:
$3,337
Here:
4.2% of AGI
State:
3.3% of AGI
(% of AGI for various income ranges: 0.7% for AGIs $10k-25k, 1.0% for AGIs $25k-50k, 1.7% for AGIs $50k-75k, 2.3% for AGIs $75k-100k, 2.8% for AGIs over 100k)
Total tax: $5,027 (reported on 73.9% of returns)
17844:
$5,027
State:
$8,008
(% of AGI for various income ranges: 3.9% for AGIs below $10k, 4.8% for AGIs $10k-25k, 6.4% for AGIs $25k-50k, 7.8% for AGIs $50k-75k, 9.9% for AGIs $75k-100k, 20.3% for AGIs over 100k)
Earned income credit: $1,538 (reported on 13.2% of returns)
Here:
$1,538
State:
$1,643
Percentage of individuals using paid preparers for their 2004 taxes: 65.0%
Here:
65%
State:
56%
(% for various income ranges: 57.9% for AGIs below $10k, 67.2% for AGIs $10k-25k, 66.9% for AGIs $25k-50k, 67.5% for AGIs $50k-75k, 59.5% for AGIs $75k-100k, 75.6% for AGIs over 100k)
Household received Food Stamps/SNAP in the past 12 months: 400 Household did not receive Food Stamps/SNAP in the past 12 months: 3,565
Women who had a birth in the past 12 months: 142 (146 now married, 5 unmarried) Women who did not have a birth in the past 12 months: 1,996 (996 now married, 993 unmarried)
Housing units in zip code 17844 with a mortgage: 1,453 (134 second mortgage, 1 home equity loan, 107 both second mortgage and home equity loan) Houses without a mortgage: 102
Median monthly owner costs for units with a mortgage: $1,343 Median monthly owner costs for units without a mortgage: $514
Residents with income below the poverty level in 2022:
This zip code:
7.2%
Whole state:
11.8%
Residents with income below 50% of the poverty level in 2022:
This zip code:
4.1%
Whole state:
6.1%
Median number of rooms in houses and condos:
Here:
6.3
State:
6.8
Median number of rooms in apartments:
Here:
5.1
State:
4.3
Notable locations in this zip code not listed on our city pages
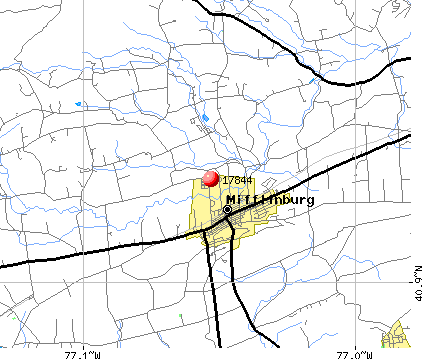
Notable locations in zip code 17844: Park Overlook (A), Mount Luther Camp (B), Stone Haven Camp (C), Sand Spring Camp (D), Mile Run Camp (E), Mifflinburg Hose Company 1 (F). Display/hide their locations on the map
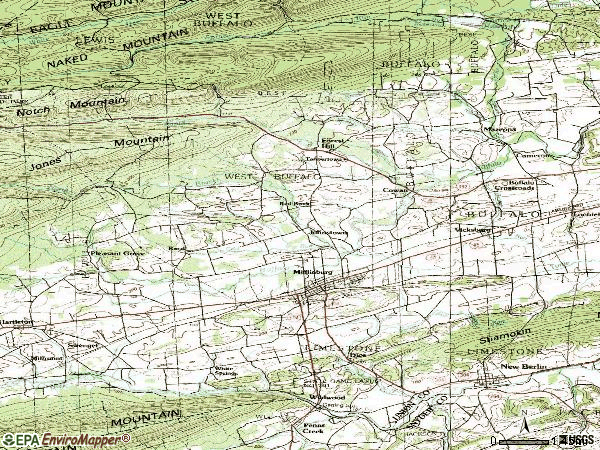
Streams, rivers, and creeks: North Branch Buffalo Creek (A), Rapid Run (B), Turkey Run (C), Sweitzers Run (D), Stony Run (E), Halfway Run (F), Mile Run (G), Coal Run (H), Sand Spring Run (I). Display/hide their locations on the map
Parks in zip code 17844 include: Sand Bridge State Park (1), State Game Lands Number 201 (2), Raymond B Winter State Park (3). Display/hide their locations on the map
2,011 married couples with children.
408 single-parent households (106 men, 302 women).
86.9% of residents of 17844 zip code speak English at home.
0.3% of residents speak Spanish at home (91% very well, 9% not well).
12.2% of residents speak other Indo-European language at home (82% very well, 17% well, 1% not well).
Foreign born population: 56 (0.6%) (78.5% of them are naturalized citizens)
This zip code:
0.6%
Whole state:
7.5%
25%France
18%Syria
14%Serbia
11%Argentina
4%Japan
50%German
13%American
7%English
5%Swiss
4%Italian
3%Russian
2%Pennsylvania German
Year of entry for the foreign-born population
142010 or later
222000 to 2009
41990 to 1999
25Before 1990
Facilities with environmental interests located in this zip code:
BALTIMORE & OHIO RR CO (MILE POST 266 in COWAN, PA)
B Z MOTORS C-P INC (RD 2 ROUTE 45 in MIFFLINBURG, PA)
Small Quantity Generators, between 100 kg and 1000 kg of hazardous waste/month (Resource Conservation and Recovery Act (tracking hazardous waste)) - notification Organizations: OPERNAME (CONTACT/OPERATOR)
, AIKEY, ROGER & REBER, CHARLES (CONTACT/OWNER)
BINGS AUTO BODY (195 N THIRD ST in MIFFLINBURG, PA)
Conditionally Exempt Small Quantity Generators, less than 100 kg/month of hazardous waste (Resource Conservation and Recovery Act (tracking hazardous waste)) - notification Organizations: OPERNAME (CONTACT/OPERATOR)
, BOTTIGER DONALD P (CONTACT/OWNER)
Housing units lacking complete plumbing facilities: 2.5% Housing units lacking complete kitchen facilities: 2.9%
40.0%Electricity
36.4%Fuel oil, kerosene, etc.
10.8%Wood
6.7%Bottled, tank, or LP gas
3.0%Coal or coke
1.8%Utility gas
0.6%No fuel used
0.6%Solar energy
Population in 1990: 8,379. Population change in the 1990s: +1,204 (+14.4%).
Place of birth for U.S.-born residents:
This state: 9,036
Northeast: 334
Midwest: 192
South: 340
West: 170
67% of the 17844 zip code residents lived in the same house 5 years ago. Out of people who lived in different houses, 62% lived in this county. Out of people who lived in different counties, 50% lived in Pennsylvania.
94% of the 17844 zip code residents lived in the same house 1 year ago. Out of people who lived in different houses, 43% moved from this county. Out of people who lived in different houses, 45% moved from different county within same state. Out of people who lived in different houses, 15% moved from different state.
Private vs. public school enrollment:
Students in private schools in grades 1 to 8 (elementary and middle school): 249
Here:
22.8%
Pennsylvania:
15.7%
Students in private schools in grades 9 to 12 (high school): 102
Here:
24.5%
Pennsylvania:
13.4%
Students in private undergraduate colleges: 29
Here:
13.0%
Pennsylvania:
39.8%
Occupation by median earnings in the past 12 months ($)
125,013Architecture and engineering occupations
91,517Law enforcement workers including supervisors
83,584Business and financial operations occupations
72,510Transportation occupations
67,836Computer and mathematical occupations
63,277Management occupations
Top industries in this zip code by the number of employees in 2005:
Health Care and Social Assistance: Offices of Physicians (except Mental Health Specialists) (50-99: 1, 5-9: 1)
Other Services (except Public Administration): Religious Organizations (20-49: 1, 10-19: 1, 5-9: 2, 1-4: 7)
Health Care and Social Assistance: Child Day Care Services (20-49: 2, 5-9: 1)
Fatal accident statistics in 2014:
Fatal accident count: 2
Vehicles involved in fatal accidents: 3
Fatal accidents caused by drunken drivers: 1
Fatalities: 2
Persons involved in fatal accidents: 3
Pedestrians involved in fatal accidents: 0
Fatal accident statistics in 2013:
Fatal accident count: 1
Vehicles involved in fatal accidents: 2
Fatal accidents caused by drunken drivers: 0
Fatalities: 1
Persons involved in fatal accidents: 5
Pedestrians involved in fatal accidents: 0
2007 - 2018 National Fire Incident Reporting System (NFIRS) incidents
Based on the data from the years 2007 - 2018 the average number of fire incidents per year is 18. The highest number of fires - 45 took place in 2016, and the least - 1 in 2013. The data has a dropping trend.
When looking into fire subcategories, the most incidents belonged to: Structure Fires (49.5%), and Outside Fires (29.0%).
Fire incident types reported to NFIRS in Zip Code 17844


 Nearest zip codes: 17880, 17829, 17862, 17837, 17855, 17810.


 Based on the data from the years 2007 - 2018 the average number of fire incidents per year is 18. The highest number of fires - 45 took place in 2016, and the least - 1 in 2013. The data has a dropping trend.
 When looking into fire subcategories, the most incidents belonged to: Structure Fires (49.5%), and Outside Fires (29.0%).