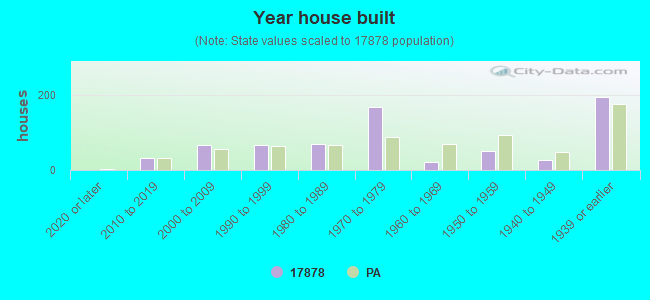
Estimated zip code population in 2022: 1,531 Zip code population in 2010: 1,528 Zip code population in 2000: 1,262
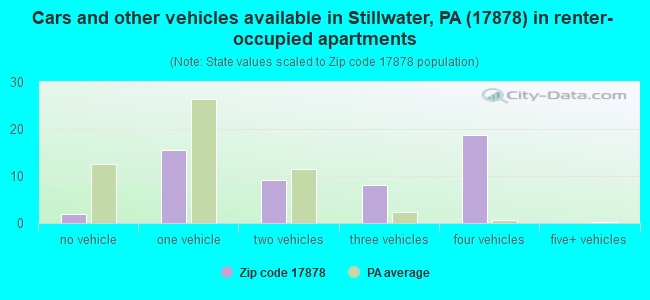
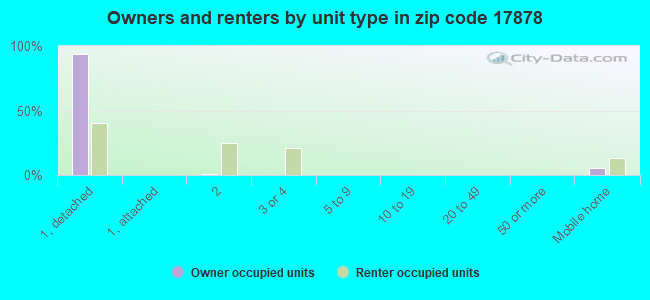
Houses and condos: 701 Renter-occupied apartments: 53
% of renters here:
9%
State:
31%
March 2022 cost of living index in zip code 17878: 90.9 (less than average, U.S. average is 100)
Land area: 21.1 sq. mi. Water area: 0.2 sq. mi.
Population density: 73 people per square mile
(very low).
OSM Map
General Map
Google Map
MSN Map
OSM Map
General Map
Google Map
MSN Map
OSM Map
General Map
Google Map
MSN Map
OSM Map
General Map
Google Map
MSN Map
Please wait while loading the map...
Real estate property taxes paid for housing units in 2022:
This zip code:
1.2% ($2,388)
Pennsylvania:
1.3% ($3,094)
Median real estate property taxes paid for housing units with mortgages in 2022: $2,690 (1.2%) Median real estate property taxes paid for housing units with no mortgage in 2022: $2,039 (1.2%)
Business Search- 14 Million verified businesses
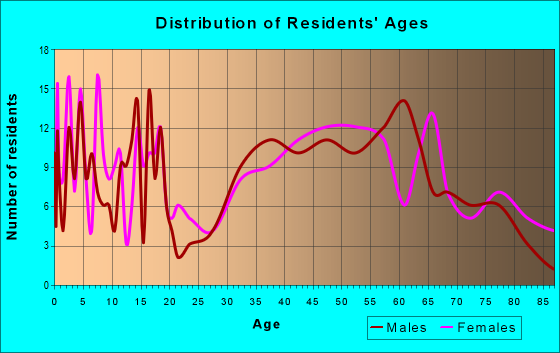
Males: 747
(48.8%)
Females: 784
(51.2%)
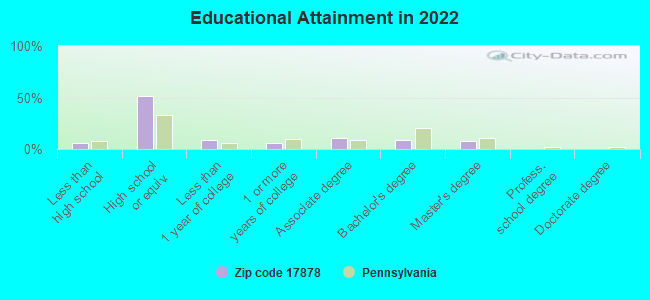
For population 25 years and over in 17878:
High school or higher: 93.7%
Bachelor's degree or higher: 17.2%
Graduate or professional degree: 8.2%
Unemployed: 1.0%
Mean travel time to work (commute): 30.2 minutes
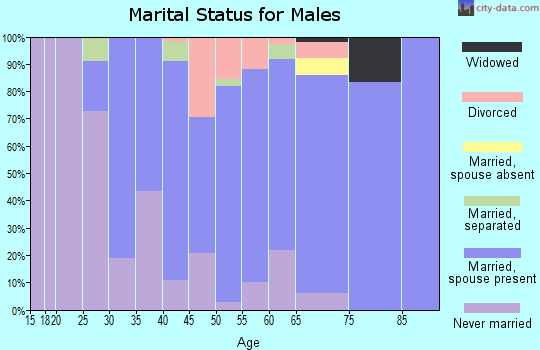
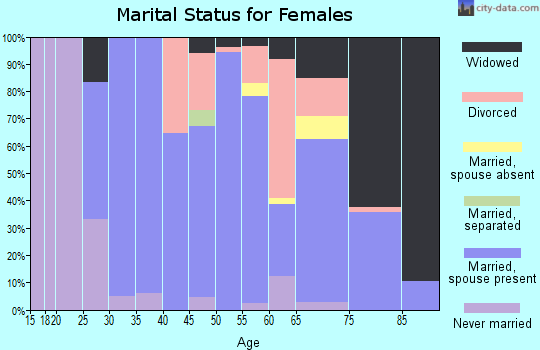
For population 15 years and over in 17878:
Never married: 18.6%
Now married: 65.8%
Separated: 1.3%
Widowed: 6.3%
Divorced: 8.0%
Zip code 17878 compared to state average:
Unemployed percentage significantly below state average.
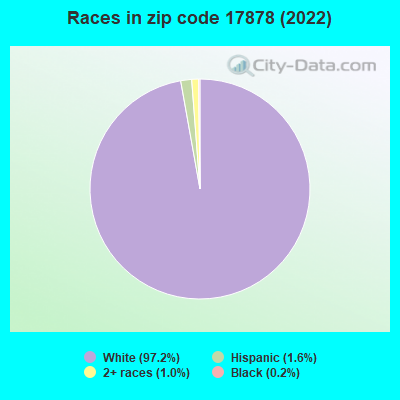
Black race population percentage significantly below state average.
Hispanic race population percentage significantly below state average.
Median age significantly above state average.
Foreign-born population percentage significantly below state average.
Renting percentage significantly below state average.
Length of stay since moving in above state average.
Number of college students below state average.
Percentage of population with a bachelor's degree or higher below state average.
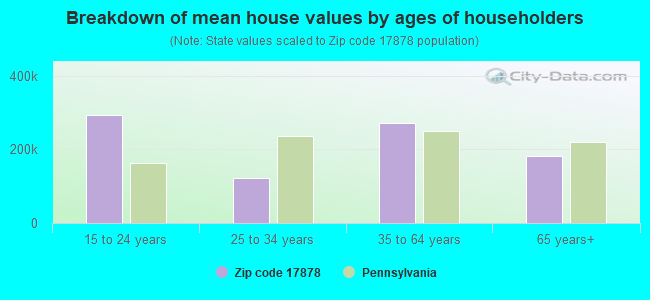
Estimated median house/condo value in 2022: $201,002
17878:
$201,002
Pennsylvania:
$245,500
According to our research of Pennsylvania and other state lists, there were 2 registered sex offenders living in 17878 zip code as of May 20, 2024. The ratio of all residents to sex offenders in zip code 17878 is 690 to 1. The ratio of registered sex offenders to all residents in this zip code is near the state average.
Median resident age:
This zip code:
50.5 years
Pennsylvania median age:
40.9 years
Average household size:
This zip code:
2.4 people
Pennsylvania:
2.4 people
Averages for the 2020 tax year for zip code 17878, filed in 2021:
Average Adjusted Gross Income (AGI) in 2020: $57,760 (Individual Income Tax Returns)
Here:
$57,760
State:
$75,707
Salary/wage: $52,586 (reported on 78.7% of returns)
Here:
$52,586
State:
$62,806
(% of AGI for various income ranges: 973.8% for AGIs below $25k, 3166.9% for AGIs $25k-50k, 6361.1% for AGIs $50k-75k, 9108.3% for AGIs $75k-100k, 18872.9% for AGIs $100k-200k)
Taxable interest for individuals: $550 (reported on 32.0% of returns)
This zip code:
$550
Pennsylvania:
$1,633
(% of AGI for various income ranges: 38.8% for AGIs below $25k, 13.1% for AGIs $25k-50k, 20.0% for AGIs $50k-75k, 11.7% for AGIs $75k-100k, 34.3% for AGIs $100k-200k)
Ordinary dividends: $1,933 (reported on 20.0% of returns)
Here:
$1,933
State:
$7,382
(% of AGI for various income ranges: 35.6% for AGIs below $25k, 16.9% for AGIs $25k-50k, 58.9% for AGIs $50k-75k, 218.6% for AGIs $100k-200k)
Net capital gain/loss in AGI: +$2,430 (reported on 13.3% of returns)
Here:
+$2,430
State:
+$23,522
(% of AGI for various income ranges: 10.0% for AGIs below $25k, 49.4% for AGIs $25k-50k, 86.7% for AGIs $50k-75k, 100.0% for AGIs $100k-200k)
Profit/loss from business: +$13,900 (reported on 10.7% of returns)
Here:
+$13,900
State:
+$16,274
(% of AGI for various income ranges: 65.6% for AGIs below $25k, 231.2% for AGIs $25k-50k, 1061.7% for AGIs $75k-100k)
Taxable individual retirement arrangement distribution: $12,078 (reported on 12.0% of returns)
17878:
$12,078
Pennsylvania:
$18,583
(% of AGI for various income ranges: 101.2% for AGIs below $25k, 225.6% for AGIs $25k-50k, 940.0% for AGIs $75k-100k)
Total itemized deductions: $25,000 (reported on 2.7% of returns)
Here:
$25,000
State:
$34,850
(% of AGI for various income ranges: 555.6% for AGIs $50k-75k)
Taxes paid: $8,450 (reported on 2.7% of returns)
17878:
$8,450
State:
$8,200
(% of AGI for various income ranges: 187.8% for AGIs $50k-75k)
Earned income credit: $2,167 (reported on 12.0% of returns)
Here:
$2,167
State:
$2,100
(% of AGI for various income ranges: 56.2% for AGIs below $25k, 65.6% for AGIs $25k-50k)
Percentage of individuals using paid preparers for their 2020 taxes: 96.0%
Here:
96%
State:
92%
(% for various income ranges: 95.8% for AGIs below $25k, 94.7% for AGIs $25k-50k, 92.3% for AGIs $50k-75k, 100.0% for AGIs $75k-100k, 100.0% for AGIs $100k-200k)
Averages for the 2012 tax year for zip code 17878, filed in 2013:
Average Adjusted Gross Income (AGI) in 2012: $45,344 (Individual Income Tax Returns)
Here:
$45,344
State:
$61,346
Salary/wage: $42,061 (reported on 81.9% of returns)
Here:
$42,061
State:
$51,902
(% of AGI for various income ranges: 67.3% for AGIs below $25k, 76.8% for AGIs $25k-50k, 76.1% for AGIs $50k-75k, 76.8% for AGIs $75k-100k, 78.0% for AGIs $100k-200k)
Taxable interest for individuals: $438 (reported on 36.1% of returns)
This zip code:
$438
Pennsylvania:
$1,588
(% of AGI for various income ranges: 1.7% for AGIs below $25k, 0.3% for AGIs $25k-50k, 0.2% for AGIs $50k-75k, 0.2% for AGIs $75k-100k, 0.1% for AGIs $100k-200k)
Ordinary dividends: $981 (reported on 22.2% of returns)
Here:
$981
State:
$5,827
(% of AGI for various income ranges: 1.4% for AGIs below $25k, 0.6% for AGIs $25k-50k, 0.2% for AGIs $50k-75k, 0.2% for AGIs $75k-100k, 0.4% for AGIs $100k-200k)
Net capital gain/loss in AGI: +$300 (reported on 12.5% of returns)
Here:
+$300
State:
+$14,495
(% of AGI for various income ranges: 0.1% for AGIs $25k-50k, 0.6% for AGIs $75k-100k)
Profit/loss from business: +$8,344 (reported on 12.5% of returns)
Here:
+$8,344
State:
+$16,268
(% of AGI for various income ranges: 4.7% for AGIs below $25k, 8.5% for AGIs $25k-50k, 0.9% for AGIs $75k-100k)
Taxable individual retirement arrangement distribution: $8,571 (reported on 9.7% of returns)
17878:
$8,571
Pennsylvania:
$14,550
Total itemized deductions: $16,959 (20% of AGI, reported on 23.6% of returns)
Here:
$16,959
State:
$23,538
Here:
20.2% of AGI
State:
18.4% of AGI
(% of AGI for various income ranges: 9.6% for AGIs $25k-50k, 9.0% for AGIs $50k-75k, 10.6% for AGIs $75k-100k, 10.3% for AGIs $100k-200k)
Charity contributions: $3,050 (reported on 16.7% of returns)
Here:
$3,050
State:
$4,025
(% of AGI for various income ranges: 1.0% for AGIs below $25k, 1.1% for AGIs $50k-75k, 1.9% for AGIs $75k-100k, 1.5% for AGIs $100k-200k)
Taxes paid: $6,344 (reported on 22.2% of returns)
17878:
$6,344
State:
$9,982
(% of AGI for various income ranges: 2.1% for AGIs $25k-50k, 2.5% for AGIs $50k-75k, 3.4% for AGIs $75k-100k, 5.2% for AGIs $100k-200k)
Earned income credit: $2,036 (reported on 15.3% of returns)
Here:
$2,036
State:
$2,106
(% of AGI for various income ranges: 4.4% for AGIs below $25k, 1.1% for AGIs $25k-50k)
Percentage of individuals using paid preparers for their 2012 taxes: 56.9%
Here:
57%
State:
53%
(% for various income ranges: 53.6% for AGIs below $25k, 55.6% for AGIs $25k-50k, 61.5% for AGIs $50k-75k, 66.7% for AGIs $75k-100k, 57.1% for AGIs $100k-200k)
Averages for the 2004 tax year for zip code 17878, filed in 2005:
Average Adjusted Gross Income (AGI) in 2004: $39,432 (Individual Income Tax Returns)
Here:
$39,432
State:
$48,049
Salary/wage: $35,597 (reported on 85.5% of returns)
Here:
$35,597
State:
$42,646
(% of AGI for various income ranges: 113.7% for AGIs below $10k, 70.6% for AGIs $10k-25k, 77.0% for AGIs $25k-50k, 82.5% for AGIs $50k-75k, 85.6% for AGIs $75k-100k, 61.5% for AGIs over 100k)
Taxable interest for individuals: $561 (reported on 53.2% of returns)
This zip code:
$561
Pennsylvania:
$1,657
(% of AGI for various income ranges: 7.1% for AGIs below $10k, 1.4% for AGIs $10k-25k, 0.9% for AGIs $25k-50k, 0.6% for AGIs $50k-75k, 0.4% for AGIs $75k-100k, 0.3% for AGIs over 100k)
Taxable dividends: $1,011 (reported on 27.9% of returns)
Here:
$1,011
State:
$3,566
(% of AGI for various income ranges: 3.3% for AGIs below $10k, 1.0% for AGIs $10k-25k, 1.0% for AGIs $25k-50k, 0.6% for AGIs $50k-75k, 0.4% for AGIs $75k-100k, 0.2% for AGIs over 100k)
Net capital gain/loss: +$1,626 (reported on 18.5% of returns)
Here:
+$1,626
State:
+$9,716
(% of AGI for various income ranges: -2.2% for AGIs below $10k, 3.1% for AGIs $10k-25k, 0.6% for AGIs $25k-50k, 0.7% for AGIs $50k-75k, 0.7% for AGIs $75k-100k)
Profit/loss from business: +$11,292 (reported on 14.5% of returns)
Here:
+$11,292
State:
+$14,267
(% of AGI for various income ranges: 16.7% for AGIs below $10k, 4.3% for AGIs $10k-25k, 7.2% for AGIs $25k-50k, 2.0% for AGIs $50k-75k, 5.3% for AGIs $75k-100k)
IRA payment deduction: $2,364 (reported on 1.7% of returns)
17878:
$2,364
Pennsylvania:
$2,903
Total itemized deductions: $14,832 (20% of AGI, reported on 23.3% of returns)
Here:
$14,832
State:
$18,804
Here:
19.7% of AGI
State:
19.5% of AGI
(% of AGI for various income ranges: 36.7% for AGIs below $10k, 8.6% for AGIs $25k-50k, 8.5% for AGIs $50k-75k, 12.6% for AGIs $75k-100k, 8.8% for AGIs over 100k)
Charity contributions deductions: $2,619 (3% of AGI, reported on 19.0% of returns)
Here:
$2,619
State:
$3,337
Here:
3.2% of AGI
State:
3.3% of AGI
(% of AGI for various income ranges: 1.4% for AGIs $25k-50k, 1.0% for AGIs $50k-75k, 2.3% for AGIs $75k-100k, 1.2% for AGIs over 100k)
Total tax: $5,191 (reported on 75.0% of returns)
17878:
$5,191
State:
$8,008
(% of AGI for various income ranges: 4.4% for AGIs below $10k, 3.9% for AGIs $10k-25k, 6.7% for AGIs $25k-50k, 8.2% for AGIs $50k-75k, 10.1% for AGIs $75k-100k, 21.9% for AGIs over 100k)
Earned income credit: $1,944 (reported on 10.8% of returns)
Here:
$1,944
State:
$1,643
Percentage of individuals using paid preparers for their 2004 taxes: 62.3%
Here:
62%
State:
56%
(% for various income ranges: 61.9% for AGIs below $10k, 63.5% for AGIs $10k-25k, 57.6% for AGIs $25k-50k, 62.8% for AGIs $50k-75k, 78.0% for AGIs $75k-100k, 63.6% for AGIs over 100k)
Household received Food Stamps/SNAP in the past 12 months: 43 Household did not receive Food Stamps/SNAP in the past 12 months: 549
Women who had a birth in the past 12 months: 8 (8 now married, 0 unmarried) Women who did not have a birth in the past 12 months: 243 (131 now married, 110 unmarried)
Housing units in zip code 17878 with a mortgage: 284 (66 second mortgage, 64 both second mortgage and home equity loan) Houses without a mortgage: 4
Median monthly owner costs for units with a mortgage: $1,377 Median monthly owner costs for units without a mortgage: $480
Residents with income below the poverty level in 2022:
This zip code:
7.8%
Whole state:
11.8%
Residents with income below 50% of the poverty level in 2022:
This zip code:
6.6%
Whole state:
6.1%
Median number of rooms in houses and condos:
Here:
6.7
State:
6.8
Median number of rooms in apartments:
Here:
4.9
State:
4.3
Notable locations in this zip code not listed on our city pages
In group quarters: 81 (-1 institutionalized population)
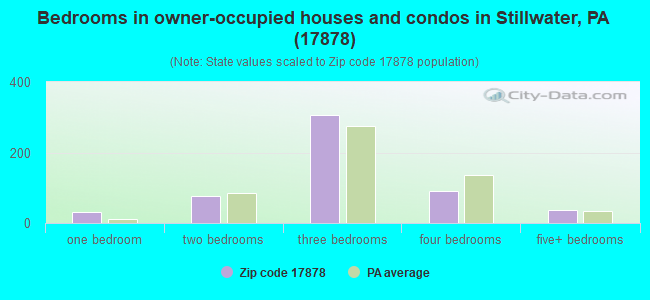
Size of family households: 292 2-persons, 85 3-persons, 85 4-persons, 26 5-persons, 5 7-or-more-persons
Size of nonfamily households: 78 1-person, 18 2-persons
219 married couples with children.
32 single-parent households (11 men, 21 women).
98.5% of residents of 17878 zip code speak English at home.
0.9% of residents speak Spanish at home (100% very well).
0.4% of residents speak other Indo-European language at home (100% very well).
0.1% of residents speak Asian or Pacific Island language at home (100% very well).
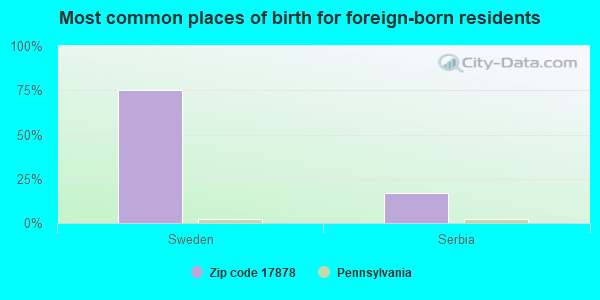
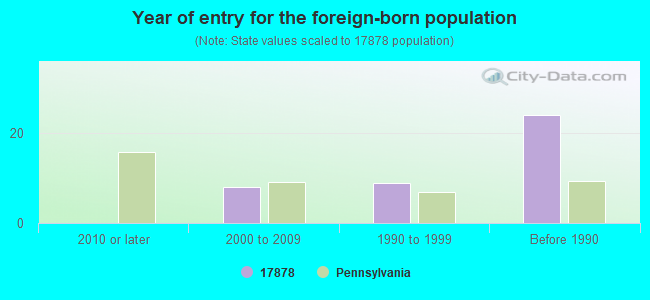
Foreign born population: 12 (0.8%) (17.2% of them are naturalized citizens)
This zip code:
0.8%
Whole state:
7.5%
75%Sweden
17%Serbia
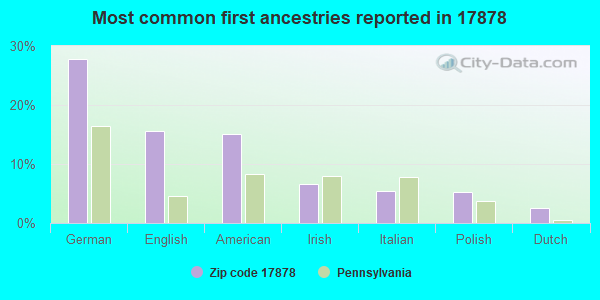
28%German
16%English
15%American
7%Irish
5%Italian
5%Polish
3%Dutch
Year of entry for the foreign-born population
02010 or later
82000 to 2009
91990 to 1999
24Before 1990
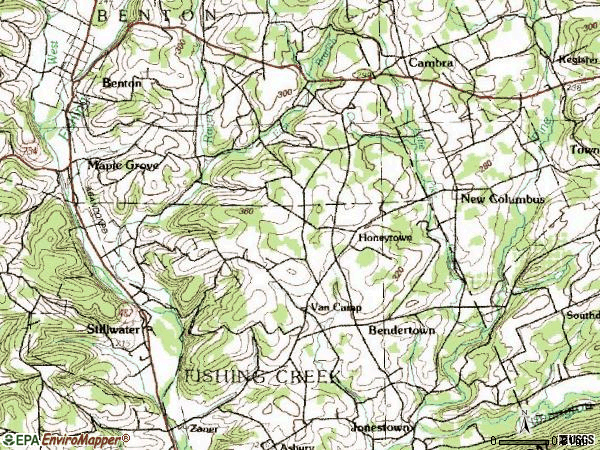
Facilities with environmental interests located in this zip code:
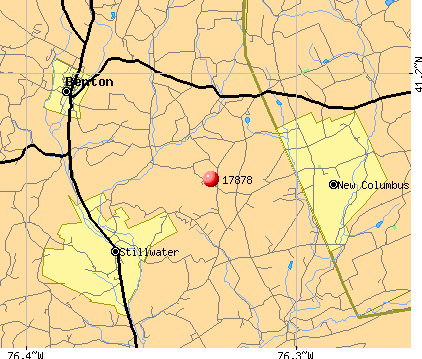
BENTON PROC PLT (ST RT 487 NORTH in STILLWATER, PA)
AIR MINOR (AIRS/AFS) STATE MASTER (Pennsylvania database) - AFS-23-3045580-1, AIR PROGRAM Business SIC classification: CONSTRUCTION SAND AND GRAVEL Organizations: SOKOL QUARRIES, INC. (OWNER/OPERATOR)
Alternative names: SOKOL QUARRIES/BENTON PROCESSING PLT
Housing units lacking complete plumbing facilities: 4.7% Housing units lacking complete kitchen facilities: 5.2%
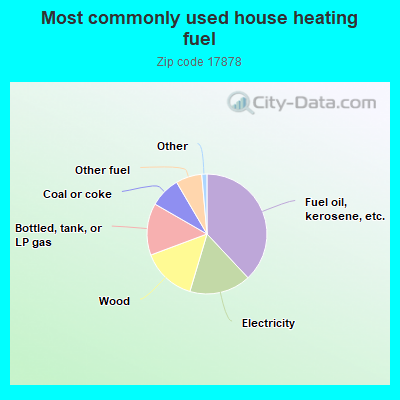
38.3%Fuel oil, kerosene, etc.
16.7%Electricity
14.8%Wood
14.1%Bottled, tank, or LP gas
8.3%Coal or coke
7.1%Other fuel
0.7%Utility gas
0.7%No fuel used
Population in 1990: 523. Population change in the 1990s: +739 (+141.3%).
Place of birth for U.S.-born residents:
This state: 1,294
Northeast: 79
Midwest: 22
South: 71
West: 7
64% of the 17878 zip code residents lived in the same house 5 years ago. Out of people who lived in different houses, 55% lived in this county. Out of people who lived in different counties, 50% lived in Pennsylvania.
93% of the 17878 zip code residents lived in the same house 1 year ago. Out of people who lived in different houses, 86% moved from this county. Out of people who lived in different houses, 4% moved from different county within same state. Out of people who lived in different houses, 8% moved from different state.
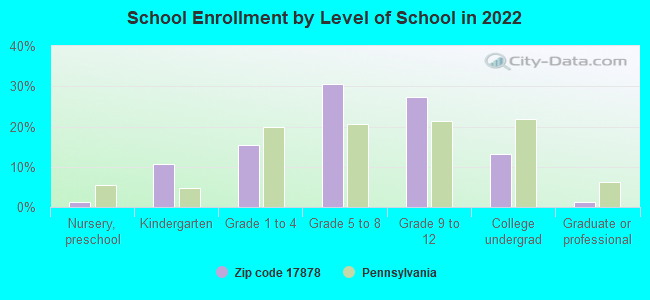
Private vs. public school enrollment:
Students in private schools in grades 1 to 8 (elementary and middle school): 9
Here:
9.1%
Pennsylvania:
15.7%
Students in private schools in grades 9 to 12 (high school): 8
Here:
14.1%
Pennsylvania:
13.4%
Students in private undergraduate colleges: 2
Here:
6.6%
Pennsylvania:
39.8%
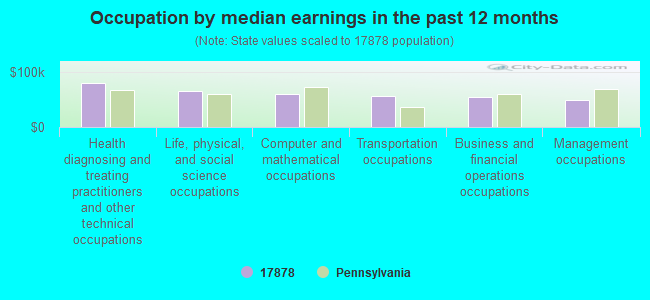
Occupation by median earnings in the past 12 months ($)
80,136Health diagnosing and treating practitioners and other technical occupations
64,843Life, physical, and social science occupations
60,128Computer and mathematical occupations
56,507Transportation occupations
55,295Business and financial operations occupations
48,580Management occupations
Top industries in this zip code by the number of employees in 2005:
Health Care and Social Assistance: Nursing Care Facilities (50-99 employees: 1 establishment)
Other Services (except Public Administration): Religious Organizations (5-9: 1, 1-4: 2)
Professional, Scientific, and Technical Services: Surveying and Mapping (except Geophysical) Services (1-4: 2)
Construction: Poured Concrete Foundation and Structure Contractors (1-4: 1)
Administrative and Support and Waste Management and Remediation Services: Septic Tank and Related Services (1-4: 1)
Administrative and Support and Waste Management and Remediation Services: Solid Waste Collection (1-4: 1)
Administrative and Support and Waste Management and Remediation Services: Landscaping Services (1-4: 1)
Construction: Plumbing, Heating, and Air-Conditioning Contractors (1-4: 1)
Construction: Drywall and Insulation Contractors (1-4: 1)
People in group quarters in 2010:
72 people in nursing facilities/skilled-nursing facilities
People in group quarters in 2000:
67 people in nursing homes
Fatal accident statistics in 2014:
Fatal accident count: 1
Vehicles involved in fatal accidents: 1
Fatal accidents caused by drunken drivers: 1
Fatalities: 1
Persons involved in fatal accidents: 1
Pedestrians involved in fatal accidents: 0
Fatal accident statistics in 2011:
Fatal accident count: 1
Vehicles involved in fatal accidents: 1
Fatal accidents caused by drunken drivers: 1
Fatalities: 1
Persons involved in fatal accidents: 3
Pedestrians involved in fatal accidents: 0
Home Mortgage Disclosure Act Aggregated Statistics For Year 2003 (Based on 2 partial tracts)
A) FHA, FSA/RHS & VA Home Purchase Loans
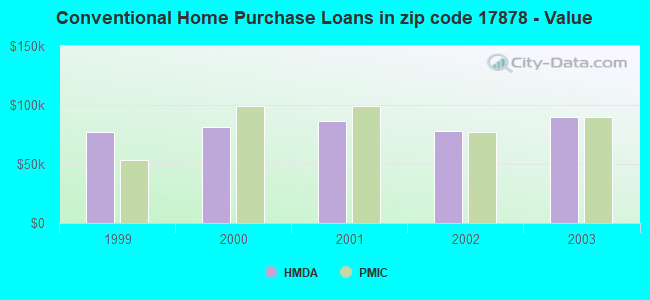
B) Conventional Home Purchase Loans
C) Refinancings
D) Home Improvement Loans
F) Non-occupant Loans on < 5 Family Dwellings (A B C & D)
Number
Average Value
Number
Average Value
Number
Average Value
Number
Average Value
Number
Average Value
LOANS ORIGINATED
3
$83,380
21
$89,452
71
$79,259
17
$28,001
6
$82,627
APPLICATIONS APPROVED, NOT ACCEPTED
0
$0
3
$64,613
10
$99,960
1
$25,890
3
$66,123
APPLICATIONS DENIED
0
$0
6
$76,208
34
$102,305
4
$29,690
1
$139,470
APPLICATIONS WITHDRAWN
0
$0
1
$133,320
16
$93,642
2
$18,605
0
$0
FILES CLOSED FOR INCOMPLETENESS
0
$0
1
$105,170
4
$118,275
0
$0
0
$0
Aggregated Statistics For Year 2002 (Based on 2 partial tracts)
A) FHA, FSA/RHS & VA Home Purchase Loans
B) Conventional Home Purchase Loans
C) Refinancings
D) Home Improvement Loans
F) Non-occupant Loans on < 5 Family Dwellings (A B C & D)
Number
Average Value
Number
Average Value
Number
Average Value
Number
Average Value
Number
Average Value
LOANS ORIGINATED
4
$69,575
18
$77,772
46
$70,052
15
$21,207
5
$46,598
APPLICATIONS APPROVED, NOT ACCEPTED
0
$0
1
$99,670
5
$76,434
2
$64,560
0
$0
APPLICATIONS DENIED
1
$95,140
3
$46,813
25
$73,548
4
$11,892
0
$0
APPLICATIONS WITHDRAWN
0
$0
1
$91,900
11
$79,194
1
$12,940
0
$0
FILES CLOSED FOR INCOMPLETENESS
0
$0
0
$0
2
$65,530
0
$0
0
$0
Aggregated Statistics For Year 2001 (Based on 2 partial tracts)
A) FHA, FSA/RHS & VA Home Purchase Loans
B) Conventional Home Purchase Loans
C) Refinancings
D) Home Improvement Loans
F) Non-occupant Loans on < 5 Family Dwellings (A B C & D)
Number
Average Value
Number
Average Value
Number
Average Value
Number
Average Value
Number
Average Value
LOANS ORIGINATED
2
$107,110
18
$86,455
42
$65,429
14
$21,057
4
$96,190
APPLICATIONS APPROVED, NOT ACCEPTED
0
$0
2
$81,545
5
$77,016
1
$19,420
0
$0
APPLICATIONS DENIED
0
$0
5
$60,124
21
$80,469
4
$19,740
2
$70,060
APPLICATIONS WITHDRAWN
0
$0
1
$100,960
13
$86,551
0
$0
1
$83,490
FILES CLOSED FOR INCOMPLETENESS
0
$0
0
$0
2
$77,180
0
$0
0
$0
Aggregated Statistics For Year 2000 (Based on 2 partial tracts)
A) FHA, FSA/RHS & VA Home Purchase Loans
B) Conventional Home Purchase Loans
C) Refinancings
D) Home Improvement Loans
F) Non-occupant Loans on < 5 Family Dwellings (A B C & D)
Number
Average Value
Number
Average Value
Number
Average Value
Number
Average Value
Number
Average Value
LOANS ORIGINATED
4
$79,768
16
$81,608
21
$55,212
13
$21,382
4
$48,378
APPLICATIONS APPROVED, NOT ACCEPTED
0
$0
2
$59,865
5
$49,964
2
$27,505
1
$53,720
APPLICATIONS DENIED
0
$0
11
$49,982
14
$57,694
5
$30,678
1
$39,160
APPLICATIONS WITHDRAWN
0
$0
1
$101,610
9
$46,922
0
$0
0
$0
FILES CLOSED FOR INCOMPLETENESS
0
$0
0
$0
3
$62,563
0
$0
0
$0
Aggregated Statistics For Year 1999 (Based on 1 partial tract)
A) FHA, FSA/RHS & VA Home Purchase Loans
B) Conventional Home Purchase Loans
C) Refinancings
D) Home Improvement Loans
F) Non-occupant Loans on < 5 Family Dwellings (A B C & D)
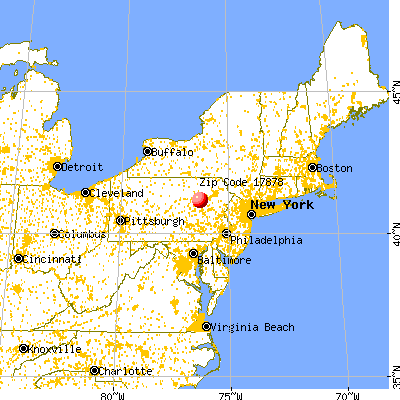


 Nearest zip codes: 18622, 17859, 17814, 18603, 18655, 18631.