Estimated zip code population in 2022: 1,370 Zip code population in 2010: 1,606 Zip code population in 2000: 1,571
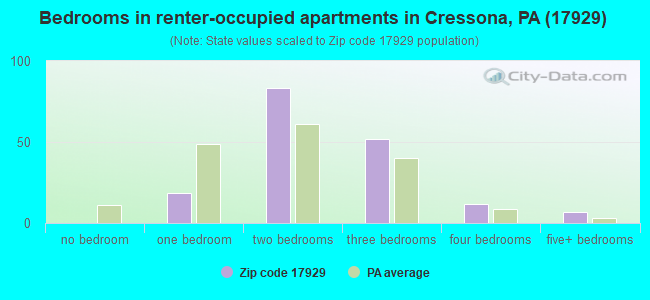
Houses and condos: 604 Renter-occupied apartments: 174
% of renters here:
30%
State:
31%
March 2022 cost of living index in zip code 17929: 83.8 (less than average, U.S. average is 100)
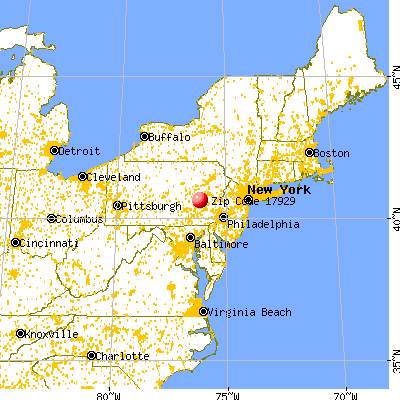
Land area: 1.0 sq. mi. Water area: 0.0 sq. mi.
Population density: 1,360 people per square mile
(low).
OSM Map
General Map
Google Map
MSN Map
OSM Map
General Map
Google Map
MSN Map
OSM Map
General Map
Google Map
MSN Map
OSM Map
General Map
Google Map
MSN Map
Please wait while loading the map...
Real estate property taxes paid for housing units in 2022:
This zip code:
1.3% ($1,863)
Pennsylvania:
1.3% ($3,094)
Median real estate property taxes paid for housing units with mortgages in 2022: $1,792 (1.3%) Median real estate property taxes paid for housing units with no mortgage in 2022: $2,051 (1.3%)
Business Search- 14 Million verified businesses
Males: 677
(49.5%)
Females: 692
(50.5%)
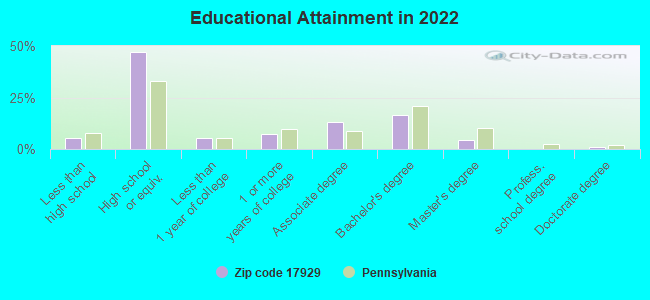
For population 25 years and over in 17929:
High school or higher: 93.8%
Bachelor's degree or higher: 21.8%
Graduate or professional degree: 5.5%
Unemployed: 3.6%
Mean travel time to work (commute): 20.8 minutes
For population 15 years and over in 17929:
Never married: 32.3%
Now married: 47.1%
Separated: 1.1%
Widowed: 6.2%
Divorced: 13.4%
Zip code 17929 compared to state average:
Median house value below state average.
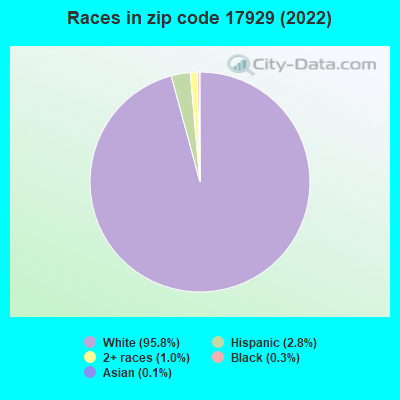
Black race population percentage significantly below state average.
Hispanic race population percentage below state average.
Foreign-born population percentage significantly below state average.
Length of stay since moving in significantly above state average.
House age above state average.
Percentage of population with a bachelor's degree or higher below state average.
Estimated median house/condo value in 2022: $146,736
17929:
$146,736
Pennsylvania:
$245,500
Median resident age:
This zip code:
40.2 years
Pennsylvania median age:
40.9 years
Average household size:
This zip code:
2.4 people
Pennsylvania:
2.4 people
Averages for the 2020 tax year for zip code 17929, filed in 2021:
Average Adjusted Gross Income (AGI) in 2020: $49,370 (Individual Income Tax Returns)
Here:
$49,370
State:
$75,707
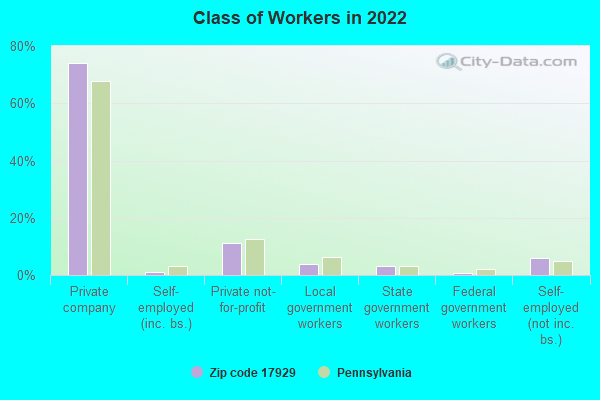
Salary/wage: $45,310 (reported on 83.0% of returns)
Here:
$45,310
State:
$62,806
(% of AGI for various income ranges: 983.5% for AGIs below $25k, 3347.4% for AGIs $25k-50k, 5956.4% for AGIs $50k-75k, 9731.4% for AGIs $75k-100k, 15996.7% for AGIs $100k-200k)
Taxable interest for individuals: $480 (reported on 22.7% of returns)
This zip code:
$480
Pennsylvania:
$1,633
(% of AGI for various income ranges: 8.5% for AGIs below $25k, 27.9% for AGIs $25k-50k, 3.6% for AGIs $50k-75k, 11.4% for AGIs $75k-100k, 21.7% for AGIs $100k-200k)
Ordinary dividends: $1,777 (reported on 14.8% of returns)
Here:
$1,777
State:
$7,382
(% of AGI for various income ranges: 31.0% for AGIs below $25k, 45.8% for AGIs $25k-50k, 64.3% for AGIs $75k-100k, 61.7% for AGIs $100k-200k)
Net capital gain/loss in AGI: +$2,450 (reported on 13.6% of returns)
Here:
+$2,450
State:
+$23,522
(% of AGI for various income ranges: 4.5% for AGIs below $25k, 21.1% for AGIs $25k-50k, 152.9% for AGIs $75k-100k, 230.0% for AGIs $100k-200k)
Profit/loss from business: +$5,300 (reported on 6.8% of returns)
Here:
+$5,300
State:
+$16,274
(% of AGI for various income ranges: 76.5% for AGIs below $25k, 235.7% for AGIs $75k-100k)
Taxable individual retirement arrangement distribution: $7,500 (reported on 8.0% of returns)
17929:
$7,500
Pennsylvania:
$18,583
(% of AGI for various income ranges: 83.0% for AGIs below $25k, 77.9% for AGIs $25k-50k, 301.4% for AGIs $75k-100k)
Total itemized deductions: $23,500 (reported on 2.3% of returns)
Here:
$23,500
State:
$34,850
(% of AGI for various income ranges: 335.7% for AGIs $50k-75k)
Taxes paid: $5,567 (reported on 3.4% of returns)
17929:
$5,567
State:
$8,200
(% of AGI for various income ranges: 119.3% for AGIs $50k-75k)
Earned income credit: $1,864 (reported on 12.5% of returns)
Here:
$1,864
State:
$2,100
(% of AGI for various income ranges: 53.0% for AGIs below $25k, 52.1% for AGIs $25k-50k)
Percentage of individuals using paid preparers for their 2020 taxes: 92.0%
Here:
92%
State:
92%
(% for various income ranges: 90.0% for AGIs below $25k, 91.3% for AGIs $25k-50k, 93.8% for AGIs $50k-75k, 90.0% for AGIs $75k-100k, 100.0% for AGIs $100k-200k)
Averages for the 2012 tax year for zip code 17929, filed in 2013:
Average Adjusted Gross Income (AGI) in 2012: $43,153 (Individual Income Tax Returns)
Here:
$43,153
State:
$61,346
Salary/wage: $38,590 (reported on 85.5% of returns)
Here:
$38,590
State:
$51,902
(% of AGI for various income ranges: 69.4% for AGIs below $25k, 81.7% for AGIs $25k-50k, 84.4% for AGIs $50k-75k, 85.7% for AGIs $75k-100k, 61.3% for AGIs $100k-200k)
Taxable interest for individuals: $668 (reported on 30.1% of returns)
This zip code:
$668
Pennsylvania:
$1,588
(% of AGI for various income ranges: 0.7% for AGIs below $25k, 0.4% for AGIs $25k-50k, 0.3% for AGIs $50k-75k, 0.1% for AGIs $75k-100k, 0.8% for AGIs $100k-200k)
Ordinary dividends: $1,287 (reported on 18.1% of returns)
Here:
$1,287
State:
$5,827
(% of AGI for various income ranges: 1.4% for AGIs below $25k, 0.5% for AGIs $25k-50k, 0.4% for AGIs $50k-75k, 0.6% for AGIs $100k-200k)
Net capital gain/loss in AGI: +$690 (reported on 12.0% of returns)
Here:
+$690
State:
+$14,495
(% of AGI for various income ranges: 0.2% for AGIs $50k-75k, 0.7% for AGIs $100k-200k)
Profit/loss from business: +$9,686 (reported on 8.4% of returns)
Here:
+$9,686
State:
+$16,268
(% of AGI for various income ranges: 7.4% for AGIs below $25k, 2.8% for AGIs $25k-50k, 1.8% for AGIs $50k-75k)
Taxable individual retirement arrangement distribution: $8,729 (reported on 8.4% of returns)
17929:
$8,729
Pennsylvania:
$14,550
(% of AGI for various income ranges: 3.3% for AGIs below $25k, 1.6% for AGIs $25k-50k, 3.9% for AGIs $50k-75k)
Total itemized deductions: $16,707 (19% of AGI, reported on 18.1% of returns)
Here:
$16,707
State:
$23,538
Here:
18.9% of AGI
State:
18.4% of AGI
(% of AGI for various income ranges: 6.6% for AGIs $25k-50k, 6.5% for AGIs $50k-75k, 7.2% for AGIs $75k-100k, 10.6% for AGIs $100k-200k)
Charity contributions: $2,742 (reported on 14.5% of returns)
Here:
$2,742
State:
$4,025
(% of AGI for various income ranges: 1.8% for AGIs below $25k, 1.1% for AGIs $50k-75k, 1.8% for AGIs $100k-200k)
Taxes paid: $5,944 (reported on 19.3% of returns)
17929:
$5,944
State:
$9,982
(% of AGI for various income ranges: 1.6% for AGIs $25k-50k, 2.2% for AGIs $50k-75k, 2.5% for AGIs $75k-100k, 5.2% for AGIs $100k-200k)
Earned income credit: $1,943 (reported on 16.9% of returns)
Here:
$1,943
State:
$2,106
(% of AGI for various income ranges: 5.0% for AGIs below $25k, 1.0% for AGIs $25k-50k)
Percentage of individuals using paid preparers for their 2012 taxes: 53.0%
Here:
53%
State:
53%
(% for various income ranges: 50.0% for AGIs below $25k, 50.0% for AGIs $25k-50k, 60.0% for AGIs $50k-75k, 50.0% for AGIs $75k-100k, 66.7% for AGIs $100k-200k)
Averages for the 2004 tax year for zip code 17929, filed in 2005:
Average Adjusted Gross Income (AGI) in 2004: $34,393 (Individual Income Tax Returns)
Here:
$34,393
State:
$48,049
Salary/wage: $33,568 (reported on 84.1% of returns)
Here:
$33,568
State:
$42,646
(% of AGI for various income ranges: 96.6% for AGIs below $10k, 72.8% for AGIs $10k-25k, 89.1% for AGIs $25k-50k, 81.6% for AGIs $50k-75k, 89.9% for AGIs $75k-100k, 64.4% for AGIs over 100k)
Taxable interest for individuals: $994 (reported on 43.2% of returns)
This zip code:
$994
Pennsylvania:
$1,657
(% of AGI for various income ranges: 8.1% for AGIs below $10k, 2.0% for AGIs $10k-25k, 0.9% for AGIs $25k-50k, 1.6% for AGIs $50k-75k, 0.2% for AGIs $75k-100k, 0.6% for AGIs over 100k)
Taxable dividends: $881 (reported on 24.3% of returns)
Here:
$881
State:
$3,566
(% of AGI for various income ranges: 5.1% for AGIs below $10k, 1.1% for AGIs $10k-25k, 0.3% for AGIs $25k-50k, 0.2% for AGIs $50k-75k, 0.1% for AGIs $75k-100k, 1.3% for AGIs over 100k)
Net capital gain/loss: +$1,266 (reported on 13.6% of returns)
Here:
+$1,266
State:
+$9,716
(% of AGI for various income ranges: 8.4% for AGIs below $10k, 0.6% for AGIs $10k-25k, -0.1% for AGIs $25k-50k, 0.5% for AGIs $50k-75k, 0.8% for AGIs over 100k)
Profit/loss from business: +$5,099 (reported on 8.9% of returns)
Here:
+$5,099
State:
+$14,267
(% of AGI for various income ranges: -9.6% for AGIs below $10k, 4.0% for AGIs $10k-25k, 2.1% for AGIs $25k-50k, 1.6% for AGIs $50k-75k)
IRA payment deduction: $2,368 (reported on 2.4% of returns)
17929:
$2,368
Pennsylvania:
$2,903
Total itemized deductions: $13,648 (19% of AGI, reported on 17.8% of returns)
Here:
$13,648
State:
$18,804
Here:
19.4% of AGI
State:
19.5% of AGI
(% of AGI for various income ranges: 6.7% for AGIs $25k-50k, 6.6% for AGIs $50k-75k, 11.9% for AGIs $75k-100k, 11.1% for AGIs over 100k)
Charity contributions deductions: $2,118 (3% of AGI, reported on 14.9% of returns)
Here:
$2,118
State:
$3,337
Here:
2.9% of AGI
State:
3.3% of AGI
(% of AGI for various income ranges: 0.9% for AGIs $25k-50k, 0.9% for AGIs $50k-75k, 0.9% for AGIs $75k-100k, 1.7% for AGIs over 100k)
Total tax: $4,230 (reported on 75.7% of returns)
17929:
$4,230
State:
$8,008
(% of AGI for various income ranges: 3.7% for AGIs below $10k, 4.0% for AGIs $10k-25k, 7.4% for AGIs $25k-50k, 8.0% for AGIs $50k-75k, 10.2% for AGIs $75k-100k, 20.1% for AGIs over 100k)
Earned income credit: $1,525 (reported on 12.4% of returns)
Here:
$1,525
State:
$1,643
Percentage of individuals using paid preparers for their 2004 taxes: 58.3%
Here:
58%
State:
56%
(% for various income ranges: 60.2% for AGIs below $10k, 54.8% for AGIs $10k-25k, 52.8% for AGIs $25k-50k, 63.5% for AGIs $50k-75k, 72.2% for AGIs $75k-100k, 83.3% for AGIs over 100k)
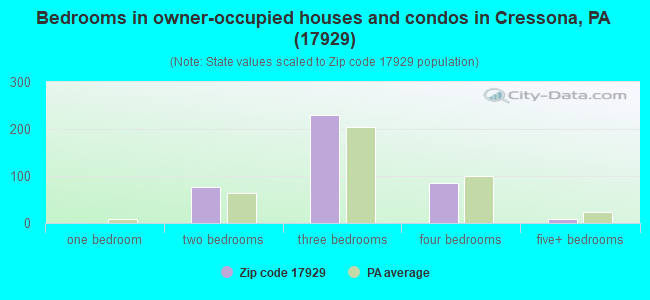
Size of family households: 186 2-persons, 79 3-persons, 73 4-persons, 16 5-persons, 5 7-or-more-persons
Size of nonfamily households: 143 1-person, 63 2-persons, 11 5-persons
135 married couples with children.
64 single-parent households (11 men, 53 women).
96.7% of residents of 17929 zip code speak English at home.
0.5% of residents speak Spanish at home (50% very well, 50% not well).
1.8% of residents speak other Indo-European language at home (71% very well, 29% not well).
0.2% of residents speak Asian or Pacific Island language at home (100% very well).
Foreign born population: 13 (1.0%) (100.0% of them are naturalized citizens)
This zip code:
1.0%
Whole state:
7.5%
23%Guyana
15%France
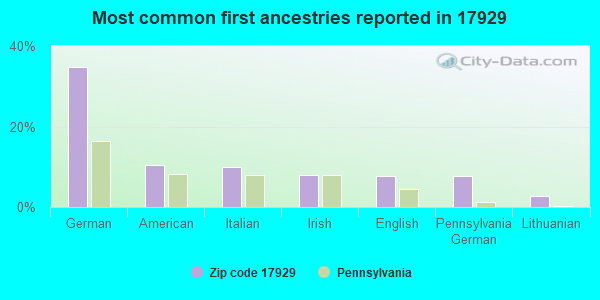
35%German
11%American
10%Italian
8%Irish
8%English
8%Pennsylvania German
3%Lithuanian
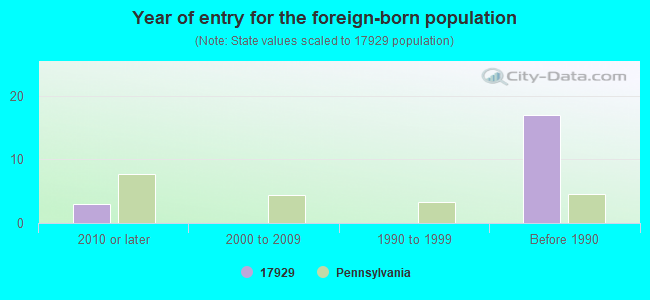
Year of entry for the foreign-born population
32010 or later
02000 to 2009
01990 to 1999
17Before 1990
Facilities with environmental interests located in this zip code:
ALCOA EXTRUSIONS (53 POTTSVILLE STREET in CRESSONA, PA)
AIR MAJOR (AIRS/AFS) (Integrated Compliance Information System) - ICIS-03-1993-0197, FORMAL ENFORCEMENT ACTION, ICIS-03-1988-0898, ICIS-03-1991-0225, ICIS-03-1991-0226, ICIS-03-1991-0227, COMPLIANCE ACTIVITY (Tracking inspections of insecticide, fungicide, and rodenticide, and toxic substances) CRITERIA AND HAZARDOUS AIR POLLUTANT INVENTORY (Inventory of air pollution sources) STATE MASTER (Pennsylvania database) - AFS-23-2083824-1, AIR PROGRAM, RCRIS-PAD096262522, HAZARDOUS WASTE PROGRAM National Pollutant Discharge Elimination System NON-MAJOR (Tracking pollutant discharge elimination systems) - permit HAZARDOUS WASTE BIENNIAL REPORTER (Resource Conservation and Recovery Act (tracking hazardous waste)) Large Quantity Generators, more that 1000 kg of hazardous waste/month (Resource Conservation and Recovery Act (tracking hazardous waste)) - notification TSD (Resource Conservation and Recovery Act (tracking hazardous waste)) - notification TRI REPORTER (Tracking of toxic chemicals releasing facilities) Business SIC classification: PRIMARY PRODUCTION OF ALUMINUM; SECONDARY SMELTING AND REFINING OF NONFERROUS METALS; ALUMINUM EXTRUDED PRODUCTS Business NAICS classification: SECONDARY SMELTING AND ALLOYING OF ALUMINUM.; ALUMINUM EXTRUDED PRODUCT MANUFACTURING.; ALUMINUM EXTRUDED PRODUCT MANUFACTURING. Organizations: ALCOA EXTRUSIONS INC (CONTACT/OPERATOR)
, ALOCOA EXTRUSIONS INC (CONTACT/OPERATOR)
, CRESSONA ALUM CO (CONTACT/OWNER)
, ALCOA EXTRUSIONS, INC. (CONTACT/OWNER)
Alternative names: ALCOA EXTRUSIONS INC. - CRESSONA OPERATION, ALUMAX EXTRUSIONS INC, ALUMAX EXTRUSIONS MFG, ALUMINUM COMPANY OF AMERICA EXTRUSIONS INCORPORATED CRESSONA OPERATION, ALUMINUM COMPANY OF AMERICA EXTRUSIONS I, CRESSONA ALUMINUM COMPANY
BLUE MOUNTAIN EL CRESSONA SCH ( in CRESSONA, PA)
(National Center for Education Statistics) - STATE ID-7419 Organizations: BLUE MOUNTAIN SD (SCHOOL DISTRICT)
Housing units lacking complete plumbing facilities: 3.5% Housing units lacking complete kitchen facilities: 5.8%
56.1%Fuel oil, kerosene, etc.
27.2%Electricity
10.7%Coal or coke
3.2%Bottled, tank, or LP gas
2.0%Wood
0.9%Utility gas
Population in 1990: 2,240.
Place of birth for U.S.-born residents:
This state: 1,172
Northeast: 49
Midwest: 50
South: 34
West: 33
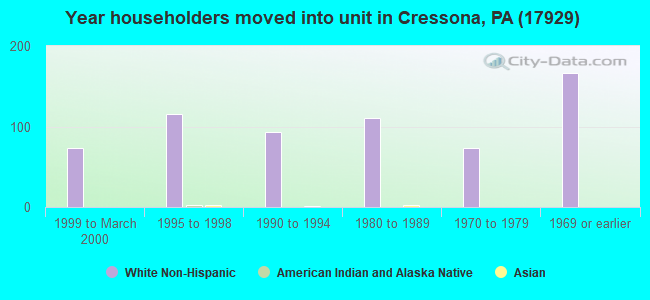
70% of the 17929 zip code residents lived in the same house 5 years ago. Out of people who lived in different houses, 86% lived in this county. Out of people who lived in different counties, 50% lived in Pennsylvania.
93% of the 17929 zip code residents lived in the same house 1 year ago. Out of people who lived in different houses, 81% moved from this county. Out of people who lived in different houses, 11% moved from different county within same state. Out of people who lived in different houses, 6% moved from different state.
Private vs. public school enrollment:
Students in private schools in grades 1 to 8 (elementary and middle school): 4
Here:
3.2%
Pennsylvania:
15.7%
Students in private schools in grades 9 to 12 (high school): 5
Here:
14.7%
Pennsylvania:
13.4%
Students in private undergraduate colleges:
Here:
0.0%
Pennsylvania:
39.8%
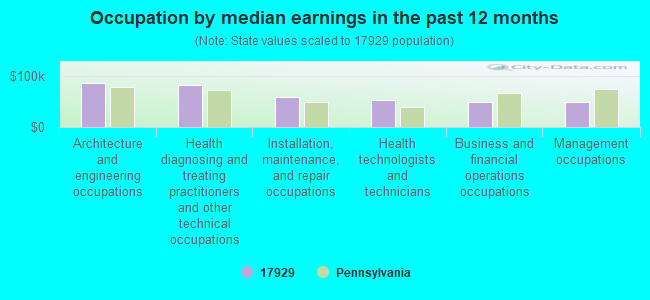
Occupation by median earnings in the past 12 months ($)
86,848Architecture and engineering occupations
83,885Health diagnosing and treating practitioners and other technical occupations
59,322Installation, maintenance, and repair occupations
52,719Health technologists and technicians
50,101Business and financial operations occupations
48,889Management occupations
Top industries in this zip code by the number of employees in 2005:
Administrative and Support and Waste Management and Remediation Services: Security Guards and Patrol Services (20-49 employees: 1 establishment)
Other Services (except Public Administration): Religious Organizations (5-9: 2, 1-4: 2)
Professional, Scientific, and Technical Services: Engineering Services (10-19: 1)
Other Services (except Public Administration): Automotive Body, Paint, and Interior Repair and Maintenance (10-19: 1)
Fatal accident statistics in 2010:
Fatal accident count: 1
Vehicles involved in fatal accidents: 1
Fatal accidents caused by drunken drivers: 1
Fatalities: 1
Persons involved in fatal accidents: 1
Pedestrians involved in fatal accidents: 0
2005 - 2018 National Fire Incident Reporting System (NFIRS) incidents
Based on the data from the years 2005 - 2018 the average number of fire incidents per year is 8. The highest number of reported fire incidents - 24 took place in 2018, and the least - 0 in 2008. The data has a growing trend.
When looking into fire subcategories, the most reports belonged to: Structure Fires (81.9%), and Outside Fires (8.6%).
Fire incident types reported to NFIRS in Zip Code 17929


 Nearest zip codes: 17972, 17933, 17979, 17951, 17965, 17974.
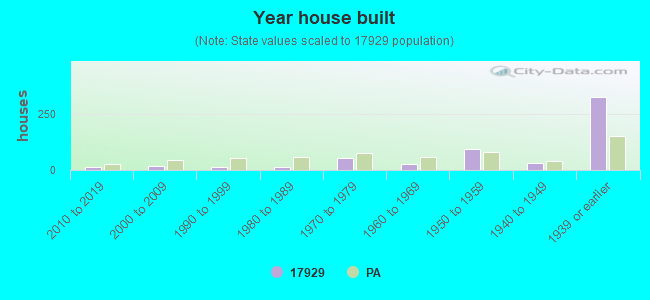


 Based on the data from the years 2005 - 2018 the average number of fire incidents per year is 8. The highest number of reported fire incidents - 24 took place in 2018, and the least - 0 in 2008. The data has a growing trend.
 When looking into fire subcategories, the most reports belonged to: Structure Fires (81.9%), and Outside Fires (8.6%).