Estimated zip code population in 2022: 4,576 Zip code population in 2010: 4,564 Zip code population in 2000: 4,686
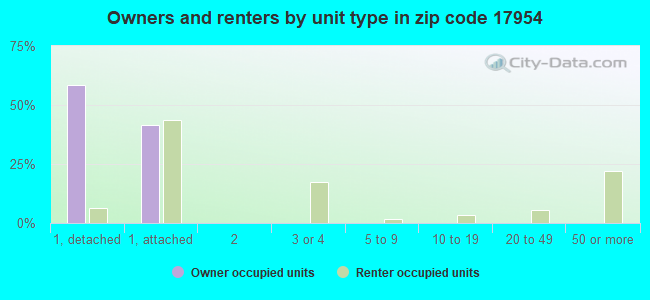
Houses and condos: 2,345 Renter-occupied apartments: 879
% of renters here:
46%
State:
31%
March 2022 cost of living index in zip code 17954: 81.9 (low, U.S. average is 100)
Land area: 0.7 sq. mi. Water area: 0.0 sq. mi.
Population density: 6,574 people per square mile
(high).
OSM Map
General Map
Google Map
MSN Map
OSM Map
General Map
Google Map
MSN Map
OSM Map
General Map
Google Map
MSN Map
OSM Map
General Map
Google Map
MSN Map
Please wait while loading the map...
Real estate property taxes paid for housing units in 2022:
This zip code:
1.7% ($1,425)
Pennsylvania:
1.3% ($3,094)
Median real estate property taxes paid for housing units with mortgages in 2022: $1,803 (1.0%) Median real estate property taxes paid for housing units with no mortgage in 2022: $1,325 (1.7%)
Business Search- 14 Million verified businesses
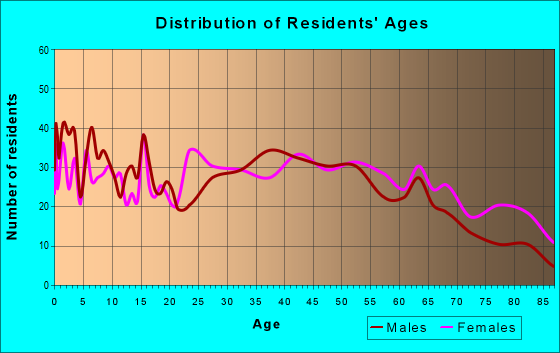
Males: 2,234
(48.8%)
Females: 2,342
(51.2%)
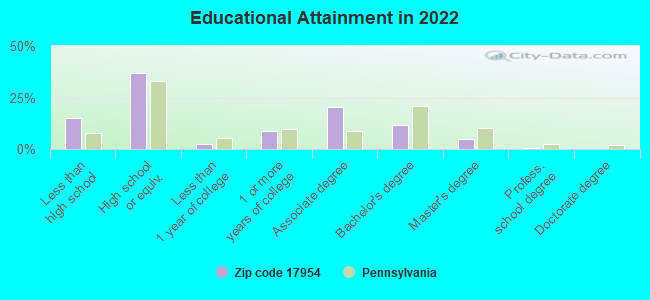
For population 25 years and over in 17954:
High school or higher: 83.2%
Bachelor's degree or higher: 16.3%
Graduate or professional degree: 5.1%
Unemployed: 2.3%
Mean travel time to work (commute): 20.3 minutes
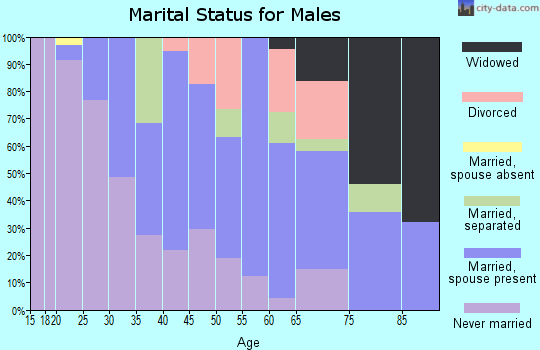
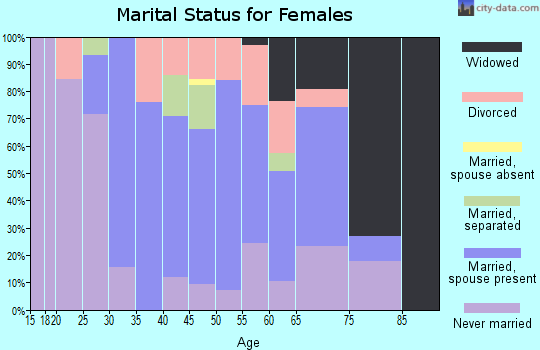
For population 15 years and over in 17954:
Never married: 46.5%
Now married: 34.3%
Separated: 1.3%
Widowed: 4.9%
Divorced: 12.9%
Zip code 17954 compared to state average:
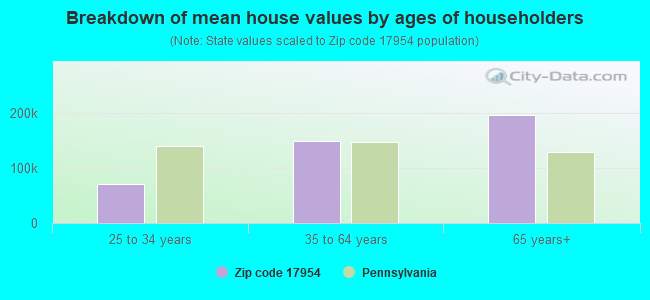
Median house value significantly below state average.
Unemployed percentage below state average.
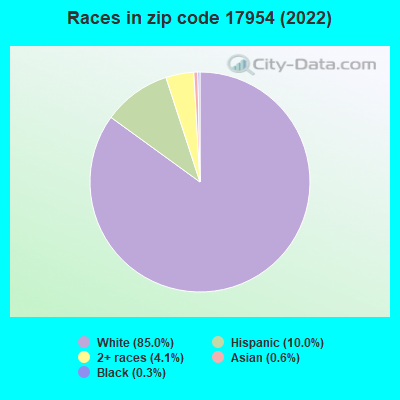
Black race population percentage significantly below state average.
Foreign-born population percentage significantly below state average.
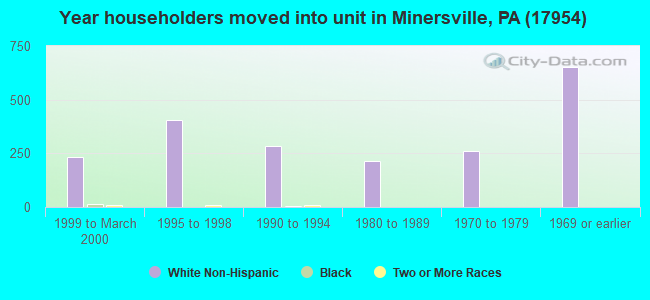
Length of stay since moving in above state average.
House age above state average.
Number of college students significantly below state average.
Percentage of population with a bachelor's degree or higher below state average.
Averages for the 2020 tax year for zip code 17954, filed in 2021:
Average Adjusted Gross Income (AGI) in 2020: $40,654 (Individual Income Tax Returns)
Here:
$40,654
State:
$75,707
Salary/wage: $36,627 (reported on 79.7% of returns)
Here:
$36,627
State:
$62,806
(% of AGI for various income ranges: 911.6% for AGIs below $25k, 3280.0% for AGIs $25k-50k, 5681.5% for AGIs $50k-75k, 8293.1% for AGIs $75k-100k, 15191.0% for AGIs $100k-200k)
Taxable interest for individuals: $536 (reported on 22.0% of returns)
This zip code:
$536
Pennsylvania:
$1,633
(% of AGI for various income ranges: 13.2% for AGIs below $25k, 8.6% for AGIs $25k-50k, 16.9% for AGIs $50k-75k, 25.4% for AGIs $75k-100k, 50.0% for AGIs $100k-200k)
Ordinary dividends: $2,155 (reported on 12.8% of returns)
Here:
$2,155
State:
$7,382
(% of AGI for various income ranges: 17.4% for AGIs below $25k, 17.3% for AGIs $25k-50k, 48.1% for AGIs $50k-75k, 79.2% for AGIs $75k-100k, 177.0% for AGIs $100k-200k)
Net capital gain/loss in AGI: +$2,522 (reported on 7.9% of returns)
Here:
+$2,522
State:
+$23,522
(% of AGI for various income ranges: 1.6% for AGIs below $25k, 8.0% for AGIs $25k-50k, 71.2% for AGIs $50k-75k, 32.3% for AGIs $75k-100k, 169.0% for AGIs $100k-200k)
Profit/loss from business: +$8,162 (reported on 7.0% of returns)
Here:
+$8,162
State:
+$16,274
(% of AGI for various income ranges: 23.1% for AGIs below $25k, 30.7% for AGIs $25k-50k, 132.3% for AGIs $50k-75k, 480.0% for AGIs $75k-100k)
Taxable individual retirement arrangement distribution: $10,776 (reported on 7.5% of returns)
17954:
$10,776
Pennsylvania:
$18,583
(% of AGI for various income ranges: 60.6% for AGIs below $25k, 60.2% for AGIs $25k-50k, 221.2% for AGIs $50k-75k, 490.0% for AGIs $100k-200k)
Total itemized deductions: $26,250 (reported on 0.9% of returns)
Here:
$26,250
State:
$34,850
(% of AGI for various income ranges: 201.9% for AGIs $50k-75k)
Taxes paid: $7,050 (reported on 0.9% of returns)
17954:
$7,050
State:
$8,200
(% of AGI for various income ranges: 54.2% for AGIs $50k-75k)
Earned income credit: $2,206 (reported on 20.7% of returns)
Here:
$2,206
State:
$2,100
(% of AGI for various income ranges: 90.6% for AGIs below $25k, 71.4% for AGIs $25k-50k)
Percentage of individuals using paid preparers for their 2020 taxes: 92.1%
Here:
92%
State:
92%
(% for various income ranges: 89.2% for AGIs below $25k, 94.2% for AGIs $25k-50k, 93.8% for AGIs $50k-75k, 94.1% for AGIs $75k-100k, 93.8% for AGIs $100k-200k)
Averages for the 2012 tax year for zip code 17954, filed in 2013:
Average Adjusted Gross Income (AGI) in 2012: $34,778 (Individual Income Tax Returns)
Here:
$34,778
State:
$61,346
Salary/wage: $32,599 (reported on 83.6% of returns)
Here:
$32,599
State:
$51,902
(% of AGI for various income ranges: 68.6% for AGIs below $25k, 83.3% for AGIs $25k-50k, 79.3% for AGIs $50k-75k, 83.6% for AGIs $75k-100k, 71.6% for AGIs $100k-200k)
Taxable interest for individuals: $794 (reported on 29.0% of returns)
This zip code:
$794
Pennsylvania:
$1,588
(% of AGI for various income ranges: 1.2% for AGIs below $25k, 0.6% for AGIs $25k-50k, 0.2% for AGIs $50k-75k, 1.3% for AGIs $75k-100k, 0.3% for AGIs $100k-200k)
Ordinary dividends: $1,847 (reported on 15.9% of returns)
Here:
$1,847
State:
$5,827
(% of AGI for various income ranges: 1.2% for AGIs below $25k, 0.6% for AGIs $25k-50k, 0.3% for AGIs $50k-75k, 1.4% for AGIs $75k-100k, 1.4% for AGIs $100k-200k)
Profit/loss from business: +$7,044 (reported on 7.5% of returns)
Here:
+$7,044
State:
+$16,268
(% of AGI for various income ranges: 4.5% for AGIs below $25k, 1.2% for AGIs $25k-50k, 1.4% for AGIs $50k-75k, 0.6% for AGIs $75k-100k)
Taxable individual retirement arrangement distribution: $7,363 (reported on 8.9% of returns)
17954:
$7,363
Pennsylvania:
$14,550
(% of AGI for various income ranges: 2.9% for AGIs below $25k, 1.4% for AGIs $25k-50k, 1.6% for AGIs $50k-75k, 4.0% for AGIs $75k-100k)
Total itemized deductions: $14,729 (21% of AGI, reported on 9.8% of returns)
Here:
$14,729
State:
$23,538
Here:
20.5% of AGI
State:
18.4% of AGI
(% of AGI for various income ranges: 2.2% for AGIs below $25k, 2.4% for AGIs $25k-50k, 4.3% for AGIs $50k-75k, 6.2% for AGIs $75k-100k, 7.5% for AGIs $100k-200k)
Charity contributions: $2,253 (reported on 7.0% of returns)
Here:
$2,253
State:
$4,025
(% of AGI for various income ranges: 0.2% for AGIs $25k-50k, 0.4% for AGIs $50k-75k, 0.8% for AGIs $75k-100k, 1.1% for AGIs $100k-200k)
Taxes paid: $5,029 (reported on 9.8% of returns)
17954:
$5,029
State:
$9,982
(% of AGI for various income ranges: 0.4% for AGIs below $25k, 0.6% for AGIs $25k-50k, 1.5% for AGIs $50k-75k, 2.1% for AGIs $75k-100k, 3.5% for AGIs $100k-200k)
Earned income credit: $1,968 (reported on 22.0% of returns)
Here:
$1,968
State:
$2,106
(% of AGI for various income ranges: 5.9% for AGIs below $25k, 1.0% for AGIs $25k-50k)
Percentage of individuals using paid preparers for their 2012 taxes: 48.1%
Here:
48%
State:
53%
(% for various income ranges: 43.0% for AGIs below $25k, 46.8% for AGIs $25k-50k, 60.0% for AGIs $50k-75k, 57.1% for AGIs $75k-100k, 62.5% for AGIs $100k-200k)
Averages for the 2004 tax year for zip code 17954, filed in 2005:
Average Adjusted Gross Income (AGI) in 2004: $30,945 (Individual Income Tax Returns)
Here:
$30,945
State:
$48,049
Salary/wage: $29,581 (reported on 85.4% of returns)
Here:
$29,581
State:
$42,646
(% of AGI for various income ranges: 81.2% for AGIs below $10k, 76.6% for AGIs $10k-25k, 85.3% for AGIs $25k-50k, 84.1% for AGIs $50k-75k, 87.4% for AGIs $75k-100k, 58.7% for AGIs over 100k)
Taxable interest for individuals: $1,455 (reported on 43.0% of returns)
This zip code:
$1,455
Pennsylvania:
$1,657
(% of AGI for various income ranges: 4.3% for AGIs below $10k, 2.4% for AGIs $10k-25k, 1.6% for AGIs $25k-50k, 2.1% for AGIs $50k-75k, 1.3% for AGIs $75k-100k, 2.9% for AGIs over 100k)
Taxable dividends: $1,222 (reported on 22.7% of returns)
Here:
$1,222
State:
$3,566
(% of AGI for various income ranges: 1.8% for AGIs below $10k, 1.0% for AGIs $10k-25k, 0.6% for AGIs $25k-50k, 0.5% for AGIs $50k-75k, 1.2% for AGIs $75k-100k, 2.4% for AGIs over 100k)
Net capital gain/loss: +$422 (reported on 10.5% of returns)
Here:
+$422
State:
+$9,716
(% of AGI for various income ranges: -1.2% for AGIs below $10k, 0.1% for AGIs $10k-25k, 0.5% for AGIs $25k-50k, 0.0% for AGIs $50k-75k, -0.2% for AGIs over 100k)
Profit/loss from business: +$4,868 (reported on 8.1% of returns)
Here:
+$4,868
State:
+$14,267
(% of AGI for various income ranges: 5.7% for AGIs below $10k, 1.6% for AGIs $10k-25k, 1.5% for AGIs $25k-50k, 0.9% for AGIs $50k-75k, 0.6% for AGIs $75k-100k)
IRA payment deduction: $2,583 (reported on 2.8% of returns)
17954:
$2,583
Pennsylvania:
$2,903
Total itemized deductions: $13,545 (22% of AGI, reported on 12.9% of returns)
Here:
$13,545
State:
$18,804
Here:
22.1% of AGI
State:
19.5% of AGI
(% of AGI for various income ranges: 3.6% for AGIs $10k-25k, 4.6% for AGIs $25k-50k, 5.4% for AGIs $50k-75k, 10.4% for AGIs $75k-100k, 10.7% for AGIs over 100k)
Charity contributions deductions: $1,828 (3% of AGI, reported on 11.1% of returns)
Here:
$1,828
State:
$3,337
Here:
2.9% of AGI
State:
3.3% of AGI
(% of AGI for various income ranges: 0.2% for AGIs $10k-25k, 0.4% for AGIs $25k-50k, 0.6% for AGIs $50k-75k, 1.5% for AGIs $75k-100k, 1.8% for AGIs over 100k)
Total tax: $3,594 (reported on 71.8% of returns)
17954:
$3,594
State:
$8,008
(% of AGI for various income ranges: 1.4% for AGIs below $10k, 4.2% for AGIs $10k-25k, 7.3% for AGIs $25k-50k, 9.1% for AGIs $50k-75k, 10.8% for AGIs $75k-100k, 17.3% for AGIs over 100k)
Earned income credit: $1,637 (reported on 17.3% of returns)
Here:
$1,637
State:
$1,643
Percentage of individuals using paid preparers for their 2004 taxes: 54.7%
Here:
55%
State:
56%
(% for various income ranges: 49.2% for AGIs below $10k, 54.0% for AGIs $10k-25k, 54.3% for AGIs $25k-50k, 61.2% for AGIs $50k-75k, 62.8% for AGIs $75k-100k, 76.9% for AGIs over 100k)
Household received Food Stamps/SNAP in the past 12 months: 759 Household did not receive Food Stamps/SNAP in the past 12 months: 1,170
Women who had a birth in the past 12 months: 27 (29 now married, 0 unmarried) Women who did not have a birth in the past 12 months: 711 (89 now married, 628 unmarried)
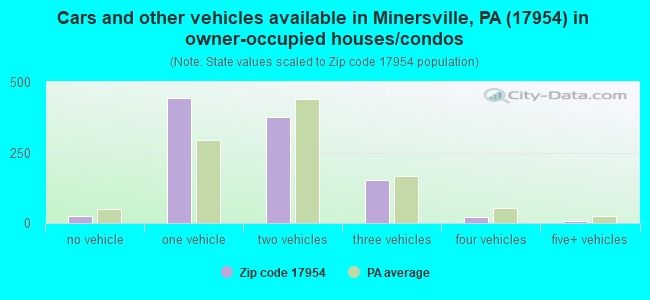
Housing units in zip code 17954 with a mortgage: 505 (94 second mortgage, 94 both second mortgage and home equity loan) Houses without a mortgage: 21
Median monthly owner costs for units with a mortgage: $1,124 Median monthly owner costs for units without a mortgage: $507
Residents with income below the poverty level in 2022:
This zip code:
21.2%
Whole state:
11.8%
Residents with income below 50% of the poverty level in 2022:
This zip code:
14.9%
Whole state:
6.1%
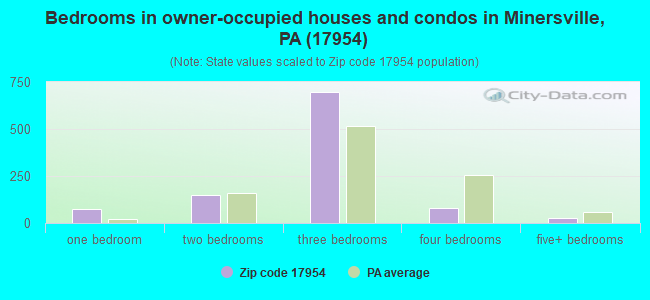
Median number of rooms in houses and condos:
Here:
6.3
State:
6.8
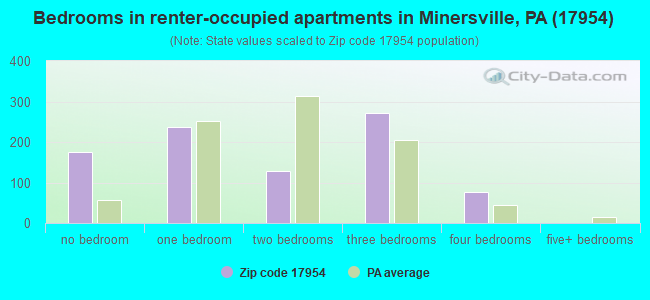
Median number of rooms in apartments:
Here:
4.2
State:
4.3
Notable locations in this zip code not listed on our city pages
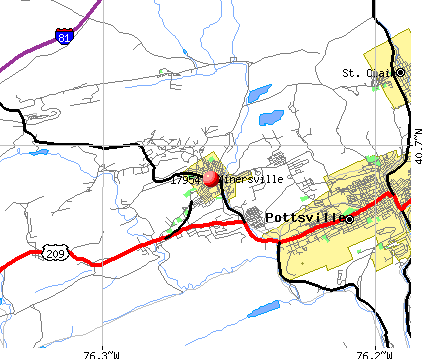
Notable locations in zip code 17954: Independent Hose Company (A), Rescue Hook and Ladder Fire Company (B), Good Will Fire Company 1 of Minersville (C), Mountaineer Hose Company 1 (D), New Minersville Fire Company (E). Display/hide their locations on the map
In group quarters: 6 (-1 institutionalized population)
Size of family households: 462 2-persons, 337 3-persons, 243 4-persons, 99 5-persons, 32 6-persons
Size of nonfamily households: 649 1-person, 65 2-persons
162 married couples with children.
582 single-parent households (222 men, 360 women).
96.4% of residents of 17954 zip code speak English at home.
2.2% of residents speak Spanish at home (51% very well, 49% not well).
0.6% of residents speak other Indo-European language at home (100% very well).
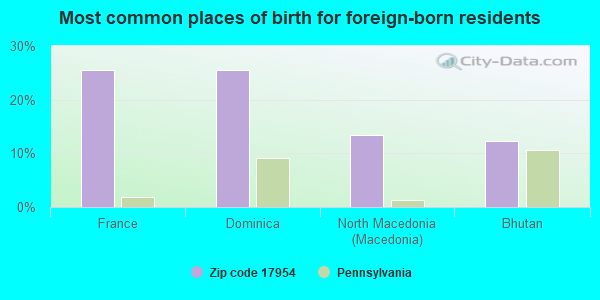
Foreign born population: 90 (2.0%) (65.3% of them are naturalized citizens)
This zip code:
2.0%
Whole state:
7.5%
26%France
26%Dominica
13%North Macedonia (Macedonia)
12%Bhutan
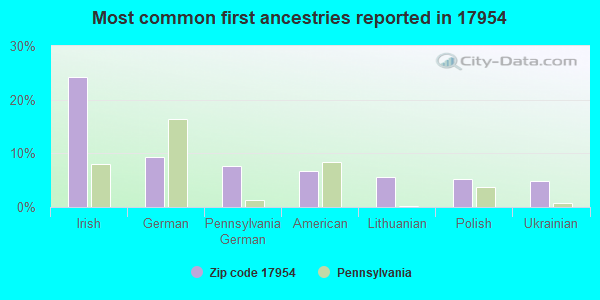
24%Irish
9%German
8%Pennsylvania German
7%American
6%Lithuanian
5%Polish
5%Ukrainian
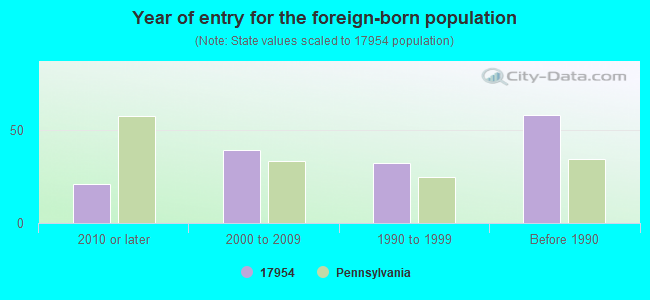
Year of entry for the foreign-born population
212010 or later
392000 to 2009
321990 to 1999
58Before 1990
Housing units lacking complete plumbing facilities: 2.9% Housing units lacking complete kitchen facilities: 5.9%
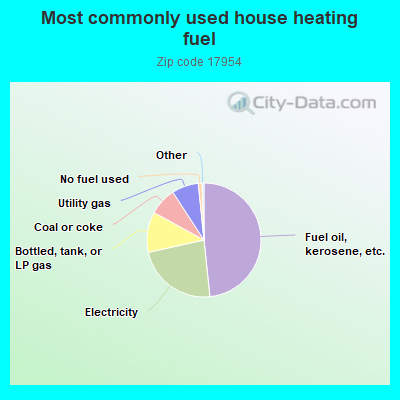
48.4%Fuel oil, kerosene, etc.
23.2%Electricity
11.5%Bottled, tank, or LP gas
7.8%Coal or coke
7.6%Utility gas
1.1%No fuel used
Population in 1990: 4,998.
Place of birth for U.S.-born residents:
This state: 3,966
Northeast: 216
South: 152
West: 51
67% of the 17954 zip code residents lived in the same house 5 years ago. Out of people who lived in different houses, 87% lived in this county. Out of people who lived in different counties, 50% lived in Pennsylvania.
86% of the 17954 zip code residents lived in the same house 1 year ago. Out of people who lived in different houses, 83% moved from this county. Out of people who lived in different houses, 10% moved from different state. Out of people who lived in different houses, 4% moved from abroad.
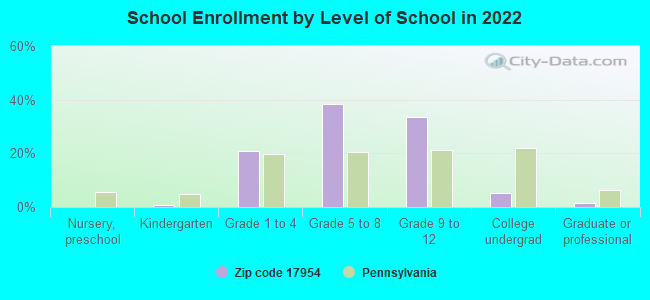
Private vs. public school enrollment:
Students in private schools in grades 1 to 8 (elementary and middle school): 1
Here:
0.3%
Pennsylvania:
15.7%
Students in private schools in grades 9 to 12 (high school):
Here:
0.0%
Pennsylvania:
13.4%
Students in private undergraduate colleges:
Here:
0.0%
Pennsylvania:
39.8%
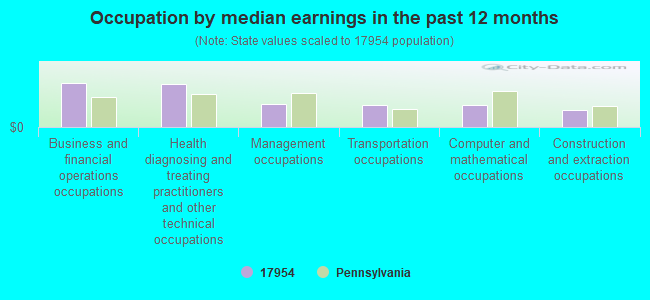
Occupation by median earnings in the past 12 months ($)
110,358Business and financial operations occupations
109,037Health diagnosing and treating practitioners and other technical occupations
57,506Management occupations
56,257Transportation occupations
56,119Computer and mathematical occupations
43,316Construction and extraction occupations
Companies with federal contracts located in this zip code:
CHARLESWORTH SECURITY AGENCY I (442 SUNBURY ST in MINERSVILLE, PA; small business)
$5,500 with Navy for Miscellaneous Office Machines. Signed on 2004-11-24. Completion date: 2005-09-30.
Top industries in this zip code by the number of employees in 2005:
Health Care and Social Assistance: Services for the Elderly and Persons with Disabilities (50-99 employees: 1 establishment, 1-4 employees: 1 establishment)
Finance and Insurance: Commercial Banking (20-49: 2, 5-9: 1)
Other Services (except Public Administration): Religious Organizations (10-19: 1, 5-9: 2, 1-4: 4)
Other Services (except Public Administration): Labor Unions and Similar Labor Organizations (20-49: 1)
People in group quarters in 2010:
6 people in other noninstitutional facilities
People in group quarters in 2000:
12 people in religious group quarters
2003 - 2018 National Fire Incident Reporting System (NFIRS) incidents
Based on the data from the years 2003 - 2018 the average number of fire incidents per year is 13. The highest number of fires - 67 took place in 2016, and the least - 0 in 2004. The data has a growing trend.
When looking into fire subcategories, the most incidents belonged to: Structure Fires (75.1%), and Outside Fires (8.6%).
Fire incident types reported to NFIRS in Zip Code 17954


 Nearest zip codes: 17951, 17901, 17974, 17944, 17970, 17923.
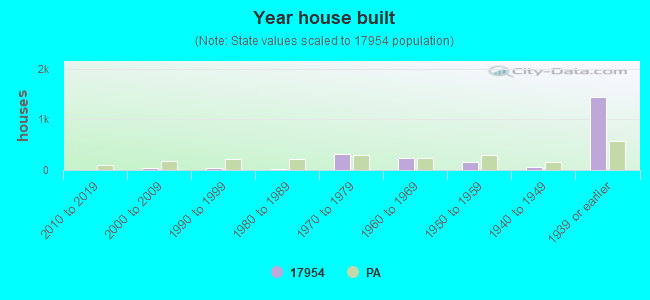


 Based on the data from the years 2003 - 2018 the average number of fire incidents per year is 13. The highest number of fires - 67 took place in 2016, and the least - 0 in 2004. The data has a growing trend.
 When looking into fire subcategories, the most incidents belonged to: Structure Fires (75.1%), and Outside Fires (8.6%).