Estimated zip code population in 2022: 2,545 Zip code population in 2010: 2,751 Zip code population in 2000: 2,738
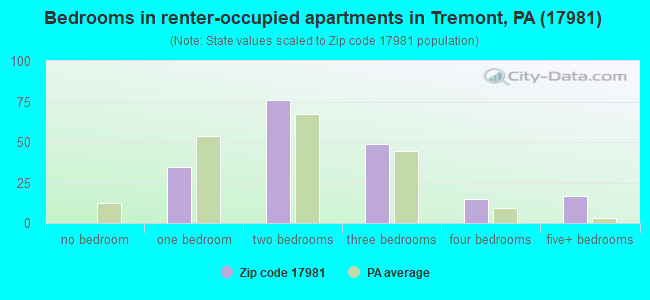
Houses and condos: 1,086 Renter-occupied apartments: 193
% of renters here:
20%
State:
31%
March 2022 cost of living index in zip code 17981: 90.1 (less than average, U.S. average is 100)
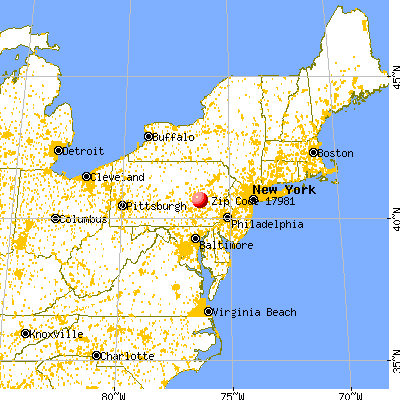
Land area: 27.4 sq. mi. Water area: 0.0 sq. mi.
Population density: 93 people per square mile
(very low).
OSM Map
General Map
Google Map
MSN Map
OSM Map
General Map
Google Map
MSN Map
OSM Map
General Map
Google Map
MSN Map
OSM Map
General Map
Google Map
MSN Map
Please wait while loading the map...
Real estate property taxes paid for housing units in 2022:
This zip code:
1.3% ($1,148)
Pennsylvania:
1.3% ($3,094)
Median real estate property taxes paid for housing units with mortgages in 2022: $1,261 (1.3%) Median real estate property taxes paid for housing units with no mortgage in 2022: $1,085 (1.3%)
Business Search- 14 Million verified businesses
Males: 1,397
(54.9%)
Females: 1,147
(45.1%)
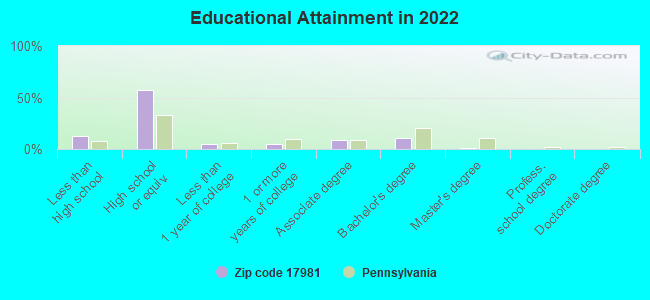
For population 25 years and over in 17981:
High school or higher: 85.6%
Bachelor's degree or higher: 12.3%
Graduate or professional degree: 1.7%
Unemployed: 2.8%
Mean travel time to work (commute): 23.9 minutes
For population 15 years and over in 17981:
Never married: 29.9%
Now married: 48.0%
Separated: 1.6%
Widowed: 10.2%
Divorced: 10.3%
Zip code 17981 compared to state average:
Median house value significantly below state average.
Black race population percentage significantly below state average.
Hispanic race population percentage significantly below state average.
Foreign-born population percentage significantly below state average.
Renting percentage below state average.
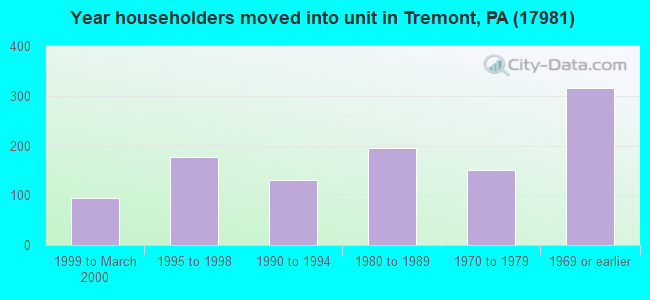
Length of stay since moving in significantly above state average.
House age above state average.
Number of college students below state average.
Percentage of population with a bachelor's degree or higher significantly below state average.
Averages for the 2020 tax year for zip code 17981, filed in 2021:
Average Adjusted Gross Income (AGI) in 2020: $45,543 (Individual Income Tax Returns)
Here:
$45,543
State:
$75,707
Salary/wage: $42,300 (reported on 84.1% of returns)
Here:
$42,300
State:
$62,806
(% of AGI for various income ranges: 972.3% for AGIs below $25k, 3364.9% for AGIs $25k-50k, 5870.6% for AGIs $50k-75k, 8605.0% for AGIs $75k-100k, 13715.0% for AGIs $100k-200k)
Taxable interest for individuals: $354 (reported on 19.0% of returns)
This zip code:
$354
Pennsylvania:
$1,633
(% of AGI for various income ranges: 4.7% for AGIs below $25k, 3.4% for AGIs $25k-50k, 15.0% for AGIs $50k-75k, 8.0% for AGIs $75k-100k, 30.0% for AGIs $100k-200k)
Ordinary dividends: $693 (reported on 11.1% of returns)
Here:
$693
State:
$7,382
(% of AGI for various income ranges: 7.0% for AGIs below $25k, 8.3% for AGIs $25k-50k, 5.6% for AGIs $50k-75k, 15.0% for AGIs $75k-100k, 27.5% for AGIs $100k-200k)
Net capital gain/loss in AGI: +$2,000 (reported on 5.6% of returns)
Here:
+$2,000
State:
+$23,522
(% of AGI for various income ranges: 14.3% for AGIs $25k-50k, 90.0% for AGIs $75k-100k)
Profit/loss from business: +$9,062 (reported on 6.3% of returns)
Here:
+$9,062
State:
+$16,274
(% of AGI for various income ranges: 120.3% for AGIs below $25k, 202.2% for AGIs $50k-75k)
Taxable individual retirement arrangement distribution: $9,340 (reported on 7.9% of returns)
17981:
$9,340
Pennsylvania:
$18,583
(% of AGI for various income ranges: 59.0% for AGIs below $25k, 63.7% for AGIs $25k-50k, 534.0% for AGIs $75k-100k)
Earned income credit: $2,137 (reported on 15.1% of returns)
Here:
$2,137
State:
$2,100
(% of AGI for various income ranges: 68.7% for AGIs below $25k, 57.1% for AGIs $25k-50k)
Percentage of individuals using paid preparers for their 2020 taxes: 93.7%
Here:
94%
State:
92%
(% for various income ranges: 92.7% for AGIs below $25k, 92.7% for AGIs $25k-50k, 95.2% for AGIs $50k-75k, 100.0% for AGIs $75k-100k, 90.9% for AGIs $100k-200k)
Averages for the 2012 tax year for zip code 17981, filed in 2013:
Average Adjusted Gross Income (AGI) in 2012: $35,535 (Individual Income Tax Returns)
Here:
$35,535
State:
$61,346
Salary/wage: $33,271 (reported on 85.5% of returns)
Here:
$33,271
State:
$51,902
(% of AGI for various income ranges: 74.7% for AGIs below $25k, 84.7% for AGIs $25k-50k, 80.2% for AGIs $50k-75k, 81.8% for AGIs $75k-100k, 68.0% for AGIs $100k-200k)
Taxable interest for individuals: $286 (reported on 22.6% of returns)
This zip code:
$286
Pennsylvania:
$1,588
(% of AGI for various income ranges: 0.4% for AGIs below $25k, 0.1% for AGIs $25k-50k, 0.2% for AGIs $50k-75k, 0.3% for AGIs $75k-100k)
Ordinary dividends: $472 (reported on 14.5% of returns)
Here:
$472
State:
$5,827
(% of AGI for various income ranges: 0.5% for AGIs below $25k, 0.2% for AGIs $25k-50k, 0.1% for AGIs $50k-75k, 0.2% for AGIs $75k-100k)
Net capital gain/loss in AGI: +$283 (reported on 4.8% of returns)
Here:
+$283
State:
+$14,495
Profit/loss from business: +$8,670 (reported on 8.1% of returns)
Here:
+$8,670
State:
+$16,268
(% of AGI for various income ranges: 2.7% for AGIs below $25k, 2.2% for AGIs $25k-50k, 3.3% for AGIs $50k-75k)
Taxable individual retirement arrangement distribution: $8,362 (reported on 6.5% of returns)
17981:
$8,362
Pennsylvania:
$14,550
(% of AGI for various income ranges: 2.8% for AGIs below $25k, 0.8% for AGIs $25k-50k, 3.5% for AGIs $50k-75k)
Total itemized deductions: $15,192 (24% of AGI, reported on 10.5% of returns)
Here:
$15,192
State:
$23,538
Here:
24.4% of AGI
State:
18.4% of AGI
(% of AGI for various income ranges: 4.5% for AGIs $25k-50k, 4.3% for AGIs $50k-75k, 11.3% for AGIs $75k-100k)
Charity contributions: $1,550 (reported on 6.5% of returns)
Here:
$1,550
State:
$4,025
(% of AGI for various income ranges: 0.3% for AGIs $25k-50k, 0.3% for AGIs $50k-75k, 0.8% for AGIs $75k-100k)
Taxes paid: $4,023 (reported on 10.5% of returns)
17981:
$4,023
State:
$9,982
(% of AGI for various income ranges: 1.0% for AGIs $25k-50k, 1.4% for AGIs $50k-75k, 3.2% for AGIs $75k-100k)
Earned income credit: $1,958 (reported on 21.0% of returns)
Here:
$1,958
State:
$2,106
(% of AGI for various income ranges: 5.4% for AGIs below $25k, 1.2% for AGIs $25k-50k)
Percentage of individuals using paid preparers for their 2012 taxes: 51.6%
Here:
52%
State:
53%
(% for various income ranges: 47.1% for AGIs below $25k, 52.4% for AGIs $25k-50k, 55.6% for AGIs $50k-75k, 55.6% for AGIs $75k-100k, 75.0% for AGIs $100k-200k)
Averages for the 2004 tax year for zip code 17981, filed in 2005:
Average Adjusted Gross Income (AGI) in 2004: $32,249 (Individual Income Tax Returns)
Here:
$32,249
State:
$48,049
Salary/wage: $30,484 (reported on 87.8% of returns)
Here:
$30,484
State:
$42,646
(% of AGI for various income ranges: 90.3% for AGIs below $10k, 80.1% for AGIs $10k-25k, 87.8% for AGIs $25k-50k, 85.6% for AGIs $50k-75k, 83.9% for AGIs $75k-100k, 50.6% for AGIs over 100k)
Taxable interest for individuals: $705 (reported on 34.8% of returns)
This zip code:
$705
Pennsylvania:
$1,657
(% of AGI for various income ranges: 5.8% for AGIs below $10k, 1.4% for AGIs $10k-25k, 0.6% for AGIs $25k-50k, 0.5% for AGIs $50k-75k, 0.2% for AGIs $75k-100k, 0.4% for AGIs over 100k)
Taxable dividends: $775 (reported on 19.3% of returns)
Here:
$775
State:
$3,566
(% of AGI for various income ranges: 1.0% for AGIs below $10k, 0.4% for AGIs $10k-25k, 0.3% for AGIs $25k-50k, 0.3% for AGIs $50k-75k, 0.2% for AGIs $75k-100k, 2.4% for AGIs over 100k)
Net capital gain/loss: +$426 (reported on 8.4% of returns)
Here:
+$426
State:
+$9,716
(% of AGI for various income ranges: 1.0% for AGIs below $10k, -0.3% for AGIs $10k-25k, 0.2% for AGIs $25k-50k, 0.1% for AGIs $50k-75k, 0.3% for AGIs $75k-100k)
Profit/loss from business: +$6,586 (reported on 9.3% of returns)
Here:
+$6,586
State:
+$14,267
(% of AGI for various income ranges: 1.7% for AGIs below $10k, 3.7% for AGIs $10k-25k, 2.9% for AGIs $25k-50k, 0.9% for AGIs $50k-75k)
IRA payment deduction: $2,154 (reported on 2.2% of returns)
17981:
$2,154
Pennsylvania:
$2,903
Total itemized deductions: $12,476 (21% of AGI, reported on 10.3% of returns)
Here:
$12,476
State:
$18,804
Here:
21.2% of AGI
State:
19.5% of AGI
(% of AGI for various income ranges: 1.5% for AGIs $10k-25k, 2.8% for AGIs $25k-50k, 5.3% for AGIs $50k-75k, 12.7% for AGIs $75k-100k)
Charity contributions deductions: $1,305 (2% of AGI, reported on 7.9% of returns)
Here:
$1,305
State:
$3,337
Here:
2.2% of AGI
State:
3.3% of AGI
Total tax: $3,602 (reported on 73.9% of returns)
17981:
$3,602
State:
$8,008
(% of AGI for various income ranges: 1.6% for AGIs below $10k, 4.8% for AGIs $10k-25k, 7.0% for AGIs $25k-50k, 8.6% for AGIs $50k-75k, 10.4% for AGIs $75k-100k, 19.4% for AGIs over 100k)
Earned income credit: $1,658 (reported on 15.8% of returns)
Here:
$1,658
State:
$1,643
Percentage of individuals using paid preparers for their 2004 taxes: 62.5%
Here:
62%
State:
56%
(% for various income ranges: 56.1% for AGIs below $10k, 60.9% for AGIs $10k-25k, 63.0% for AGIs $25k-50k, 69.5% for AGIs $50k-75k, 71.8% for AGIs $75k-100k, 63.2% for AGIs over 100k)
Likely homosexual households (counted as self-reported same-sex unmarried-partner households)
Lesbian couples: 0.0% of all households
Gay men: 0.2% of all households
Household received Food Stamps/SNAP in the past 12 months: 185 Household did not receive Food Stamps/SNAP in the past 12 months: 780
Women who had a birth in the past 12 months: 31 (20 now married, 10 unmarried) Women who did not have a birth in the past 12 months: 400 (233 now married, 164 unmarried)
Housing units in zip code 17981 with a mortgage: 393 (52 second mortgage, 3 home equity loan, 37 both second mortgage and home equity loan) Houses without a mortgage: 1
Median monthly owner costs for units with a mortgage: $1,005 Median monthly owner costs for units without a mortgage: $478
Residents with income below the poverty level in 2022:
This zip code:
9.1%
Whole state:
11.8%
Residents with income below 50% of the poverty level in 2022:
This zip code:
6.8%
Whole state:
6.1%
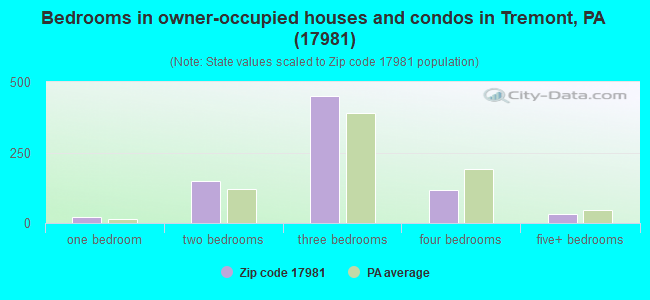
Median number of rooms in houses and condos:
Here:
6.2
State:
6.8
Median number of rooms in apartments:
Here:
4.9
State:
4.3
Notable locations in this zip code not listed on our city pages
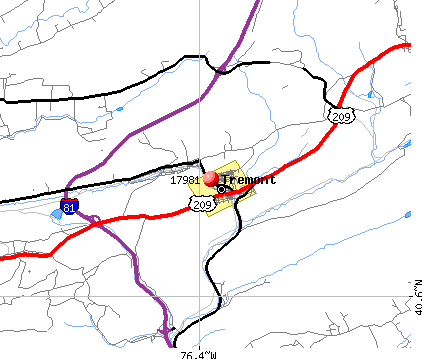
Notable locations in zip code 17981: I-81 Scenic View (A), Tremont Fire Company 1 (B), Donaldson Fire Company 1 (C), Newtown Volunteer Fire Company (D). Display/hide their locations on the map
Streams, rivers, and creeks: Poplar Creek (A), Good Spring Creek (B), Gebhard Run (C), Black Creek (D), Panther Creek (E), Middle Creek (F), Coal Run (G). Display/hide their locations on the map
In group quarters: 204 (-1 institutionalized population)
Size of family households: 319 2-persons, 158 3-persons, 88 4-persons, 41 5-persons, 22 6-persons, 8 7-or-more-persons
Size of nonfamily households: 245 1-person, 55 2-persons, 23 3-persons
301 married couples with children.
129 single-parent households (90 men, 39 women).
96.7% of residents of 17981 zip code speak English at home.
1.3% of residents speak Spanish at home (81% very well, 13% well, 6% not well).
1.2% of residents speak other Indo-European language at home (100% very well).
0.1% of residents speak Asian or Pacific Island language at home (100% very well).
0.2% of residents speak other language at home (100% very well).
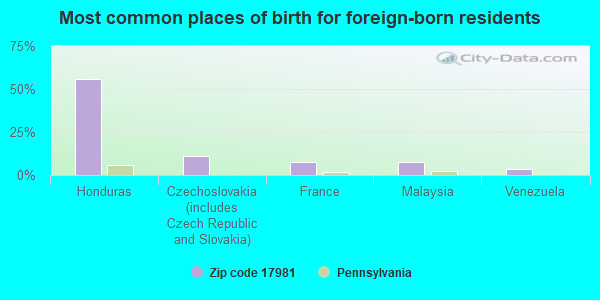
Foreign born population: 27 (1.1%) (100.0% of them are naturalized citizens)
This zip code:
1.1%
Whole state:
7.5%
56%Honduras
11%Czechoslovakia (includes Czech Republic and Slovakia)
7%France
7%Malaysia
4%Venezuela
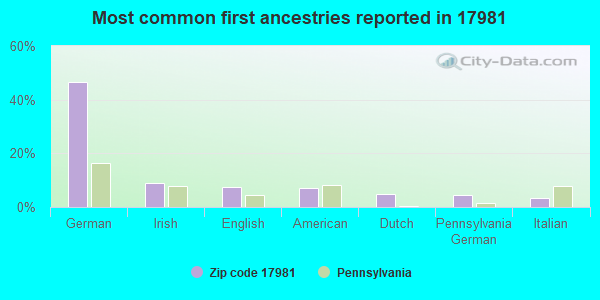
47%German
9%Irish
7%English
7%American
5%Dutch
4%Pennsylvania German
3%Italian
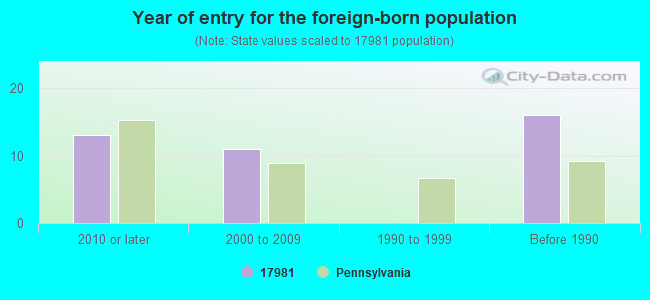
Year of entry for the foreign-born population
132010 or later
112000 to 2009
01990 to 1999
16Before 1990
Housing units lacking complete plumbing facilities: 4.0% Housing units lacking complete kitchen facilities: 3.7%
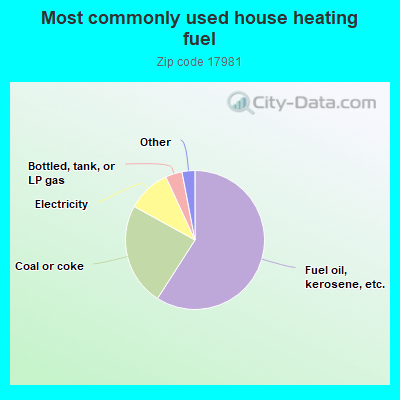
59.2%Fuel oil, kerosene, etc.
24.0%Coal or coke
10.1%Electricity
3.9%Bottled, tank, or LP gas
1.0%No fuel used
0.8%Wood
0.6%Utility gas
0.6%Other fuel
Population in 1990: 2,629. Population change in the 1990s: +109 (+4.1%).
Place of birth for U.S.-born residents:
This state: 2,382
Northeast: 46
Midwest: 28
South: 11
West: 10
72% of the 17981 zip code residents lived in the same house 5 years ago. Out of people who lived in different houses, 74% lived in this county. Out of people who lived in different counties, 50% lived in Pennsylvania.
93% of the 17981 zip code residents lived in the same house 1 year ago. Out of people who lived in different houses, 64% moved from this county. Out of people who lived in different houses, 35% moved from different county within same state.
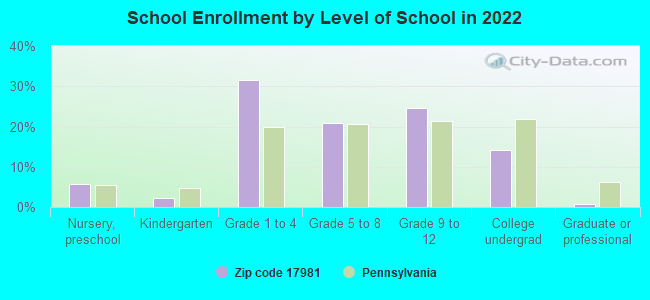
Private vs. public school enrollment:
Students in private schools in grades 1 to 8 (elementary and middle school): 14
Here:
6.1%
Pennsylvania:
15.7%
Students in private schools in grades 9 to 12 (high school):
Here:
0.0%
Pennsylvania:
13.4%
Students in private undergraduate colleges: 14
Here:
22.1%
Pennsylvania:
39.8%
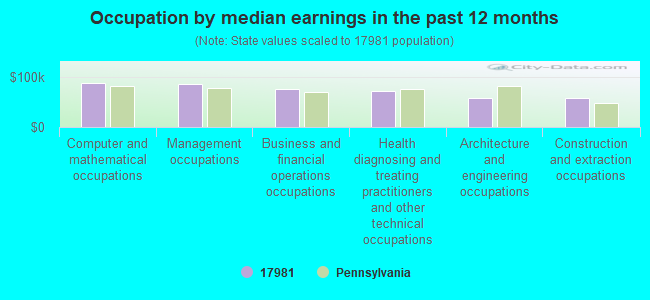
Occupation by median earnings in the past 12 months ($)
87,528Computer and mathematical occupations
84,714Management occupations
75,152Business and financial operations occupations
71,901Health diagnosing and treating practitioners and other technical occupations
57,414Architecture and engineering occupations
56,825Construction and extraction occupations
Top industries in this zip code by the number of employees in 2005:
Health Care and Social Assistance: Nursing Care Facilities (100-249 employees: 1 establishment)
Construction: Other Heavy and Civil Engineering Construction (20-49: 1)
Accommodation and Food Services: Food Service Contractors (20-49: 1)
Utilities: Electric Power Distribution (20-49: 1)
Health Care and Social Assistance: Ambulance Services (10-19: 2)
People in group quarters in 2010:
166 people in nursing facilities/skilled-nursing facilities
11 people in group homes intended for adults
People in group quarters in 2000:
145 people in nursing homes
3 people in homes for the mentally retarded
Fatal accident statistics in 2014:
Fatal accident count: 1
Vehicles involved in fatal accidents: 1
Fatal accidents caused by drunken drivers: 0
Fatalities: 1
Persons involved in fatal accidents: 2
Pedestrians involved in fatal accidents: 0
Fatal accident statistics in 2013:
Fatal accident count: 1
Vehicles involved in fatal accidents: 2
Fatal accidents caused by drunken drivers: 0
Fatalities: 1
Persons involved in fatal accidents: 3
Pedestrians involved in fatal accidents: 0
2003 - 2018 National Fire Incident Reporting System (NFIRS) incidents
Based on the data from the years 2003 - 2018 the average number of fire incidents per year is 12. The highest number of reported fires - 43 took place in 2018, and the least - 0 in 2004. The data has an increasing trend.
When looking into fire subcategories, the most incidents belonged to: Structure Fires (43.5%), and Mobile Property/Vehicle Fires (27.7%).
Fire incident types reported to NFIRS in Zip Code 17981


 Nearest zip codes: 17923, 17963, 17944, 17921, 17901, 17943.
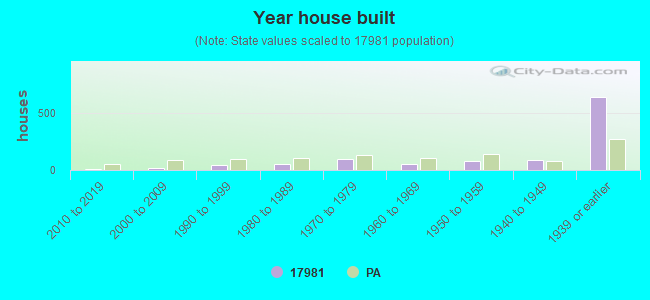


 Based on the data from the years 2003 - 2018 the average number of fire incidents per year is 12. The highest number of reported fires - 43 took place in 2018, and the least - 0 in 2004. The data has an increasing trend.
 When looking into fire subcategories, the most incidents belonged to: Structure Fires (43.5%), and Mobile Property/Vehicle Fires (27.7%).