Estimated zip code population in 2022: 1,459 Zip code population in 2010: 1,620 Zip code population in 2000: 1,542
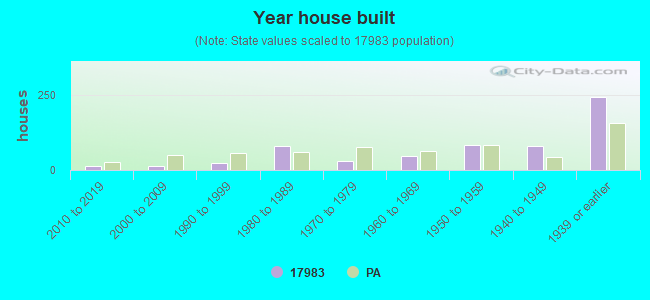
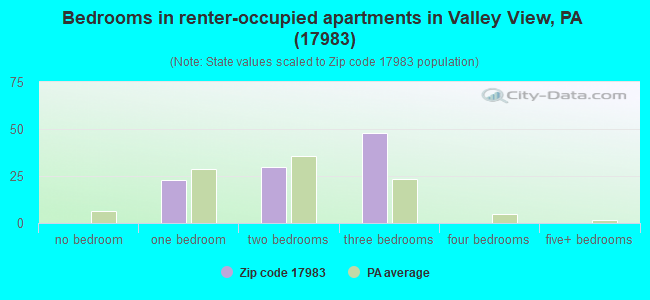
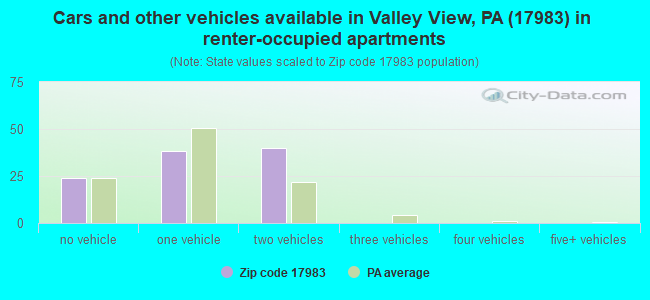
Houses and condos: 625 Renter-occupied apartments: 102
% of renters here:
18%
State:
31%
March 2022 cost of living index in zip code 17983: 91.2 (less than average, U.S. average is 100)
Land area: 2.5 sq. mi. Water area: 0.0 sq. mi.
Population density: 582 people per square mile
(low).
OSM Map
General Map
Google Map
MSN Map
OSM Map
General Map
Google Map
MSN Map
OSM Map
General Map
Google Map
MSN Map
OSM Map
General Map
Google Map
MSN Map
Please wait while loading the map...
Real estate property taxes paid for housing units in 2022:
This zip code:
1.1% ($1,692)
Pennsylvania:
1.3% ($3,094)
Median real estate property taxes paid for housing units with mortgages in 2022: $1,503 (1.0%) Median real estate property taxes paid for housing units with no mortgage in 2022: $1,897 (1.2%)
Business Search- 14 Million verified businesses
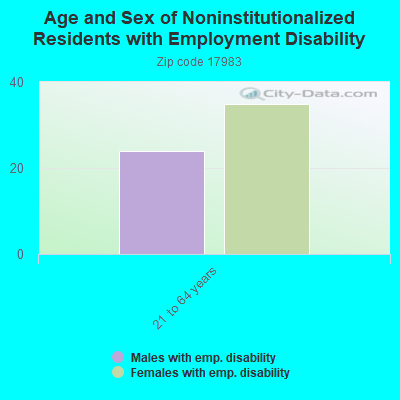
Males: 760
(52.1%)
Females: 698
(47.9%)
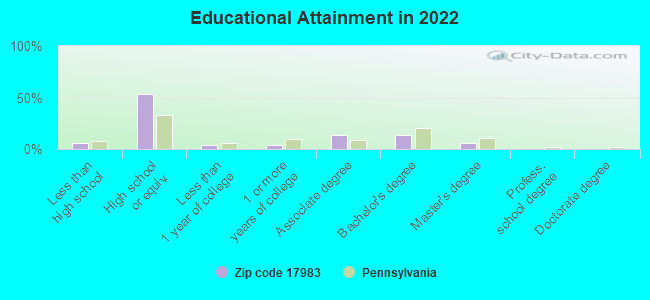
For population 25 years and over in 17983:
High school or higher: 94.0%
Bachelor's degree or higher: 19.5%
Graduate or professional degree: 6.0%
Unemployed: 2.0%
Mean travel time to work (commute): 29.2 minutes
For population 15 years and over in 17983:
Never married: 35.7%
Now married: 52.5%
Separated: 0.7%
Widowed: 5.5%
Divorced: 5.6%
Zip code 17983 compared to state average:
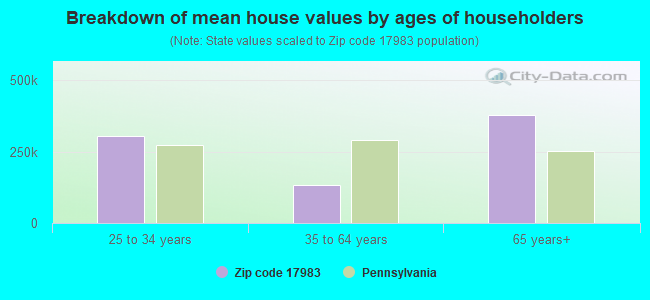
Median house value below state average.
Unemployed percentage below state average.
Black race population percentage significantly below state average.
Hispanic race population percentage significantly below state average.
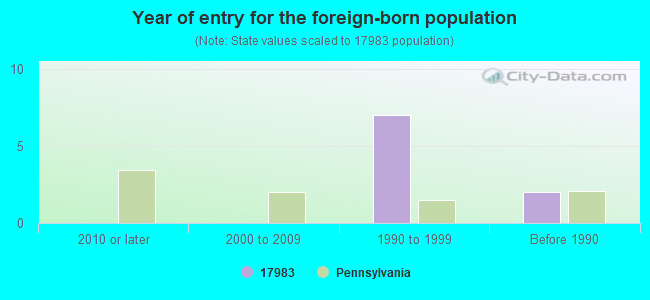
Foreign-born population percentage significantly below state average.
Renting percentage below state average.
Length of stay since moving in significantly below state average.
Percentage of population with a bachelor's degree or higher below state average.
Averages for the 2020 tax year for zip code 17983, filed in 2021:
Average Adjusted Gross Income (AGI) in 2020: $57,337 (Individual Income Tax Returns)
Here:
$57,337
State:
$75,707
Salary/wage: $49,868 (reported on 80.3% of returns)
Here:
$49,868
State:
$62,806
(% of AGI for various income ranges: 1241.0% for AGIs below $25k, 3727.6% for AGIs $25k-50k, 5075.0% for AGIs $50k-75k, 8822.9% for AGIs $75k-100k, 15993.3% for AGIs $100k-200k)
Taxable interest for individuals: $904 (reported on 35.2% of returns)
This zip code:
$904
Pennsylvania:
$1,633
(% of AGI for various income ranges: 62.0% for AGIs below $25k, 14.1% for AGIs $25k-50k, 24.0% for AGIs $50k-75k, 52.9% for AGIs $75k-100k, 131.7% for AGIs $100k-200k)
Ordinary dividends: $3,512 (reported on 22.5% of returns)
Here:
$3,512
State:
$7,382
(% of AGI for various income ranges: 37.0% for AGIs below $25k, 44.1% for AGIs $25k-50k, 177.0% for AGIs $50k-75k, 90.0% for AGIs $75k-100k, 350.0% for AGIs $100k-200k)
Net capital gain/loss in AGI: +$4,962 (reported on 18.3% of returns)
Here:
+$4,962
State:
+$23,522
(% of AGI for various income ranges: 19.0% for AGIs below $25k, 206.0% for AGIs $50k-75k, 230.0% for AGIs $75k-100k, 431.7% for AGIs $100k-200k)
Profit/loss from business: +$9,514 (reported on 9.9% of returns)
Here:
+$9,514
State:
+$16,274
(% of AGI for various income ranges: 186.5% for AGIs $25k-50k, 498.6% for AGIs $75k-100k)
Taxable individual retirement arrangement distribution: $11,930 (reported on 14.1% of returns)
17983:
$11,930
Pennsylvania:
$18,583
(% of AGI for various income ranges: 347.0% for AGIs below $25k, 495.0% for AGIs $50k-75k, 585.0% for AGIs $100k-200k)
Earned income credit: $1,670 (reported on 14.1% of returns)
Here:
$1,670
State:
$2,100
(% of AGI for various income ranges: 52.0% for AGIs below $25k, 67.6% for AGIs $25k-50k)
Percentage of individuals using paid preparers for their 2020 taxes: 97.2%
Here:
97%
State:
92%
(% for various income ranges: 94.7% for AGIs below $25k, 95.0% for AGIs $25k-50k, 100.0% for AGIs $50k-75k, 100.0% for AGIs $75k-100k, 100.0% for AGIs $100k-200k)
Averages for the 2012 tax year for zip code 17983, filed in 2013:
Average Adjusted Gross Income (AGI) in 2012: $42,771 (Individual Income Tax Returns)
Here:
$42,771
State:
$61,346
Salary/wage: $39,385 (reported on 84.7% of returns)
Here:
$39,385
State:
$51,902
(% of AGI for various income ranges: 63.4% for AGIs below $25k, 84.3% for AGIs $25k-50k, 78.9% for AGIs $50k-75k, 82.3% for AGIs $75k-100k, 73.1% for AGIs $100k-200k)
Taxable interest for individuals: $1,107 (reported on 40.3% of returns)
This zip code:
$1,107
Pennsylvania:
$1,588
(% of AGI for various income ranges: 3.3% for AGIs below $25k, 1.2% for AGIs $25k-50k, 1.2% for AGIs $50k-75k, 0.3% for AGIs $75k-100k, 0.2% for AGIs $100k-200k)
Ordinary dividends: $2,042 (reported on 26.4% of returns)
Here:
$2,042
State:
$5,827
(% of AGI for various income ranges: 3.0% for AGIs below $25k, 0.8% for AGIs $25k-50k, 1.2% for AGIs $50k-75k, 2.0% for AGIs $100k-200k)
Profit/loss from business: +$6,450 (reported on 11.1% of returns)
Here:
+$6,450
State:
+$16,268
(% of AGI for various income ranges: 3.5% for AGIs below $25k, 1.9% for AGIs $25k-50k, 3.5% for AGIs $50k-75k)
Taxable individual retirement arrangement distribution: $8,408 (reported on 16.7% of returns)
17983:
$8,408
Pennsylvania:
$14,550
Total itemized deductions: $15,823 (20% of AGI, reported on 18.1% of returns)
Here:
$15,823
State:
$23,538
Here:
20.2% of AGI
State:
18.4% of AGI
(% of AGI for various income ranges: 5.2% for AGIs $25k-50k, 7.9% for AGIs $50k-75k, 8.2% for AGIs $75k-100k, 9.1% for AGIs $100k-200k)
Charity contributions: $3,256 (reported on 12.5% of returns)
Here:
$3,256
State:
$4,025
(% of AGI for various income ranges: 1.1% for AGIs below $25k, 1.8% for AGIs $50k-75k, 1.9% for AGIs $100k-200k)
Taxes paid: $5,346 (reported on 18.1% of returns)
17983:
$5,346
State:
$9,982
(% of AGI for various income ranges: 1.2% for AGIs $25k-50k, 2.4% for AGIs $50k-75k, 2.7% for AGIs $75k-100k, 4.0% for AGIs $100k-200k)
Earned income credit: $1,610 (reported on 13.9% of returns)
Here:
$1,610
State:
$2,106
(% of AGI for various income ranges: 3.6% for AGIs below $25k, 0.6% for AGIs $25k-50k)
Percentage of individuals using paid preparers for their 2012 taxes: 68.1%
Here:
68%
State:
53%
(% for various income ranges: 63.0% for AGIs below $25k, 69.6% for AGIs $25k-50k, 72.7% for AGIs $50k-75k, 66.7% for AGIs $75k-100k, 80.0% for AGIs $100k-200k)
Averages for the 2004 tax year for zip code 17983, filed in 2005:
Average Adjusted Gross Income (AGI) in 2004: $39,619 (Individual Income Tax Returns)
Here:
$39,619
State:
$48,049
Salary/wage: $35,595 (reported on 83.3% of returns)
Here:
$35,595
State:
$42,646
(% of AGI for various income ranges: 75.9% for AGIs below $10k, 74.4% for AGIs $10k-25k, 85.2% for AGIs $25k-50k, 79.7% for AGIs $50k-75k, 75.0% for AGIs $75k-100k, 53.4% for AGIs over 100k)
Taxable interest for individuals: $1,430 (reported on 57.2% of returns)
This zip code:
$1,430
Pennsylvania:
$1,657
(% of AGI for various income ranges: 9.5% for AGIs below $10k, 3.2% for AGIs $10k-25k, 1.5% for AGIs $25k-50k, 2.5% for AGIs $50k-75k, 1.0% for AGIs $75k-100k, 1.9% for AGIs over 100k)
Taxable dividends: $2,943 (reported on 32.9% of returns)
Here:
$2,943
State:
$3,566
(% of AGI for various income ranges: 8.9% for AGIs below $10k, 2.3% for AGIs $10k-25k, 0.5% for AGIs $25k-50k, 1.3% for AGIs $50k-75k, 3.6% for AGIs $75k-100k, 5.4% for AGIs over 100k)
Profit/loss from business: +$6,917 (reported on 12.0% of returns)
Here:
+$6,917
State:
+$14,267
(% of AGI for various income ranges: 4.2% for AGIs below $10k, 2.4% for AGIs $10k-25k, 2.7% for AGIs $25k-50k, 2.9% for AGIs $50k-75k, 1.7% for AGIs $75k-100k)
IRA payment deduction: $2,607 (reported on 4.0% of returns)
17983:
$2,607
Pennsylvania:
$2,903
Total itemized deductions: $13,237 (17% of AGI, reported on 19.3% of returns)
Here:
$13,237
State:
$18,804
Here:
16.6% of AGI
State:
19.5% of AGI
(% of AGI for various income ranges: 6.3% for AGIs $25k-50k, 8.0% for AGIs $50k-75k, 6.7% for AGIs $75k-100k, 8.4% for AGIs over 100k)
Charity contributions deductions: $2,780 (3% of AGI, reported on 16.9% of returns)
Here:
$2,780
State:
$3,337
Here:
3.3% of AGI
State:
3.3% of AGI
(% of AGI for various income ranges: 0.7% for AGIs $25k-50k, 1.3% for AGIs $50k-75k, 1.1% for AGIs $75k-100k, 2.6% for AGIs over 100k)
Total tax: $5,345 (reported on 76.7% of returns)
17983:
$5,345
State:
$8,008
(% of AGI for various income ranges: 2.7% for AGIs below $10k, 4.0% for AGIs $10k-25k, 7.5% for AGIs $25k-50k, 8.8% for AGIs $50k-75k, 11.3% for AGIs $75k-100k, 19.9% for AGIs over 100k)
Earned income credit: $1,500 (reported on 9.4% of returns)
Here:
$1,500
State:
$1,643
Percentage of individuals using paid preparers for their 2004 taxes: 73.0%
Here:
73%
State:
56%
(% for various income ranges: 71.9% for AGIs below $10k, 76.6% for AGIs $10k-25k, 67.6% for AGIs $25k-50k, 73.6% for AGIs $50k-75k, 81.6% for AGIs $75k-100k, 78.1% for AGIs over 100k)
Household received Food Stamps/SNAP in the past 12 months: 56 Household did not receive Food Stamps/SNAP in the past 12 months: 511
Women who had a birth in the past 12 months: 9 (9 now married, 0 unmarried) Women who did not have a birth in the past 12 months: 330 (116 now married, 213 unmarried)
Housing units in zip code 17983 with a mortgage: 320 (40 second mortgage, 38 both second mortgage and home equity loan) Houses without a mortgage: 39
Median monthly owner costs for units with a mortgage: $1,111 Median monthly owner costs for units without a mortgage: $582
Residents with income below the poverty level in 2022:
This zip code:
10.2%
Whole state:
11.8%
Residents with income below 50% of the poverty level in 2022:
This zip code:
3.0%
Whole state:
6.1%
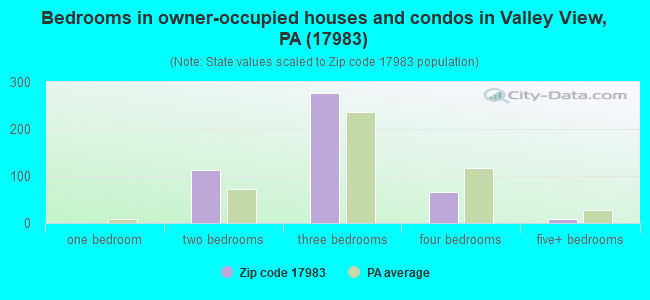
Median number of rooms in houses and condos:
Here:
6.6
State:
6.8
Median number of rooms in apartments:
Here:
4.8
State:
4.3
Notable locations in this zip code not listed on our city pages
In group quarters: 1 (-1 institutionalized population)
Size of family households: 170 2-persons, 134 3-persons, 109 4-persons, 17 5-persons, 7 6-persons
Size of nonfamily households: 114 1-person, 5 4-persons
200 married couples with children.
148 single-parent households (63 men, 85 women).
97.4% of residents of 17983 zip code speak English at home.
1.5% of residents speak other Indo-European language at home (29% very well, 71% not well).
Foreign born population: 3 (0.2%) (100.0% of them are naturalized citizens)
This zip code:
0.2%
Whole state:
7.5%
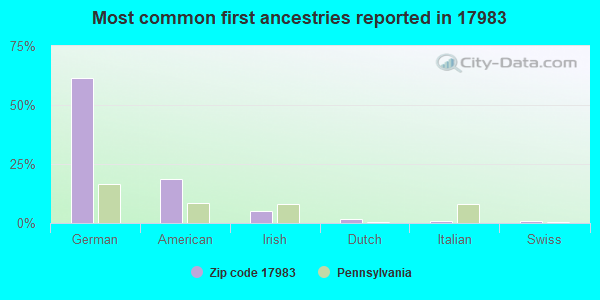
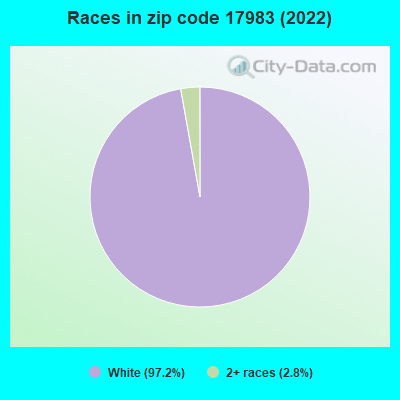
62%German
18%American
5%Irish
2%Dutch
1%Italian
1%Swiss
Year of entry for the foreign-born population
02010 or later
02000 to 2009
71990 to 1999
2Before 1990
Facilities with environmental interests located in this zip code:
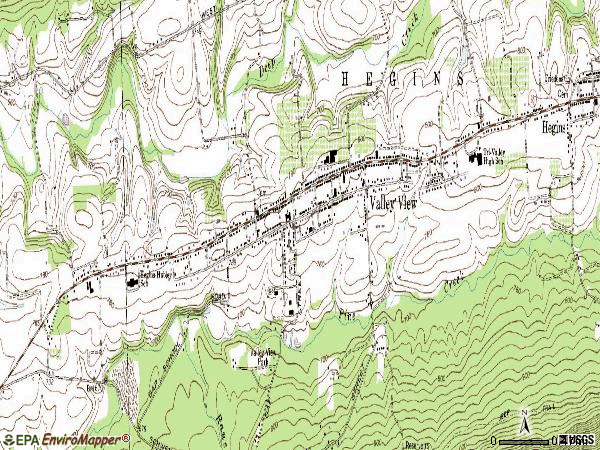
AGWAY INC/VALLEY VIEW (HEGINS VALLEY in VALLEY VIEW, PA)
AIR MINOR (AIRS/AFS) Business SIC classification: PREPARED FEEDS AND FEED INGREDIENTS FOR ANIMALS AND FOWLS, EXCEPT DOGS AND CATS
Housing units lacking complete plumbing facilities: 4.6% Housing units lacking complete kitchen facilities: 3.8%
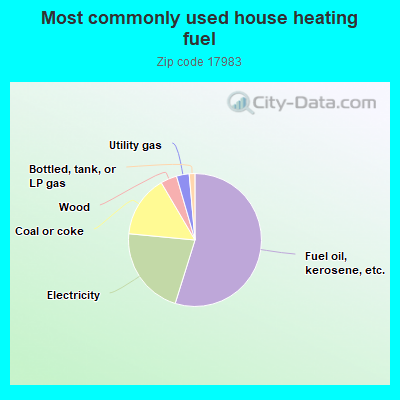
55.1%Fuel oil, kerosene, etc.
21.8%Electricity
15.1%Coal or coke
4.0%Wood
3.1%Utility gas
1.4%Bottled, tank, or LP gas
Population in 1990: 2,007.
Place of birth for U.S.-born residents:
This state: 1,338
Northeast: 38
South: 13
West: 45
78% of the 17983 zip code residents lived in the same house 5 years ago. Out of people who lived in different houses, 67% lived in this county. Out of people who lived in different counties, 50% lived in Pennsylvania.
92% of the 17983 zip code residents lived in the same house 1 year ago. Out of people who lived in different houses, 57% moved from this county. Out of people who lived in different houses, 42% moved from different county within same state.
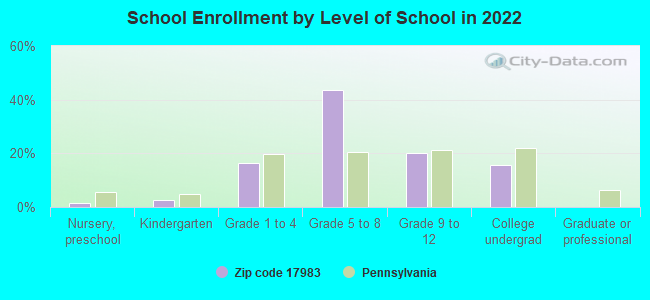
Private vs. public school enrollment:
Students in private schools in grades 1 to 8 (elementary and middle school): 10
Here:
5.3%
Pennsylvania:
15.7%
Students in private schools in grades 9 to 12 (high school):
Here:
0.0%
Pennsylvania:
13.4%
Students in private undergraduate colleges: 9
Here:
18.4%
Pennsylvania:
39.8%
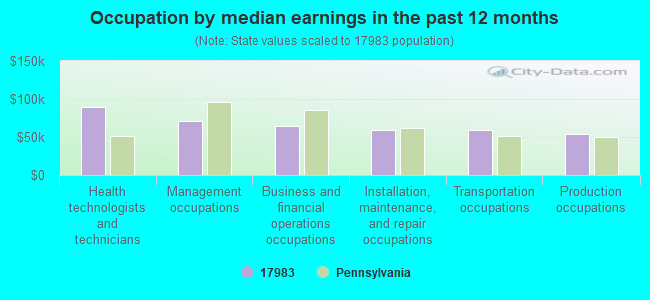
Occupation by median earnings in the past 12 months ($)
89,547Health technologists and technicians
71,014Management occupations
63,849Business and financial operations occupations
59,579Installation, maintenance, and repair occupations
59,133Transportation occupations
53,728Production occupations
Top industries in this zip code by the number of employees in 2005:
Construction: Land Subdivision (20-49 employees: 1 establishment)
Professional, Scientific, and Technical Services: Other Accounting Services (10-19: 1)
Other Services (except Public Administration): Religious Organizations (5-9: 1, 1-4: 3)
Construction: New Single-Family Housing Construction (except Operative Builders) (5-9: 1, 1-4: 1)
Most common first names in zip code 17983 among deceased individuals
Name
Count
Lived (average)
Robert
18
72.3 years
Mary
18
81.0 years
John
15
76.1 years
Harry
15
77.7 years
Charles
12
77.0 years
Margaret
9
74.3 years
Mabel
9
82.7 years
Lloyd
9
72.5 years
Eva
8
80.6 years
Dorothy
8
80.1 years
Most common last names in zip code 17983 among deceased individuals
Last name
Count
Lived (average)
Klinger
30
71.6 years
Miller
25
79.5 years
Bixler
20
71.9 years
Schwalm
20
75.9 years
Harner
16
73.9 years
Herb
14
74.9 years
Morgan
14
71.3 years
Schlegel
14
80.2 years
Ney
12
72.7 years
Shade
12
76.2 years
Businesses in zip code 17983
Ford: 1
La-Z-Boy: 1
RadioShack: 1
Discuss Valley View, Pennsylvania (PA) on our hugely popular Pennsylvania forum.


 Nearest zip codes: 17938, 17957, 17968, 17978, 17941, 17964.