Estimated zip code population in 2022: 727 Zip code population in 2010: 1,228 Zip code population in 2000: 1,262
Houses and condos: 380 Renter-occupied apartments: 33
% of renters here:
10%
State:
31%
March 2022 cost of living index in zip code 18059: 94.8 (less than average, U.S. average is 100)
Land area: 1.6 sq. mi. Water area: 0.1 sq. mi.
Population density: 454 people per square mile
(low).
OSM Map
General Map
Google Map
MSN Map
OSM Map
General Map
Google Map
MSN Map
OSM Map
General Map
Google Map
MSN Map
OSM Map
General Map
Google Map
MSN Map
Please wait while loading the map...
Real estate property taxes paid for housing units in 2022:
This zip code:
1.4% ($5,343)
Pennsylvania:
1.3% ($3,094)
Median real estate property taxes paid for housing units with mortgages in 2022: $5,396 (1.4%) Median real estate property taxes paid for housing units with no mortgage in 2022: $5,235 (1.2%)
Business Search- 14 Million verified businesses
Males: 346
(47.6%)
Females: 380
(52.4%)
For population 25 years and over in 18059:
High school or higher: 91.9%
Bachelor's degree or higher: 40.1%
Graduate or professional degree: 13.3%
Mean travel time to work (commute): 32.4 minutes
For population 15 years and over in 18059:
Never married: 15.6%
Now married: 72.8%
Separated: 1.1%
Widowed: 2.7%
Divorced: 7.8%
Zip code 18059 compared to state average:
Median household income above state average.
Median house value above state average.
Unemployed percentage significantly below state average.
Black race population percentage significantly below state average.
Hispanic race population percentage significantly below state average.
Median age significantly above state average.
Renting percentage significantly below state average.
Length of stay since moving in significantly above state average.
Estimated median house/condo value in 2022: $393,321
18059:
$393,321
Pennsylvania:
$245,500
Median resident age:
This zip code:
55.5 years
Pennsylvania median age:
40.9 years
Average household size:
This zip code:
2.2 people
Pennsylvania:
2.4 people
Averages for the 2020 tax year for zip code 18059, filed in 2021:
Average Adjusted Gross Income (AGI) in 2020: $81,208 (Individual Income Tax Returns)
Here:
$81,208
State:
$75,707
Salary/wage: $72,989 (reported on 83.1% of returns)
Here:
$72,989
State:
$62,806
(% of AGI for various income ranges: 1089.2% for AGIs below $25k, 3469.2% for AGIs $25k-50k, 5672.9% for AGIs $50k-75k, 7575.0% for AGIs $75k-100k, 15241.0% for AGIs $100k-200k)
Taxable interest for individuals: $1,055 (reported on 33.8% of returns)
This zip code:
$1,055
Pennsylvania:
$1,633
(% of AGI for various income ranges: 10.8% for AGIs below $25k, 18.3% for AGIs $25k-50k, 34.3% for AGIs $50k-75k, 87.0% for AGIs $100k-200k)
Ordinary dividends: $2,876 (reported on 26.2% of returns)
Here:
$2,876
State:
$7,382
(% of AGI for various income ranges: 51.7% for AGIs $25k-50k, 110.0% for AGIs $50k-75k, 232.0% for AGIs $100k-200k)
Net capital gain/loss in AGI: +$8,469 (reported on 20.0% of returns)
Here:
+$8,469
State:
+$23,522
(% of AGI for various income ranges: 0.8% for AGIs below $25k, 92.9% for AGIs $50k-75k, 467.0% for AGIs $100k-200k)
Profit/loss from business: +$11,775 (reported on 12.3% of returns)
Here:
+$11,775
State:
+$16,274
(% of AGI for various income ranges: 130.8% for AGIs below $25k, 229.2% for AGIs $25k-50k, 1275.0% for AGIs $75k-100k)
Taxable individual retirement arrangement distribution: $17,440 (reported on 7.7% of returns)
18059:
$17,440
Pennsylvania:
$18,583
(% of AGI for various income ranges: 169.2% for AGIs below $25k, 669.0% for AGIs $100k-200k)
Total itemized deductions: $25,950 (reported on 6.2% of returns)
Here:
$25,950
State:
$34,850
(% of AGI for various income ranges: 1038.0% for AGIs $100k-200k)
Charity contributions: $4,167 (reported on 4.6% of returns)
Here:
$4,167
State:
$12,392
(% of AGI for various income ranges: 125.0% for AGIs $100k-200k)
Taxes paid: $8,750 (reported on 6.2% of returns)
18059:
$8,750
State:
$8,200
(% of AGI for various income ranges: 350.0% for AGIs $100k-200k)
Earned income credit: $2,171 (reported on 10.8% of returns)
Here:
$2,171
State:
$2,100
(% of AGI for various income ranges: 55.8% for AGIs below $25k, 70.8% for AGIs $25k-50k)
Percentage of individuals using paid preparers for their 2020 taxes: 90.8%
Here:
91%
State:
92%
(% for various income ranges: 88.9% for AGIs below $25k, 93.3% for AGIs $25k-50k, 100.0% for AGIs $50k-75k, 80.0% for AGIs $75k-100k, 92.9% for AGIs $100k-200k, 80.0% for AGIs over 200k)
Averages for the 2012 tax year for zip code 18059, filed in 2013:
Average Adjusted Gross Income (AGI) in 2012: $60,813 (Individual Income Tax Returns)
Here:
$60,813
State:
$61,346
Salary/wage: $57,335 (reported on 90.5% of returns)
Here:
$57,335
State:
$51,902
(% of AGI for various income ranges: 76.3% for AGIs below $25k, 80.2% for AGIs $25k-50k, 76.3% for AGIs $50k-75k, 85.2% for AGIs $75k-100k, 86.7% for AGIs $100k-200k, 95.0% for AGIs over 200k)
Taxable interest for individuals: $404 (reported on 36.5% of returns)
This zip code:
$404
Pennsylvania:
$1,588
(% of AGI for various income ranges: 0.6% for AGIs below $25k, 0.5% for AGIs $25k-50k, 0.5% for AGIs $50k-75k, 0.3% for AGIs $75k-100k, 0.2% for AGIs $100k-200k)
Ordinary dividends: $1,759 (reported on 27.0% of returns)
Here:
$1,759
State:
$5,827
(% of AGI for various income ranges: 1.5% for AGIs below $25k, 0.6% for AGIs $25k-50k, 1.2% for AGIs $50k-75k, 1.1% for AGIs $100k-200k)
Net capital gain/loss in AGI: +$1,125 (reported on 12.7% of returns)
Here:
+$1,125
State:
+$14,495
(% of AGI for various income ranges: 0.1% for AGIs below $25k, 0.6% for AGIs $100k-200k)
Profit/loss from business: +$12,214 (reported on 11.1% of returns)
Here:
+$12,214
State:
+$16,268
(% of AGI for various income ranges: 5.4% for AGIs below $25k, 4.8% for AGIs $25k-50k, 3.1% for AGIs $100k-200k)
Taxable individual retirement arrangement distribution: $10,920 (reported on 7.9% of returns)
18059:
$10,920
Pennsylvania:
$14,550
Total itemized deductions: $20,950 (18% of AGI, reported on 38.1% of returns)
Here:
$20,950
State:
$23,538
Here:
18.0% of AGI
State:
18.4% of AGI
(% of AGI for various income ranges: 13.0% for AGIs $25k-50k, 12.5% for AGIs $50k-75k, 12.7% for AGIs $75k-100k, 16.0% for AGIs $100k-200k, 11.8% for AGIs over 200k)
Charity contributions: $2,605 (reported on 30.2% of returns)
Here:
$2,605
State:
$4,025
(% of AGI for various income ranges: 1.1% for AGIs below $25k, 0.7% for AGIs $50k-75k, 1.1% for AGIs $75k-100k, 1.7% for AGIs $100k-200k, 1.4% for AGIs over 200k)
Taxes paid: $9,225 (reported on 38.1% of returns)
18059:
$9,225
State:
$9,982
(% of AGI for various income ranges: 4.0% for AGIs $25k-50k, 4.2% for AGIs $50k-75k, 5.5% for AGIs $75k-100k, 7.3% for AGIs $100k-200k, 6.5% for AGIs over 200k)
Earned income credit: $1,843 (reported on 11.1% of returns)
Here:
$1,843
State:
$2,106
(% of AGI for various income ranges: 4.5% for AGIs below $25k)
Percentage of individuals using paid preparers for their 2012 taxes: 49.2%
Here:
49%
State:
53%
(% for various income ranges: 44.4% for AGIs below $25k, 55.6% for AGIs $25k-50k, 42.9% for AGIs $50k-75k, 50.0% for AGIs $75k-100k, 66.7% for AGIs $100k-200k)
Averages for the 2004 tax year for zip code 18059, filed in 2005:
Average Adjusted Gross Income (AGI) in 2004: $53,978 (Individual Income Tax Returns)
Here:
$53,978
State:
$48,049
Salary/wage: $52,743 (reported on 88.3% of returns)
Here:
$52,743
State:
$42,646
(% of AGI for various income ranges: 86.9% for AGIs below $10k, 75.7% for AGIs $10k-25k, 83.9% for AGIs $25k-50k, 82.2% for AGIs $50k-75k, 90.0% for AGIs $75k-100k, 87.8% for AGIs over 100k)
Taxable interest for individuals: $562 (reported on 54.1% of returns)
This zip code:
$562
Pennsylvania:
$1,657
(% of AGI for various income ranges: 2.1% for AGIs below $10k, 0.9% for AGIs $10k-25k, 0.7% for AGIs $25k-50k, 0.8% for AGIs $50k-75k, 0.4% for AGIs $75k-100k, 0.5% for AGIs over 100k)
Taxable dividends: $1,351 (reported on 32.3% of returns)
Here:
$1,351
State:
$3,566
(% of AGI for various income ranges: 0.9% for AGIs below $10k, 0.8% for AGIs $10k-25k, 1.4% for AGIs $25k-50k, 0.8% for AGIs $50k-75k, 0.3% for AGIs $75k-100k, 0.9% for AGIs over 100k)
Net capital gain/loss: +$1,398 (reported on 22.5% of returns)
Here:
+$1,398
State:
+$9,716
(% of AGI for various income ranges: -2.2% for AGIs below $10k, -0.4% for AGIs $25k-50k, -0.1% for AGIs $50k-75k, 0.0% for AGIs $75k-100k, 1.5% for AGIs over 100k)
Profit/loss from business: +$15,177 (reported on 10.5% of returns)
Here:
+$15,177
State:
+$14,267
(% of AGI for various income ranges: 10.0% for AGIs $10k-25k, 3.9% for AGIs $25k-50k, 4.8% for AGIs $50k-75k, 2.7% for AGIs over 100k)
IRA payment deduction: $2,909 (reported on 1.9% of returns)
18059:
$2,909
Pennsylvania:
$2,903
Total itemized deductions: $17,980 (19% of AGI, reported on 43.0% of returns)
Here:
$17,980
State:
$18,804
Here:
19.2% of AGI
State:
19.5% of AGI
(% of AGI for various income ranges: 26.9% for AGIs below $10k, 10.5% for AGIs $25k-50k, 12.9% for AGIs $50k-75k, 18.7% for AGIs $75k-100k, 15.0% for AGIs over 100k)
Charity contributions deductions: $2,295 (2% of AGI, reported on 38.4% of returns)
Here:
$2,295
State:
$3,337
Here:
2.3% of AGI
State:
3.3% of AGI
(% of AGI for various income ranges: 1.1% for AGIs $25k-50k, 1.2% for AGIs $50k-75k, 1.7% for AGIs $75k-100k, 2.1% for AGIs over 100k)
Total tax: $7,624 (reported on 79.2% of returns)
18059:
$7,624
State:
$8,008
(% of AGI for various income ranges: 2.2% for AGIs below $10k, 4.7% for AGIs $10k-25k, 7.8% for AGIs $25k-50k, 9.2% for AGIs $50k-75k, 9.1% for AGIs $75k-100k, 14.8% for AGIs over 100k)
Earned income credit: $1,509 (reported on 9.0% of returns)
Here:
$1,509
State:
$1,643
Percentage of individuals using paid preparers for their 2004 taxes: 47.0%
Here:
47%
State:
56%
(% for various income ranges: 35.4% for AGIs below $10k, 46.0% for AGIs $10k-25k, 51.4% for AGIs $25k-50k, 52.6% for AGIs $50k-75k, 43.6% for AGIs $75k-100k, 56.4% for AGIs over 100k)
Size of family households: 165 2-persons, 56 3-persons, 30 4-persons, 9 5-persons
Size of nonfamily households: 63 1-person, 11 2-persons
56 married couples with children.
0 single-parent households ().
91.4% of residents of 18059 zip code speak English at home.
5.2% of residents speak other Indo-European language at home (100% not well).
2.2% of residents speak other language at home (100% very well).
Foreign born population: 71 (9.9%) (100.0% of them are naturalized citizens)
This zip code:
9.9%
Whole state:
7.5%
27%North Macedonia (Macedonia)
24%Croatia
24%Japan
23%German
13%English
11%Pennsylvania German
10%Italian
8%Polish
7%Ukrainian
6%American
Year of entry for the foreign-born population
02010 or later
162000 to 2009
01990 to 1999
55Before 1990
Facilities with environmental interests located in this zip code:
BRADERS WOODCRAFT (RTE 145 in LAURYS STATION, PA)
STATE MASTER (Pennsylvania database) - RCRIS-PAD002398592, HAZARDOUS WASTE PROGRAM Small Quantity Generators, between 100 kg and 1000 kg of hazardous waste/month (Resource Conservation and Recovery Act (tracking hazardous waste)) - notification Business SIC classification: WOOD HOUSEHOLD FURNITURE, EXCEPT UPHOLSTERED Organizations: OPERNAME (CONTACT/OPERATOR)
, BRADER CHARLES E (CONTACT/OWNER)
Housing units lacking complete kitchen facilities: 2.2%
47.9%Electricity
44.3%Fuel oil, kerosene, etc.
6.7%Bottled, tank, or LP gas
1.5%Other fuel
Place of birth for U.S.-born residents:
This state: 570
Northeast: 73
71% of the 18059 zip code residents lived in the same house 5 years ago. Out of people who lived in different houses, 47% lived in this county. Out of people who lived in different counties, 50% lived in Pennsylvania.
98% of the 18059 zip code residents lived in the same house 1 year ago. Out of people who lived in different houses, 108% moved from this county.
Private vs. public school enrollment:
Students in private schools in grades 1 to 8 (elementary and middle school):
Here:
0.0%
Pennsylvania:
15.7%
Students in private schools in grades 9 to 12 (high school):
Here:
0.0%
Pennsylvania:
13.4%
Students in private undergraduate colleges:
Here:
0.0%
Pennsylvania:
39.8%
Occupation by median earnings in the past 12 months ($)
113,393Management occupations
111,200Business and financial operations occupations
109,235Health diagnosing and treating practitioners and other technical occupations
57,697Sales and related occupations
57,632Computer and mathematical occupations
46,217Office and administrative support occupations
Top industries in this zip code by the number of employees in 2005:
Health Care and Social Assistance: Offices of Physicians (except Mental Health Specialists) (10-19 employees: 2 establishments, 5-9 employees: 1 establishment, 1-4 employees: 1 establishment)
Construction: Plumbing, Heating, and Air-Conditioning Contractors (10-19: 1)
Health Care and Social Assistance: Offices of Dentists (5-9: 1)
Accommodation and Food Services: Full-Service Restaurants (5-9: 1)
Health Care and Social Assistance: Offices of Physical, Occupational and Speech Therapists, and Audiologists (5-9: 1)
Wholesale Trade: Wholesale Trade Agents and Brokers (1-4: 1)
Other Services (except Public Administration): Religious Organizations (1-4: 1)
Fatal accident statistics in 2014:
Fatal accident count: 1
Vehicles involved in fatal accidents: 2
Fatal accidents caused by drunken drivers: 0
Fatalities: 1
Persons involved in fatal accidents: 3
Pedestrians involved in fatal accidents: 0
Fatal accident statistics in 2013:
Fatal accident count: 1
Vehicles involved in fatal accidents: 2
Fatal accidents caused by drunken drivers: 0
Fatalities: 1
Persons involved in fatal accidents: 2
Pedestrians involved in fatal accidents: 0
Home Mortgage Disclosure Act Aggregated Statistics For Year 2009 (Based on 2 partial tracts)
A) FHA, FSA/RHS & VA Home Purchase Loans
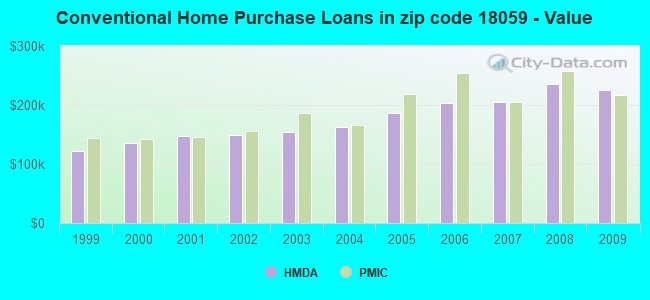
B) Conventional Home Purchase Loans
C) Refinancings
D) Home Improvement Loans
F) Non-occupant Loans on < 5 Family Dwellings (A B C & D)
G) Loans On Manufactured Home Dwelling (A B C & D)
Number
Average Value
Number
Average Value
Number
Average Value
Number
Average Value
Number
Average Value
Number
Average Value
LOANS ORIGINATED
4
$246,935
8
$225,884
44
$197,197
8
$69,754
1
$275,090
1
$28,710
APPLICATIONS APPROVED, NOT ACCEPTED
0
$0
0
$0
2
$243,325
0
$0
0
$0
0
$0
APPLICATIONS DENIED
1
$146,280
1
$139,710
12
$242,485
2
$48,760
0
$0
0
$0
APPLICATIONS WITHDRAWN
0
$0
1
$225,840
6
$200,313
0
$0
0
$0
0
$0
FILES CLOSED FOR INCOMPLETENESS
0
$0
0
$0
1
$241,400
0
$0
0
$0
0
$0
Aggregated Statistics For Year 2008 (Based on 2 partial tracts)
A) FHA, FSA/RHS & VA Home Purchase Loans
B) Conventional Home Purchase Loans
C) Refinancings
D) Home Improvement Loans
F) Non-occupant Loans on < 5 Family Dwellings (A B C & D)
G) Loans On Manufactured Home Dwelling (A B C & D)
Number
Average Value
Number
Average Value
Number
Average Value
Number
Average Value
Number
Average Value
Number
Average Value
LOANS ORIGINATED
3
$201,517
10
$236,317
28
$173,244
8
$46,776
2
$229,050
1
$23,580
APPLICATIONS APPROVED, NOT ACCEPTED
0
$0
1
$103,620
3
$176,120
1
$51,010
0
$0
0
$0
APPLICATIONS DENIED
0
$0
1
$325,930
12
$230,602
1
$92,550
0
$0
0
$0
APPLICATIONS WITHDRAWN
0
$0
1
$240,600
4
$235,588
0
$0
0
$0
0
$0
FILES CLOSED FOR INCOMPLETENESS
0
$0
0
$0
1
$237,390
0
$0
0
$0
0
$0
Aggregated Statistics For Year 2007 (Based on 2 partial tracts)
A) FHA, FSA/RHS & VA Home Purchase Loans
B) Conventional Home Purchase Loans
C) Refinancings
D) Home Improvement Loans
F) Non-occupant Loans on < 5 Family Dwellings (A B C & D)
G) Loans On Manufactured Home Dwelling (A B C & D)
Number
Average Value
Number
Average Value
Number
Average Value
Number
Average Value
Number
Average Value
Number
Average Value
LOANS ORIGINATED
1
$320,320
17
$205,661
34
$161,136
12
$60,685
3
$161,577
1
$45,870
APPLICATIONS APPROVED, NOT ACCEPTED
0
$0
1
$150,940
7
$179,740
1
$29,670
0
$0
0
$0
APPLICATIONS DENIED
0
$0
4
$141,152
15
$208,263
4
$96,882
0
$0
1
$115,490
APPLICATIONS WITHDRAWN
0
$0
1
$164,090
8
$222,335
1
$157,190
0
$0
0
$0
FILES CLOSED FOR INCOMPLETENESS
0
$0
1
$85,650
2
$260,730
0
$0
0
$0
0
$0
Aggregated Statistics For Year 2006 (Based on 2 partial tracts)
A) FHA, FSA/RHS & VA Home Purchase Loans
B) Conventional Home Purchase Loans
C) Refinancings
D) Home Improvement Loans
F) Non-occupant Loans on < 5 Family Dwellings (A B C & D)
G) Loans On Manufactured Home Dwelling (A B C & D)
Number
Average Value
Number
Average Value
Number
Average Value
Number
Average Value
Number
Average Value
Number
Average Value
LOANS ORIGINATED
1
$138,100
21
$202,875
40
$151,458
16
$49,664
2
$188,390
1
$30,160
APPLICATIONS APPROVED, NOT ACCEPTED
0
$0
3
$144,253
5
$164,666
2
$52,450
0
$0
0
$0
APPLICATIONS DENIED
0
$0
2
$237,230
15
$195,913
2
$42,585
1
$205,470
0
$0
APPLICATIONS WITHDRAWN
0
$0
2
$191,920
9
$174,390
1
$54,220
1
$70,260
0
$0
FILES CLOSED FOR INCOMPLETENESS
0
$0
0
$0
2
$182,055
0
$0
0
$0
0
$0
Aggregated Statistics For Year 2005 (Based on 2 partial tracts)
A) FHA, FSA/RHS & VA Home Purchase Loans
B) Conventional Home Purchase Loans
C) Refinancings
D) Home Improvement Loans
F) Non-occupant Loans on < 5 Family Dwellings (A B C & D)
G) Loans On Manufactured Home Dwelling (A B C & D)
Number
Average Value
Number
Average Value
Number
Average Value
Number
Average Value
Number
Average Value
Number
Average Value
LOANS ORIGINATED
2
$180,610
25
$185,608
45
$150,872
15
$50,997
2
$104,740
1
$46,200
APPLICATIONS APPROVED, NOT ACCEPTED
0
$0
3
$112,760
7
$139,021
1
$85,650
0
$0
1
$15,560
APPLICATIONS DENIED
0
$0
3
$133,187
14
$168,042
5
$43,468
0
$0
1
$39,140
APPLICATIONS WITHDRAWN
0
$0
0
$0
9
$195,386
2
$116,930
0
$0
0
$0
FILES CLOSED FOR INCOMPLETENESS
0
$0
0
$0
7
$193,053
1
$21,810
0
$0
0
$0
Aggregated Statistics For Year 2004 (Based on 2 partial tracts)
A) FHA, FSA/RHS & VA Home Purchase Loans
B) Conventional Home Purchase Loans
C) Refinancings
D) Home Improvement Loans
F) Non-occupant Loans on < 5 Family Dwellings (A B C & D)
G) Loans On Manufactured Home Dwelling (A B C & D)
Number
Average Value
Number
Average Value
Number
Average Value
Number
Average Value
Number
Average Value
Number
Average Value
LOANS ORIGINATED
2
$124,630
20
$161,900
45
$136,030
14
$51,844
2
$109,475
0
$0
APPLICATIONS APPROVED, NOT ACCEPTED
0
$0
3
$147,943
6
$115,033
1
$38,340
0
$0
1
$25,660
APPLICATIONS DENIED
0
$0
2
$180,210
12
$138,893
4
$38,575
0
$0
1
$51,170
APPLICATIONS WITHDRAWN
0
$0
1
$191,680
15
$167,821
1
$23,420
0
$0
0
$0
FILES CLOSED FOR INCOMPLETENESS
0
$0
0
$0
2
$205,955
0
$0
0
$0
0
$0
Aggregated Statistics For Year 2003 (Based on 2 partial tracts)
A) FHA, FSA/RHS & VA Home Purchase Loans
B) Conventional Home Purchase Loans
C) Refinancings
D) Home Improvement Loans
F) Non-occupant Loans on < 5 Family Dwellings (A B C & D)
Number
Average Value
Number
Average Value
Number
Average Value
Number
Average Value
Number
Average Value
LOANS ORIGINATED
1
$122,870
18
$155,071
114
$130,169
6
$31,252
2
$57,100
APPLICATIONS APPROVED, NOT ACCEPTED
0
$0
2
$87,095
16
$115,999
1
$19,410
0
$0
APPLICATIONS DENIED
0
$0
2
$59,025
13
$132,737
4
$23,018
0
$0
APPLICATIONS WITHDRAWN
0
$0
1
$194,570
13
$139,832
0
$0
0
$0
FILES CLOSED FOR INCOMPLETENESS
0
$0
0
$0
1
$169,860
1
$70,260
0
$0
Aggregated Statistics For Year 2002 (Based on 2 partial tracts)
A) FHA, FSA/RHS & VA Home Purchase Loans
B) Conventional Home Purchase Loans
C) Refinancings
D) Home Improvement Loans
F) Non-occupant Loans on < 5 Family Dwellings (A B C & D)
Number
Average Value
Number
Average Value
Number
Average Value
Number
Average Value
Number
Average Value
LOANS ORIGINATED
2
$135,380
22
$149,186
70
$125,442
6
$34,887
2
$88,700
APPLICATIONS APPROVED, NOT ACCEPTED
0
$0
2
$108,510
7
$111,661
2
$34,165
0
$0
APPLICATIONS DENIED
0
$0
1
$126,720
13
$128,826
1
$40,580
0
$0
APPLICATIONS WITHDRAWN
0
$0
0
$0
9
$127,892
0
$0
0
$0
FILES CLOSED FOR INCOMPLETENESS
0
$0
0
$0
1
$235,950
0
$0
0
$0
Aggregated Statistics For Year 2001 (Based on 2 partial tracts)
A) FHA, FSA/RHS & VA Home Purchase Loans
B) Conventional Home Purchase Loans
C) Refinancings
D) Home Improvement Loans
F) Non-occupant Loans on < 5 Family Dwellings (A B C & D)
Number
Average Value
Number
Average Value
Number
Average Value
Number
Average Value
Number
Average Value
LOANS ORIGINATED
2
$142,275
19
$148,117
43
$110,907
7
$23,419
2
$71,460
APPLICATIONS APPROVED, NOT ACCEPTED
0
$0
2
$81,805
8
$102,435
1
$43,470
0
$0
APPLICATIONS DENIED
0
$0
4
$69,292
12
$90,612
3
$18,873
1
$107,470
APPLICATIONS WITHDRAWN
0
$0
1
$125,590
5
$119,562
1
$51,970
0
$0
FILES CLOSED FOR INCOMPLETENESS
0
$0
0
$0
2
$133,695
0
$0
0
$0
Aggregated Statistics For Year 2000 (Based on 2 partial tracts)
B) Conventional Home Purchase Loans
C) Refinancings
D) Home Improvement Loans
F) Non-occupant Loans on < 5 Family Dwellings (A B C & D)
Number
Average Value
Number
Average Value
Number
Average Value
Number
Average Value
LOANS ORIGINATED
25
$135,891
15
$67,058
6
$25,183
1
$132,170
APPLICATIONS APPROVED, NOT ACCEPTED
2
$112,920
4
$70,938
2
$30,395
0
$0
APPLICATIONS DENIED
4
$72,660
7
$80,086
1
$37,370
0
$0
APPLICATIONS WITHDRAWN
1
$209,160
4
$85,652
1
$82,290
0
$0
FILES CLOSED FOR INCOMPLETENESS
0
$0
2
$116,370
0
$0
0
$0
Aggregated Statistics For Year 1999 (Based on 1 partial tract)

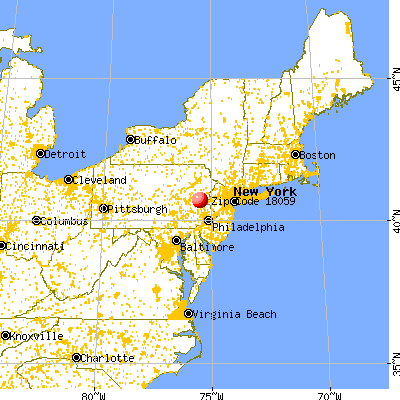


 Nearest zip codes: 18086, 18035, 18037, 18088, 18067, 18052.