Estimated zip code population in 2022: 6,927 Zip code population in 2010: 6,571 Zip code population in 2000: 6,506
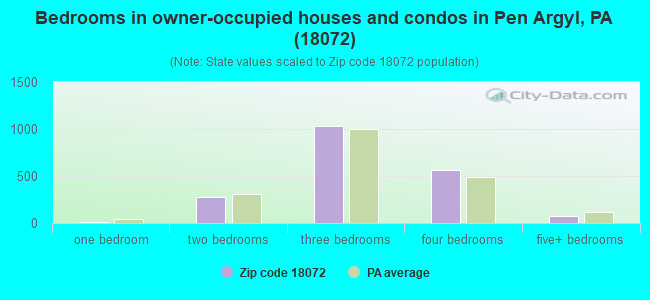
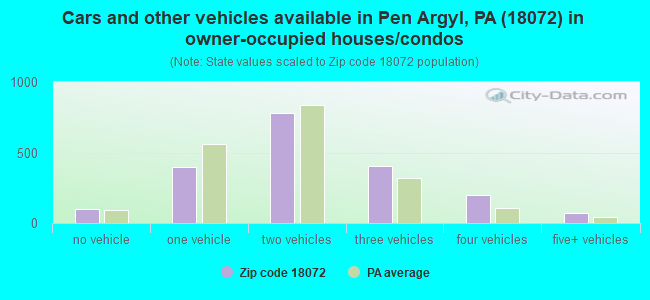
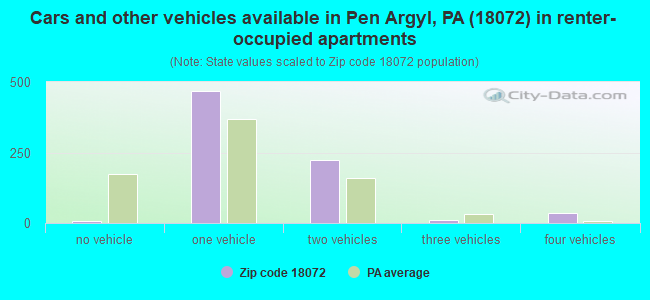
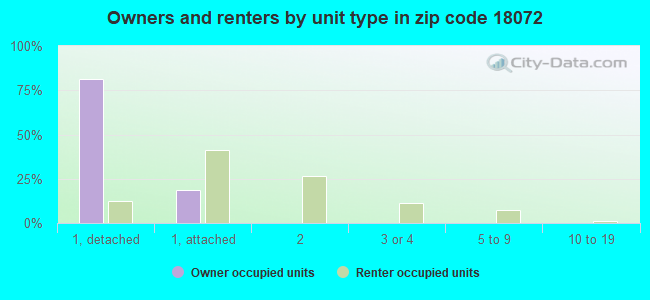
Houses and condos: 2,780 Renter-occupied apartments: 740
% of renters here:
27%
State:
31%
March 2022 cost of living index in zip code 18072: 99.7 (near average, U.S. average is 100)
Land area: 15.1 sq. mi. Water area: 0.2 sq. mi.
Population density: 460 people per square mile
(low).
OSM Map
General Map
Google Map
MSN Map
OSM Map
General Map
Google Map
MSN Map
OSM Map
General Map
Google Map
MSN Map
OSM Map
General Map
Google Map
MSN Map
Please wait while loading the map...
Real estate property taxes paid for housing units in 2022:
This zip code:
1.6% ($4,098)
Pennsylvania:
1.3% ($3,094)
Median real estate property taxes paid for housing units with mortgages in 2022: $3,777 (1.5%) Median real estate property taxes paid for housing units with no mortgage in 2022: $4,604 (1.6%)
Business Search- 14 Million verified businesses
Males: 3,410
(49.2%)
Females: 3,517
(50.8%)
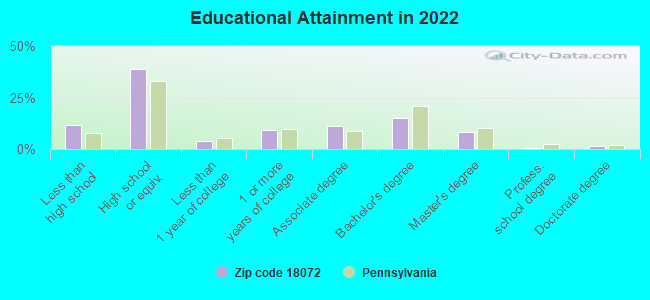
For population 25 years and over in 18072:
High school or higher: 87.6%
Bachelor's degree or higher: 24.8%
Graduate or professional degree: 10.0%
Unemployed: 6.5%
Mean travel time to work (commute): 23.8 minutes
For population 15 years and over in 18072:
Never married: 31.1%
Now married: 54.6%
Separated: 2.4%
Widowed: 3.4%
Divorced: 8.4%
Zip code 18072 compared to state average:
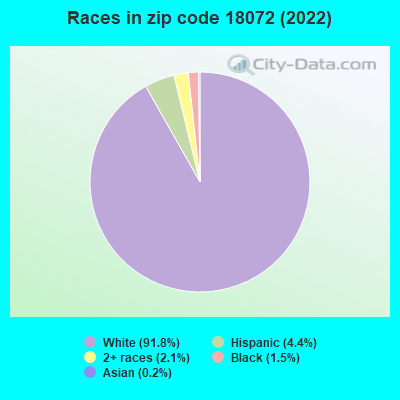
Black race population percentage significantly below state average.
Hispanic race population percentage below state average.
Foreign-born population percentage below state average.
Estimated median house/condo value in 2022: $261,346
18072:
$261,346
Pennsylvania:
$245,500
According to our research of Pennsylvania and other state lists, there were 2 registered sex offenders living in 18072 zip code as of May 20, 2024. The ratio of all residents to sex offenders in zip code 18072 is 3,279 to 1. The ratio of registered sex offenders to all residents in this zip code is much lower than the state average.
Median resident age:
This zip code:
44.4 years
Pennsylvania median age:
40.9 years
Average household size:
This zip code:
2.5 people
Pennsylvania:
2.4 people
Averages for the 2020 tax year for zip code 18072, filed in 2021:
Average Adjusted Gross Income (AGI) in 2020: $63,479 (Individual Income Tax Returns)
Here:
$63,479
State:
$75,707
Salary/wage: $55,256 (reported on 82.2% of returns)
Here:
$55,256
State:
$62,806
(% of AGI for various income ranges: 1138.8% for AGIs below $25k, 3449.2% for AGIs $25k-50k, 6230.0% for AGIs $50k-75k, 9340.8% for AGIs $75k-100k, 17381.9% for AGIs $100k-200k, 67850.0% for AGIs over 200k)
Taxable interest for individuals: $782 (reported on 30.3% of returns)
This zip code:
$782
Pennsylvania:
$1,633
(% of AGI for various income ranges: 16.3% for AGIs below $25k, 15.6% for AGIs $25k-50k, 46.3% for AGIs $50k-75k, 34.4% for AGIs $75k-100k, 67.5% for AGIs $100k-200k, 343.3% for AGIs over 200k)
Ordinary dividends: $3,358 (reported on 21.3% of returns)
Here:
$3,358
State:
$7,382
(% of AGI for various income ranges: 37.0% for AGIs below $25k, 23.4% for AGIs $25k-50k, 64.7% for AGIs $50k-75k, 94.8% for AGIs $75k-100k, 247.8% for AGIs $100k-200k, 2483.3% for AGIs over 200k)
Net capital gain/loss in AGI: +$11,051 (reported on 16.0% of returns)
Here:
+$11,051
State:
+$23,522
(% of AGI for various income ranges: 15.2% for AGIs below $25k, 17.3% for AGIs $25k-50k, 70.0% for AGIs $50k-75k, 110.0% for AGIs $75k-100k, 343.1% for AGIs $100k-200k, 13970.0% for AGIs over 200k)
Profit/loss from business: +$16,562 (reported on 11.4% of returns)
Here:
+$16,562
State:
+$16,274
(% of AGI for various income ranges: 81.2% for AGIs below $25k, 132.7% for AGIs $25k-50k, 91.9% for AGIs $50k-75k, 156.0% for AGIs $75k-100k, 589.7% for AGIs $100k-200k, 7980.0% for AGIs over 200k)
Taxable individual retirement arrangement distribution: $12,472 (reported on 10.5% of returns)
18072:
$12,472
Pennsylvania:
$18,583
(% of AGI for various income ranges: 101.9% for AGIs below $25k, 100.0% for AGIs $25k-50k, 184.4% for AGIs $50k-75k, 261.2% for AGIs $75k-100k, 537.8% for AGIs $100k-200k)
Total itemized deductions: $27,022 (reported on 5.2% of returns)
Here:
$27,022
State:
$34,850
(% of AGI for various income ranges: 158.8% for AGIs $25k-50k, 144.9% for AGIs $50k-75k, 308.4% for AGIs $75k-100k, 340.0% for AGIs $100k-200k, 4553.3% for AGIs over 200k)
Charity contributions: $4,058 (reported on 3.5% of returns)
Here:
$4,058
State:
$12,392
(% of AGI for various income ranges: 7.5% for AGIs $25k-50k, 18.8% for AGIs $75k-100k, 47.8% for AGIs $100k-200k, 796.7% for AGIs over 200k)
Taxes paid: $8,267 (reported on 5.2% of returns)
18072:
$8,267
State:
$8,200
(% of AGI for various income ranges: 35.3% for AGIs $25k-50k, 66.3% for AGIs $50k-75k, 119.6% for AGIs $75k-100k, 121.2% for AGIs $100k-200k, 966.7% for AGIs over 200k)
Earned income credit: $2,000 (reported on 10.8% of returns)
Here:
$2,000
State:
$2,100
(% of AGI for various income ranges: 57.9% for AGIs below $25k, 55.0% for AGIs $25k-50k)
Percentage of individuals using paid preparers for their 2020 taxes: 92.7%
Here:
93%
State:
92%
(% for various income ranges: 90.6% for AGIs below $25k, 95.1% for AGIs $25k-50k, 93.0% for AGIs $50k-75k, 97.1% for AGIs $75k-100k, 90.6% for AGIs $100k-200k, 90.9% for AGIs over 200k)
Averages for the 2012 tax year for zip code 18072, filed in 2013:
Average Adjusted Gross Income (AGI) in 2012: $49,707 (Individual Income Tax Returns)
Here:
$49,707
State:
$61,346
Salary/wage: $45,509 (reported on 82.4% of returns)
Here:
$45,509
State:
$51,902
(% of AGI for various income ranges: 67.1% for AGIs below $25k, 80.4% for AGIs $25k-50k, 77.8% for AGIs $50k-75k, 77.0% for AGIs $75k-100k, 78.9% for AGIs $100k-200k, 56.7% for AGIs over 200k)
Taxable interest for individuals: $1,095 (reported on 34.9% of returns)
This zip code:
$1,095
Pennsylvania:
$1,588
(% of AGI for various income ranges: 1.7% for AGIs below $25k, 0.6% for AGIs $25k-50k, 0.7% for AGIs $50k-75k, 1.1% for AGIs $75k-100k, 0.5% for AGIs $100k-200k, 0.7% for AGIs over 200k)
Ordinary dividends: $3,019 (reported on 23.3% of returns)
Here:
$3,019
State:
$5,827
(% of AGI for various income ranges: 2.2% for AGIs below $25k, 0.7% for AGIs $25k-50k, 1.0% for AGIs $50k-75k, 0.9% for AGIs $75k-100k, 1.2% for AGIs $100k-200k, 4.4% for AGIs over 200k)
Net capital gain/loss in AGI: +$6,369 (reported on 13.4% of returns)
Here:
+$6,369
State:
+$14,495
(% of AGI for various income ranges: 0.2% for AGIs below $25k, 0.3% for AGIs $25k-50k, 0.6% for AGIs $50k-75k, 0.1% for AGIs $75k-100k, 1.2% for AGIs $100k-200k, 12.5% for AGIs over 200k)
Profit/loss from business: +$13,579 (reported on 11.3% of returns)
Here:
+$13,579
State:
+$16,268
(% of AGI for various income ranges: 6.2% for AGIs below $25k, 2.4% for AGIs $25k-50k, 2.7% for AGIs $50k-75k, 3.2% for AGIs $75k-100k, 3.8% for AGIs $100k-200k)
Taxable individual retirement arrangement distribution: $10,677 (reported on 11.6% of returns)
18072:
$10,677
Pennsylvania:
$14,550
(% of AGI for various income ranges: 3.9% for AGIs below $25k, 2.4% for AGIs $25k-50k, 2.4% for AGIs $50k-75k, 2.1% for AGIs $75k-100k, 3.3% for AGIs $100k-200k)
Total itemized deductions: $20,408 (22% of AGI, reported on 30.7% of returns)
Here:
$20,408
State:
$23,538
Here:
21.8% of AGI
State:
18.4% of AGI
(% of AGI for various income ranges: 7.7% for AGIs below $25k, 7.7% for AGIs $25k-50k, 11.5% for AGIs $50k-75k, 14.5% for AGIs $75k-100k, 15.3% for AGIs $100k-200k, 16.4% for AGIs over 200k)
Charity contributions: $2,323 (reported on 24.2% of returns)
Here:
$2,323
State:
$4,025
(% of AGI for various income ranges: 0.5% for AGIs below $25k, 0.5% for AGIs $25k-50k, 0.9% for AGIs $50k-75k, 1.1% for AGIs $75k-100k, 1.5% for AGIs $100k-200k, 2.1% for AGIs over 200k)
Taxes paid: $8,292 (reported on 30.7% of returns)
18072:
$8,292
State:
$9,982
(% of AGI for various income ranges: 2.1% for AGIs below $25k, 2.5% for AGIs $25k-50k, 4.4% for AGIs $50k-75k, 5.9% for AGIs $75k-100k, 7.1% for AGIs $100k-200k, 6.7% for AGIs over 200k)
Earned income credit: $1,971 (reported on 13.4% of returns)
Here:
$1,971
State:
$2,106
(% of AGI for various income ranges: 4.3% for AGIs below $25k, 1.0% for AGIs $25k-50k)
Percentage of individuals using paid preparers for their 2012 taxes: 52.8%
Here:
53%
State:
53%
(% for various income ranges: 47.3% for AGIs below $25k, 52.6% for AGIs $25k-50k, 54.0% for AGIs $50k-75k, 60.0% for AGIs $75k-100k, 61.1% for AGIs $100k-200k, 80.0% for AGIs over 200k)
Averages for the 2004 tax year for zip code 18072, filed in 2005:
Average Adjusted Gross Income (AGI) in 2004: $43,556 (Individual Income Tax Returns)
Here:
$43,556
State:
$48,049
Salary/wage: $39,309 (reported on 84.3% of returns)
Here:
$39,309
State:
$42,646
(% of AGI for various income ranges: 76.6% for AGIs below $10k, 73.4% for AGIs $10k-25k, 82.8% for AGIs $25k-50k, 88.3% for AGIs $50k-75k, 86.3% for AGIs $75k-100k, 54.6% for AGIs over 100k)
Taxable interest for individuals: $1,366 (reported on 48.8% of returns)
This zip code:
$1,366
Pennsylvania:
$1,657
(% of AGI for various income ranges: 6.5% for AGIs below $10k, 2.9% for AGIs $10k-25k, 1.9% for AGIs $25k-50k, 1.0% for AGIs $50k-75k, 0.9% for AGIs $75k-100k, 1.4% for AGIs over 100k)
Taxable dividends: $2,354 (reported on 27.7% of returns)
Here:
$2,354
State:
$3,566
(% of AGI for various income ranges: 5.9% for AGIs below $10k, 2.4% for AGIs $10k-25k, 1.2% for AGIs $25k-50k, 1.1% for AGIs $50k-75k, 0.9% for AGIs $75k-100k, 1.9% for AGIs over 100k)
Net capital gain/loss: +$9,650 (reported on 17.8% of returns)
Here:
+$9,650
State:
+$9,716
(% of AGI for various income ranges: -0.8% for AGIs below $10k, -0.6% for AGIs $10k-25k, 0.1% for AGIs $25k-50k, 0.5% for AGIs $50k-75k, -0.1% for AGIs $75k-100k, 14.3% for AGIs over 100k)
Profit/loss from business: +$13,328 (reported on 13.2% of returns)
Here:
+$13,328
State:
+$14,267
(% of AGI for various income ranges: 4.0% for AGIs below $10k, 5.6% for AGIs $10k-25k, 3.6% for AGIs $25k-50k, 1.8% for AGIs $50k-75k, 3.1% for AGIs $75k-100k, 6.4% for AGIs over 100k)
IRA payment deduction: $3,104 (reported on 3.3% of returns)
18072:
$3,104
Pennsylvania:
$2,903
(% of AGI for various income ranges: 0.3% for AGIs $10k-25k, 0.4% for AGIs $25k-50k, 0.3% for AGIs $50k-75k, 0.2% for AGIs over 100k)
Self-employed pension: $7,846 (reported on 0.4% of returns)
Here:
$7,846
Pennsylvania:
$14,674
Total itemized deductions: $16,479 (21% of AGI, reported on 32.9% of returns)
Here:
$16,479
State:
$18,804
Here:
20.9% of AGI
State:
19.5% of AGI
(% of AGI for various income ranges: 6.6% for AGIs below $10k, 9.8% for AGIs $10k-25k, 9.9% for AGIs $25k-50k, 13.7% for AGIs $50k-75k, 14.8% for AGIs $75k-100k, 13.1% for AGIs over 100k)
Charity contributions deductions: $2,109 (3% of AGI, reported on 29.8% of returns)
Here:
$2,109
State:
$3,337
Here:
2.6% of AGI
State:
3.3% of AGI
(% of AGI for various income ranges: 0.7% for AGIs below $10k, 0.8% for AGIs $10k-25k, 0.9% for AGIs $25k-50k, 1.6% for AGIs $50k-75k, 1.6% for AGIs $75k-100k, 1.9% for AGIs over 100k)
Total tax: $5,804 (reported on 77.1% of returns)
18072:
$5,804
State:
$8,008
(% of AGI for various income ranges: 2.6% for AGIs below $10k, 4.4% for AGIs $10k-25k, 6.8% for AGIs $25k-50k, 8.1% for AGIs $50k-75k, 10.0% for AGIs $75k-100k, 17.4% for AGIs over 100k)
Earned income credit: $1,423 (reported on 9.8% of returns)
Here:
$1,423
State:
$1,643
Percentage of individuals using paid preparers for their 2004 taxes: 58.7%
Here:
59%
State:
56%
(% for various income ranges: 55.5% for AGIs below $10k, 57.9% for AGIs $10k-25k, 61.1% for AGIs $25k-50k, 57.8% for AGIs $50k-75k, 56.9% for AGIs $75k-100k, 66.7% for AGIs over 100k)
Household received Food Stamps/SNAP in the past 12 months: 294 Household did not receive Food Stamps/SNAP in the past 12 months: 2,409
Women who had a birth in the past 12 months: 115 (57 now married, 52 unmarried) Women who did not have a birth in the past 12 months: 1,520 (528 now married, 994 unmarried)
Housing units in zip code 18072 with a mortgage: 1,267 (115 second mortgage, 90 both second mortgage and home equity loan) Houses without a mortgage: 58
Median monthly owner costs for units with a mortgage: $1,641 Median monthly owner costs for units without a mortgage: $747
Residents with income below the poverty level in 2022:
This zip code:
9.1%
Whole state:
11.8%
Residents with income below 50% of the poverty level in 2022:
This zip code:
4.1%
Whole state:
6.1%
Median number of rooms in houses and condos:
Here:
6.8
State:
6.8
Median number of rooms in apartments:
Here:
4.4
State:
4.3
Notable locations in this zip code not listed on our city pages
In group quarters: 37 (-1 institutionalized population)
Size of family households: 975 2-persons, 403 3-persons, 460 4-persons, 104 5-persons, 21 6-persons, 6 7-or-more-persons
Size of nonfamily households: 584 1-person, 122 2-persons, 18 3-persons
522 married couples with children.
423 single-parent households (158 men, 265 women).
90.9% of residents of 18072 zip code speak English at home.
2.1% of residents speak Spanish at home (100% very well).
4.6% of residents speak other Indo-European language at home (69% very well, 5% well, 12% not well, 13% not at all).
2.0% of residents speak Asian or Pacific Island language at home (52% very well, 32% well, 16% not well).
Foreign born population: 242 (3.5%) (91.6% of them are naturalized citizens)
This zip code:
3.5%
Whole state:
7.5%
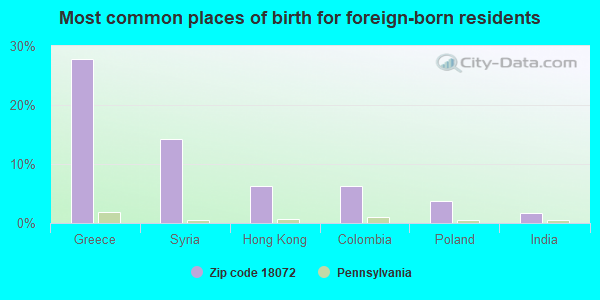
28%Greece
14%Syria
6%Hong Kong
6%Colombia
4%Poland
2%India
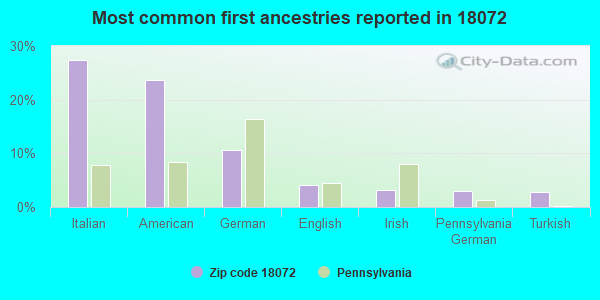
27%Italian
24%American
11%German
4%English
3%Irish
3%Pennsylvania German
3%Turkish
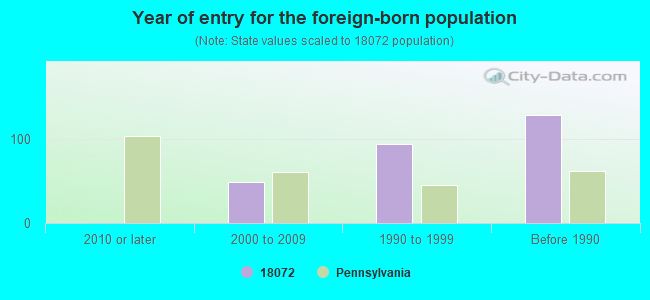
Year of entry for the foreign-born population
02010 or later
492000 to 2009
941990 to 1999
129Before 1990
Facilities with environmental interests located in this zip code:
BANGOR BODY WORKS (121 CESARE DR in PEN ARGYL, PA)
STATE MASTER (Pennsylvania database) - RCRIS-PAR000512392, HAZARDOUS WASTE PROGRAM Conditionally Exempt Small Quantity Generators, less than 100 kg/month of hazardous waste (Resource Conservation and Recovery Act (tracking hazardous waste)) Business NAICS classification: AUTOMOTIVE BODY, PAINT, AND INTERIOR REPAIR AND MAINTENANCE. Organizations: KYLE WILLIAMS (CONTACT/OPERATOR)
, BANGOR BODY WORKS, INC. (OWNER/OPERATOR)
ATHLETIC SCREEN PRINTING (636 PEN ARGYL ST in PEN ARGYL, PA)
Small Quantity Generators, between 100 kg and 1000 kg of hazardous waste/month (Resource Conservation and Recovery Act (tracking hazardous waste)) - notification Organizations: OPERNAME (CONTACT/OPERATOR)
, COBIANCO, FAUST (CONTACT/OWNER)
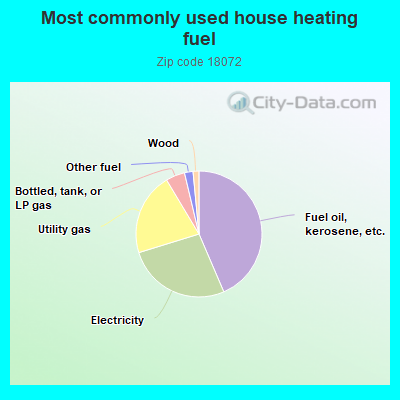
43.6%Fuel oil, kerosene, etc.
26.7%Electricity
21.2%Utility gas
4.9%Bottled, tank, or LP gas
2.2%Other fuel
1.5%Wood
Population in 1990: 9,736.
Place of birth for U.S.-born residents:
This state: 4,868
Northeast: 1,512
Midwest: 40
South: 75
West: 131
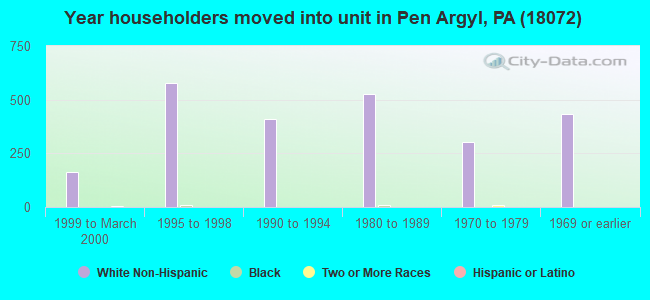
69% of the 18072 zip code residents lived in the same house 5 years ago. Out of people who lived in different houses, 72% lived in this county. Out of people who lived in different counties, 50% lived in Pennsylvania.
91% of the 18072 zip code residents lived in the same house 1 year ago. Out of people who lived in different houses, 43% moved from this county. Out of people who lived in different houses, 55% moved from different county within same state.
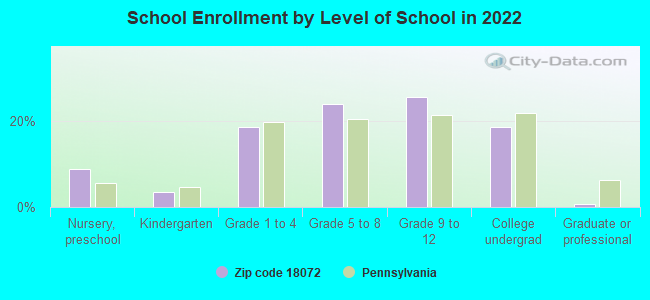
Private vs. public school enrollment:
Students in private schools in grades 1 to 8 (elementary and middle school): 54
Here:
11.4%
Pennsylvania:
15.7%
Students in private schools in grades 9 to 12 (high school): 26
Here:
9.1%
Pennsylvania:
13.4%
Students in private undergraduate colleges:
Here:
0.0%
Pennsylvania:
39.8%
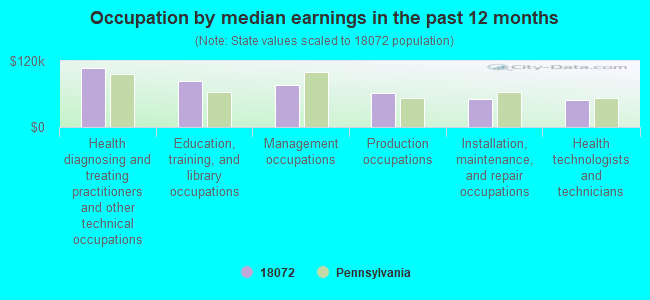
Occupation by median earnings in the past 12 months ($)
106,877Health diagnosing and treating practitioners and other technical occupations
83,428Education, training, and library occupations
75,500Management occupations
61,588Production occupations
51,688Installation, maintenance, and repair occupations
49,223Health technologists and technicians
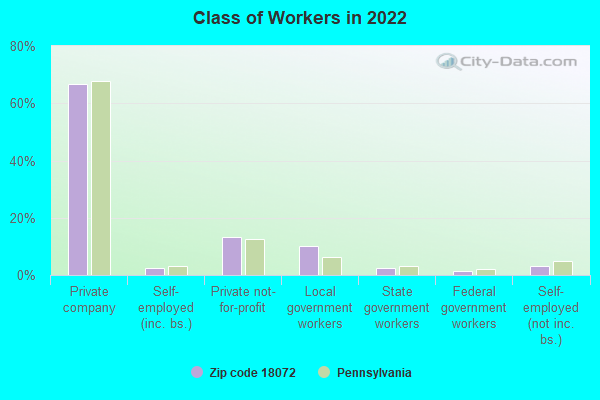
Top industries in this zip code by the number of employees in 2005:
Administrative and Support and Waste Management and Remediation Services: Convention and Trade Show Organizers (100-249 employees: 1 establishment)
Administrative and Support and Waste Management and Remediation Services: Solid Waste Collection (100-249: 1)
Construction: Site Preparation Contractors (50-99: 1, 1-4: 2)
Administrative and Support and Waste Management and Remediation Services: Employment Placement Agencies (50-99: 1)
Health Care and Social Assistance: Home Health Care Services (20-49: 2)
Other Services (except Public Administration): Religious Organizations (20-49: 1, 10-19: 1, 5-9: 1, 1-4: 5)
People in group quarters in 2010:
20 people in nursing facilities/skilled-nursing facilities
7 people in other noninstitutional facilities
People in group quarters in 2000:
90 people in other noninstitutional group quarters
10 people in religious group quarters
Fatal accident statistics in 2014:
Fatal accident count: 1
Vehicles involved in fatal accidents: 1
Fatal accidents caused by drunken drivers: 1
Fatalities: 1
Persons involved in fatal accidents: 1
Pedestrians involved in fatal accidents: 0
Fatal accident statistics in 2012:
Fatal accident count: 1
Vehicles involved in fatal accidents: 2
Fatal accidents caused by drunken drivers: 0
Fatalities: 1
Persons involved in fatal accidents: 2
Pedestrians involved in fatal accidents: 0
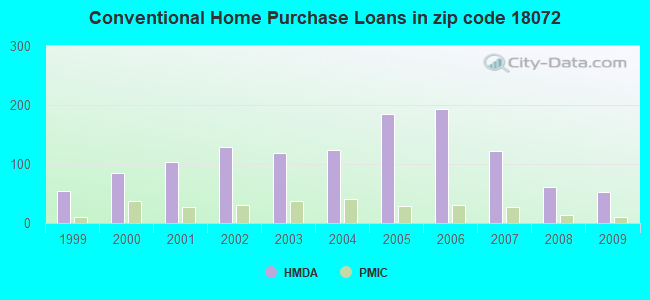
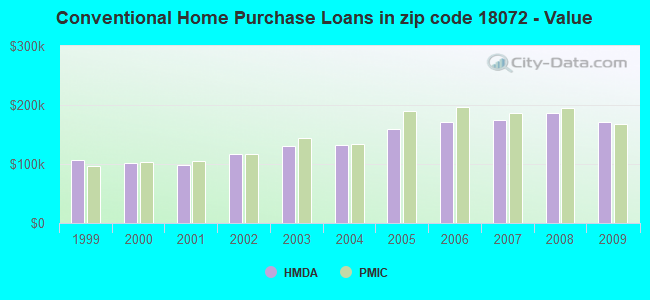
Home Mortgage Disclosure Act Aggregated Statistics For Year 2009 (Based on 1 full and 2 partial tracts)
A) FHA, FSA/RHS & VA Home Purchase Loans
B) Conventional Home Purchase Loans
C) Refinancings
D) Home Improvement Loans
E) Loans on Dwellings For 5+ Families
F) Non-occupant Loans on < 5 Family Dwellings (A B C & D)
G) Loans On Manufactured Home Dwelling (A B C & D)
Number
Average Value
Number
Average Value
Number
Average Value
Number
Average Value
Number
Average Value
Number
Average Value
Number
Average Value
LOANS ORIGINATED
47
$157,156
52
$171,154
215
$164,705
22
$78,652
0
$0
12
$108,062
1
$59,100
APPLICATIONS APPROVED, NOT ACCEPTED
1
$122,000
3
$292,650
15
$171,319
5
$67,484
1
$644,760
0
$0
0
$0
APPLICATIONS DENIED
3
$226,023
7
$188,910
92
$178,813
17
$39,007
0
$0
3
$103,133
0
$0
APPLICATIONS WITHDRAWN
3
$111,500
7
$150,181
41
$174,597
2
$20,560
0
$0
0
$0
0
$0
FILES CLOSED FOR INCOMPLETENESS
0
$0
0
$0
8
$145,174
2
$23,620
0
$0
1
$112,830
0
$0
Aggregated Statistics For Year 2008 (Based on 1 full and 2 partial tracts)
A) FHA, FSA/RHS & VA Home Purchase Loans
B) Conventional Home Purchase Loans
C) Refinancings
D) Home Improvement Loans
E) Loans on Dwellings For 5+ Families
F) Non-occupant Loans on < 5 Family Dwellings (A B C & D)
G) Loans On Manufactured Home Dwelling (A B C & D)
Number
Average Value
Number
Average Value
Number
Average Value
Number
Average Value
Number
Average Value
Number
Average Value
Number
Average Value
LOANS ORIGINATED
31
$167,640
61
$187,071
184
$150,879
41
$47,780
1
$252,000
15
$103,349
2
$88,655
APPLICATIONS APPROVED, NOT ACCEPTED
2
$148,510
6
$159,175
34
$144,635
3
$41,053
0
$0
1
$189,130
0
$0
APPLICATIONS DENIED
2
$172,475
14
$236,971
141
$154,309
36
$36,364
0
$0
7
$77,857
1
$101,010
APPLICATIONS WITHDRAWN
0
$0
9
$195,318
35
$190,150
6
$65,790
0
$0
1
$96,710
0
$0
FILES CLOSED FOR INCOMPLETENESS
2
$196,290
0
$0
12
$197,461
2
$40,240
0
$0
2
$105,740
0
$0
Aggregated Statistics For Year 2007 (Based on 1 full and 2 partial tracts)
A) FHA, FSA/RHS & VA Home Purchase Loans
B) Conventional Home Purchase Loans
C) Refinancings
D) Home Improvement Loans
E) Loans on Dwellings For 5+ Families
F) Non-occupant Loans on < 5 Family Dwellings (A B C & D)
G) Loans On Manufactured Home Dwelling (A B C & D)
Number
Average Value
Number
Average Value
Number
Average Value
Number
Average Value
Number
Average Value
Number
Average Value
Number
Average Value
LOANS ORIGINATED
11
$155,108
122
$174,975
222
$128,741
89
$61,643
0
$0
15
$142,145
6
$75,073
APPLICATIONS APPROVED, NOT ACCEPTED
1
$65,550
17
$144,177
30
$110,347
11
$61,776
0
$0
5
$101,634
0
$0
APPLICATIONS DENIED
2
$208,470
16
$148,797
161
$150,855
30
$76,380
0
$0
7
$127,133
9
$78,913
APPLICATIONS WITHDRAWN
2
$170,860
21
$172,298
59
$147,725
13
$85,551
1
$590,000
5
$150,874
2
$88,655
FILES CLOSED FOR INCOMPLETENESS
0
$0
7
$164,014
13
$139,628
0
$0
0
$0
0
$0
0
$0
Aggregated Statistics For Year 2006 (Based on 1 full and 2 partial tracts)
A) FHA, FSA/RHS & VA Home Purchase Loans
B) Conventional Home Purchase Loans
C) Refinancings
D) Home Improvement Loans
E) Loans on Dwellings For 5+ Families
F) Non-occupant Loans on < 5 Family Dwellings (A B C & D)
G) Loans On Manufactured Home Dwelling (A B C & D)
Number
Average Value
Number
Average Value
Number
Average Value
Number
Average Value
Number
Average Value
Number
Average Value
Number
Average Value
LOANS ORIGINATED
9
$149,966
193
$170,804
244
$116,165
112
$49,053
0
$0
34
$94,563
2
$11,285
APPLICATIONS APPROVED, NOT ACCEPTED
2
$200,505
29
$207,695
46
$119,258
21
$45,587
0
$0
11
$90,200
0
$0
APPLICATIONS DENIED
2
$281,560
34
$134,475
116
$135,352
43
$48,349
0
$0
11
$122,366
4
$73,358
APPLICATIONS WITHDRAWN
2
$255,220
15
$179,914
111
$141,030
16
$66,936
1
$39,760
2
$148,850
0
$0
FILES CLOSED FOR INCOMPLETENESS
0
$0
8
$130,586
23
$139,317
4
$70,052
0
$0
2
$122,505
0
$0
Aggregated Statistics For Year 2005 (Based on 1 full and 2 partial tracts)
A) FHA, FSA/RHS & VA Home Purchase Loans
B) Conventional Home Purchase Loans
C) Refinancings
D) Home Improvement Loans
F) Non-occupant Loans on < 5 Family Dwellings (A B C & D)
G) Loans On Manufactured Home Dwelling (A B C & D)
Number
Average Value
Number
Average Value
Number
Average Value
Number
Average Value
Number
Average Value
Number
Average Value
LOANS ORIGINATED
6
$167,077
185
$158,659
344
$115,691
113
$58,724
34
$103,214
5
$82,650
APPLICATIONS APPROVED, NOT ACCEPTED
1
$123,580
17
$148,141
55
$111,859
7
$21,623
6
$87,833
0
$0
APPLICATIONS DENIED
0
$0
25
$156,083
167
$118,411
34
$63,201
6
$126,600
5
$58,230
APPLICATIONS WITHDRAWN
0
$0
26
$171,746
148
$131,375
11
$159,748
4
$124,942
0
$0
FILES CLOSED FOR INCOMPLETENESS
0
$0
7
$171,583
13
$151,815
1
$212,770
0
$0
0
$0
Aggregated Statistics For Year 2004 (Based on 1 full and 2 partial tracts)
A) FHA, FSA/RHS & VA Home Purchase Loans
B) Conventional Home Purchase Loans
C) Refinancings
D) Home Improvement Loans
E) Loans on Dwellings For 5+ Families
F) Non-occupant Loans on < 5 Family Dwellings (A B C & D)
G) Loans On Manufactured Home Dwelling (A B C & D)
Number
Average Value
Number
Average Value
Number
Average Value
Number
Average Value
Number
Average Value
Number
Average Value
Number
Average Value
LOANS ORIGINATED
9
$123,344
123
$132,045
295
$105,122
73
$56,818
8
$103,430
32
$98,087
0
$0
APPLICATIONS APPROVED, NOT ACCEPTED
0
$0
12
$131,391
65
$115,489
12
$83,071
0
$0
7
$105,379
1
$91,340
APPLICATIONS DENIED
0
$0
29
$115,380
180
$111,403
34
$51,684
0
$0
15
$96,285
3
$68,773
APPLICATIONS WITHDRAWN
0
$0
14
$117,449
138
$121,451
15
$52,532
0
$0
6
$75,375
1
$68,770
FILES CLOSED FOR INCOMPLETENESS
0
$0
8
$124,220
29
$129,790
2
$41,700
0
$0
2
$108,000
0
$0
Aggregated Statistics For Year 2003 (Based on 1 full and 2 partial tracts)
A) FHA, FSA/RHS & VA Home Purchase Loans
B) Conventional Home Purchase Loans
C) Refinancings
D) Home Improvement Loans
E) Loans on Dwellings For 5+ Families
F) Non-occupant Loans on < 5 Family Dwellings (A B C & D)
Number
Average Value
Number
Average Value
Number
Average Value
Number
Average Value
Number
Average Value
Number
Average Value
LOANS ORIGINATED
22
$109,797
118
$130,627
549
$104,736
67
$41,450
0
$0
23
$88,492
APPLICATIONS APPROVED, NOT ACCEPTED
2
$182,845
20
$97,956
95
$98,662
10
$40,644
0
$0
5
$91,516
APPLICATIONS DENIED
0
$0
17
$97,268
183
$109,322
25
$32,140
1
$171,000
8
$155,710
APPLICATIONS WITHDRAWN
1
$72,000
10
$131,662
120
$116,492
6
$17,398
0
$0
1
$94,000
FILES CLOSED FOR INCOMPLETENESS
0
$0
2
$196,115
25
$85,847
0
$0
0
$0
2
$64,500
Aggregated Statistics For Year 2002 (Based on 1 full and 2 partial tracts)
A) FHA, FSA/RHS & VA Home Purchase Loans
B) Conventional Home Purchase Loans
C) Refinancings
D) Home Improvement Loans
E) Loans on Dwellings For 5+ Families
F) Non-occupant Loans on < 5 Family Dwellings (A B C & D)
Number
Average Value
Number
Average Value
Number
Average Value
Number
Average Value
Number
Average Value
Number
Average Value
LOANS ORIGINATED
24
$93,700
128
$117,002
326
$89,913
45
$33,013
2
$238,000
24
$87,950
APPLICATIONS APPROVED, NOT ACCEPTED
0
$0
9
$92,973
56
$93,558
9
$49,073
0
$0
3
$123,657
APPLICATIONS DENIED
1
$67,000
21
$97,436
137
$87,144
25
$27,532
0
$0
9
$85,272
APPLICATIONS WITHDRAWN
1
$75,220
8
$137,909
92
$106,081
8
$20,034
0
$0
2
$484,925
FILES CLOSED FOR INCOMPLETENESS
0
$0
4
$157,755
11
$87,389
3
$44,417
0
$0
0
$0
Aggregated Statistics For Year 2001 (Based on 1 full and 2 partial tracts)
A) FHA, FSA/RHS & VA Home Purchase Loans
B) Conventional Home Purchase Loans
C) Refinancings
D) Home Improvement Loans
E) Loans on Dwellings For 5+ Families
F) Non-occupant Loans on < 5 Family Dwellings (A B C & D)
Number
Average Value
Number
Average Value
Number
Average Value
Number
Average Value
Number
Average Value
Number
Average Value
LOANS ORIGINATED
39
$96,206
104
$98,875
246
$84,078
50
$30,643
2
$209,545
24
$54,558
APPLICATIONS APPROVED, NOT ACCEPTED
2
$66,000
13
$80,264
55
$78,600
12
$24,241
0
$0
3
$92,287
APPLICATIONS DENIED
2
$73,150
14
$66,009
142
$74,010
21
$21,746
0
$0
6
$74,480
APPLICATIONS WITHDRAWN
1
$84,000
6
$93,463
77
$108,535
9
$29,492
0
$0
1
$900,000
FILES CLOSED FOR INCOMPLETENESS
0
$0
1
$23,640
11
$63,033
2
$26,865
0
$0
1
$23,640
Aggregated Statistics For Year 2000 (Based on 1 full and 2 partial tracts)
A) FHA, FSA/RHS & VA Home Purchase Loans
B) Conventional Home Purchase Loans
C) Refinancings
D) Home Improvement Loans
F) Non-occupant Loans on < 5 Family Dwellings (A B C & D)
Number
Average Value
Number
Average Value
Number
Average Value
Number
Average Value
Number
Average Value
LOANS ORIGINATED
24
$84,532
84
$101,761
83
$62,173
57
$23,905
11
$55,968
APPLICATIONS APPROVED, NOT ACCEPTED
1
$63,400
8
$78,926
27
$55,604
12
$20,409
1
$90,270
APPLICATIONS DENIED
0
$0
22
$68,395
86
$84,232
30
$25,111
3
$60,753
APPLICATIONS WITHDRAWN
0
$0
13
$72,427
31
$92,792
2
$53,730
1
$107,460
FILES CLOSED FOR INCOMPLETENESS
0
$0
2
$53,730
33
$89,174
0
$0
0
$0
Aggregated Statistics For Year 1999 (Based on 1 full and 1 partial tracts)
A) FHA, FSA/RHS & VA Home Purchase Loans
B) Conventional Home Purchase Loans
C) Refinancings
D) Home Improvement Loans
F) Non-occupant Loans on < 5 Family Dwellings (A B C & D)


 Nearest zip codes: 18091, 18013, 18083, 18354, 18085, 18040.