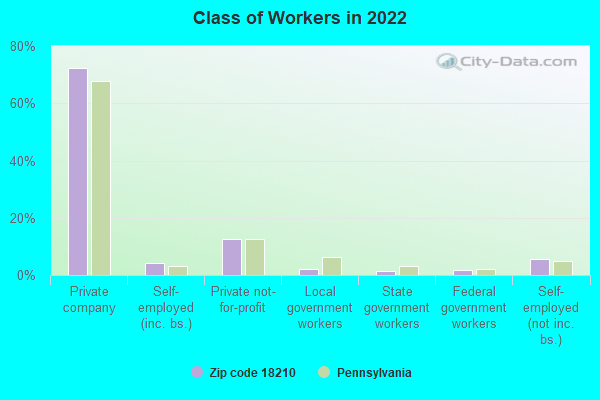
Estimated zip code population in 2022: 7,234 Zip code population in 2010: 8,258 Zip code population in 2000: 4,429
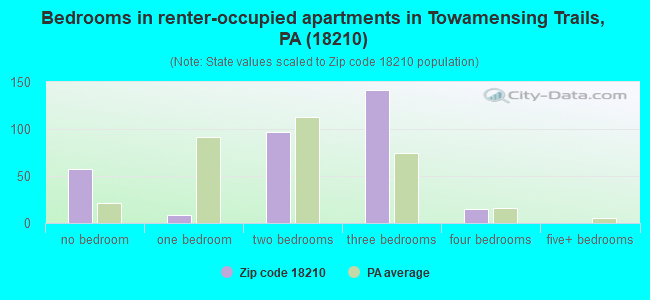
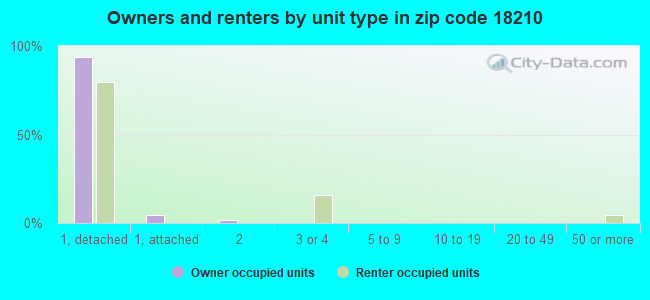
Houses and condos: 5,940 Renter-occupied apartments: 319
% of renters here:
11%
State:
31%
March 2022 cost of living index in zip code 18210: 98.8 (near average, U.S. average is 100)
Land area: 31.3 sq. mi. Water area: 0.4 sq. mi.
Population density: 231 people per square mile
(very low).
OSM Map
General Map
Google Map
MSN Map
OSM Map
General Map
Google Map
MSN Map
OSM Map
General Map
Google Map
MSN Map
OSM Map
General Map
Google Map
MSN Map
Please wait while loading the map...
Real estate property taxes paid for housing units in 2022:
This zip code:
1.5% ($3,216)
Pennsylvania:
1.3% ($3,094)
Median real estate property taxes paid for housing units with mortgages in 2022: $2,869 (1.5%) Median real estate property taxes paid for housing units with no mortgage in 2022: $3,789 (1.6%)
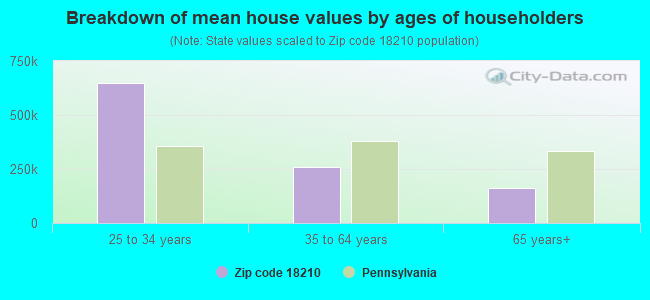
Estimated median house/condo value in 2022: $208,599
18210:
$208,599
Pennsylvania:
$245,500
According to our research of Pennsylvania and other state lists, there were 12 registered sex offenders living in 18210 zip code as of May 20, 2024. The ratio of all residents to sex offenders in zip code 18210 is 684 to 1. The ratio of registered sex offenders to all residents in this zip code is near the state average.
Median resident age:
This zip code:
50.2 years
Pennsylvania median age:
40.9 years
Average household size:
This zip code:
2.4 people
Pennsylvania:
2.4 people
Averages for the 2020 tax year for zip code 18210, filed in 2021:
Average Adjusted Gross Income (AGI) in 2020: $56,124 (Individual Income Tax Returns)
Here:
$56,124
State:
$75,707
Salary/wage: $48,897 (reported on 77.2% of returns)
Here:
$48,897
State:
$62,806
(% of AGI for various income ranges: 1007.0% for AGIs below $25k, 2960.4% for AGIs $25k-50k, 5433.3% for AGIs $50k-75k, 8314.4% for AGIs $75k-100k, 15586.4% for AGIs $100k-200k, 46913.3% for AGIs over 200k)
Taxable interest for individuals: $905 (reported on 22.8% of returns)
This zip code:
$905
Pennsylvania:
$1,633
(% of AGI for various income ranges: 12.8% for AGIs below $25k, 15.1% for AGIs $25k-50k, 25.6% for AGIs $50k-75k, 36.9% for AGIs $75k-100k, 90.0% for AGIs $100k-200k, 176.7% for AGIs over 200k)
Ordinary dividends: $3,248 (reported on 14.1% of returns)
Here:
$3,248
State:
$7,382
(% of AGI for various income ranges: 23.6% for AGIs below $25k, 26.7% for AGIs $25k-50k, 63.0% for AGIs $50k-75k, 73.8% for AGIs $75k-100k, 197.6% for AGIs $100k-200k, 706.7% for AGIs over 200k)
Net capital gain/loss in AGI: +$6,322 (reported on 12.4% of returns)
Here:
+$6,322
State:
+$23,522
(% of AGI for various income ranges: 9.1% for AGIs below $25k, 15.9% for AGIs $25k-50k, 52.4% for AGIs $50k-75k, 131.2% for AGIs $75k-100k, 306.1% for AGIs $100k-200k, 4310.0% for AGIs over 200k)
Profit/loss from business: +$9,692 (reported on 11.9% of returns)
Here:
+$9,692
State:
+$16,274
(% of AGI for various income ranges: 66.6% for AGIs below $25k, 116.9% for AGIs $25k-50k, 122.0% for AGIs $50k-75k, 303.1% for AGIs $75k-100k, 461.8% for AGIs $100k-200k)
Taxable individual retirement arrangement distribution: $17,915 (reported on 9.7% of returns)
18210:
$17,915
Pennsylvania:
$18,583
(% of AGI for various income ranges: 63.4% for AGIs below $25k, 124.9% for AGIs $25k-50k, 182.4% for AGIs $50k-75k, 439.4% for AGIs $75k-100k, 952.1% for AGIs $100k-200k)
Total itemized deductions: $23,954 (reported on 5.8% of returns)
Here:
$23,954
State:
$34,850
(% of AGI for various income ranges: 116.7% for AGIs $25k-50k, 244.3% for AGIs $50k-75k, 274.4% for AGIs $75k-100k, 782.7% for AGIs $100k-200k)
Charity contributions: $5,467 (reported on 4.4% of returns)
Here:
$5,467
State:
$12,392
(% of AGI for various income ranges: 9.2% for AGIs $25k-50k, 33.9% for AGIs $50k-75k, 44.1% for AGIs $75k-100k, 177.0% for AGIs $100k-200k)
Taxes paid: $7,646 (reported on 5.8% of returns)
18210:
$7,646
State:
$8,200
(% of AGI for various income ranges: 29.2% for AGIs $25k-50k, 76.5% for AGIs $50k-75k, 101.2% for AGIs $75k-100k, 259.4% for AGIs $100k-200k)
Earned income credit: $2,120 (reported on 14.3% of returns)
Here:
$2,120
State:
$2,100
(% of AGI for various income ranges: 73.5% for AGIs below $25k, 67.5% for AGIs $25k-50k)
Percentage of individuals using paid preparers for their 2020 taxes: 93.2%
Here:
93%
State:
92%
(% for various income ranges: 91.7% for AGIs below $25k, 94.2% for AGIs $25k-50k, 92.9% for AGIs $50k-75k, 95.5% for AGIs $75k-100k, 92.7% for AGIs $100k-200k, 100.0% for AGIs over 200k)
Averages for the 2012 tax year for zip code 18210, filed in 2013:
Average Adjusted Gross Income (AGI) in 2012: $44,653 (Individual Income Tax Returns)
Here:
$44,653
State:
$61,346
Salary/wage: $40,039 (reported on 79.8% of returns)
Here:
$40,039
State:
$51,902
(% of AGI for various income ranges: 64.8% for AGIs below $25k, 68.9% for AGIs $25k-50k, 74.0% for AGIs $50k-75k, 73.3% for AGIs $75k-100k, 78.1% for AGIs $100k-200k, 52.1% for AGIs over 200k)
Taxable interest for individuals: $819 (reported on 27.4% of returns)
This zip code:
$819
Pennsylvania:
$1,588
(% of AGI for various income ranges: 0.9% for AGIs below $25k, 0.4% for AGIs $25k-50k, 0.5% for AGIs $50k-75k, 0.5% for AGIs $75k-100k, 0.4% for AGIs $100k-200k, 0.5% for AGIs over 200k)
Ordinary dividends: $2,310 (reported on 16.6% of returns)
Here:
$2,310
State:
$5,827
(% of AGI for various income ranges: 1.7% for AGIs below $25k, 0.8% for AGIs $25k-50k, 1.0% for AGIs $50k-75k, 1.0% for AGIs $75k-100k, 0.5% for AGIs $100k-200k)
Net capital gain/loss in AGI: +$829 (reported on 11.4% of returns)
Here:
+$829
State:
+$14,495
(% of AGI for various income ranges: 0.4% for AGIs $50k-75k, 0.4% for AGIs $75k-100k, 0.8% for AGIs $100k-200k)
Profit/loss from business: +$8,819 (reported on 11.6% of returns)
Here:
+$8,819
State:
+$16,268
(% of AGI for various income ranges: 7.0% for AGIs below $25k, 2.8% for AGIs $25k-50k, 1.0% for AGIs $50k-75k, 1.9% for AGIs $75k-100k, 1.8% for AGIs $100k-200k)
Taxable individual retirement arrangement distribution: $14,338 (reported on 10.8% of returns)
18210:
$14,338
Pennsylvania:
$14,550
(% of AGI for various income ranges: 3.6% for AGIs below $25k, 3.3% for AGIs $25k-50k, 3.4% for AGIs $50k-75k, 3.1% for AGIs $75k-100k, 4.7% for AGIs $100k-200k)
Total itemized deductions: $19,072 (27% of AGI, reported on 36.8% of returns)
Here:
$19,072
State:
$23,538
Here:
27.0% of AGI
State:
18.4% of AGI
(% of AGI for various income ranges: 14.3% for AGIs below $25k, 13.4% for AGIs $25k-50k, 17.3% for AGIs $50k-75k, 17.0% for AGIs $75k-100k, 16.7% for AGIs $100k-200k, 12.5% for AGIs over 200k)
Charity contributions: $1,906 (reported on 26.9% of returns)
Here:
$1,906
State:
$4,025
(% of AGI for various income ranges: 0.7% for AGIs below $25k, 0.8% for AGIs $25k-50k, 1.3% for AGIs $50k-75k, 1.2% for AGIs $75k-100k, 1.5% for AGIs $100k-200k, 1.1% for AGIs over 200k)
Taxes paid: $6,742 (reported on 36.6% of returns)
18210:
$6,742
State:
$9,982
(% of AGI for various income ranges: 3.6% for AGIs below $25k, 4.1% for AGIs $25k-50k, 5.7% for AGIs $50k-75k, 6.4% for AGIs $75k-100k, 6.7% for AGIs $100k-200k, 5.9% for AGIs over 200k)
Earned income credit: $2,065 (reported on 18.3% of returns)
Here:
$2,065
State:
$2,106
(% of AGI for various income ranges: 5.5% for AGIs below $25k, 1.2% for AGIs $25k-50k)
Percentage of individuals using paid preparers for their 2012 taxes: 55.7%
Here:
56%
State:
53%
(% for various income ranges: 49.3% for AGIs below $25k, 53.8% for AGIs $25k-50k, 60.7% for AGIs $50k-75k, 63.9% for AGIs $75k-100k, 69.0% for AGIs $100k-200k, 100.0% for AGIs over 200k)
Averages for the 2004 tax year for zip code 18210, filed in 2005:
Average Adjusted Gross Income (AGI) in 2004: $38,522 (Individual Income Tax Returns)
Here:
$38,522
State:
$48,049
Salary/wage: $34,984 (reported on 80.9% of returns)
Here:
$34,984
State:
$42,646
(% of AGI for various income ranges: 79.5% for AGIs below $10k, 63.7% for AGIs $10k-25k, 74.4% for AGIs $25k-50k, 78.5% for AGIs $50k-75k, 76.0% for AGIs $75k-100k, 66.8% for AGIs over 100k)
Taxable interest for individuals: $1,018 (reported on 44.2% of returns)
This zip code:
$1,018
Pennsylvania:
$1,657
(% of AGI for various income ranges: 6.2% for AGIs below $10k, 2.4% for AGIs $10k-25k, 1.1% for AGIs $25k-50k, 1.1% for AGIs $50k-75k, 0.6% for AGIs $75k-100k, 0.6% for AGIs over 100k)
Taxable dividends: $1,742 (reported on 21.1% of returns)
Here:
$1,742
State:
$3,566
(% of AGI for various income ranges: 6.2% for AGIs below $10k, 1.2% for AGIs $10k-25k, 1.0% for AGIs $25k-50k, 0.8% for AGIs $50k-75k, 0.7% for AGIs $75k-100k, 0.6% for AGIs over 100k)
Net capital gain/loss: +$3,910 (reported on 15.8% of returns)
Here:
+$3,910
State:
+$9,716
(% of AGI for various income ranges: -2.2% for AGIs below $10k, -0.2% for AGIs $10k-25k, 0.1% for AGIs $25k-50k, 0.6% for AGIs $50k-75k, 1.4% for AGIs $75k-100k, 7.5% for AGIs over 100k)
Profit/loss from business: +$8,755 (reported on 13.7% of returns)
Here:
+$8,755
State:
+$14,267
(% of AGI for various income ranges: 7.3% for AGIs below $10k, 9.8% for AGIs $10k-25k, 2.8% for AGIs $25k-50k, 2.4% for AGIs $50k-75k, 2.4% for AGIs $75k-100k, 0.7% for AGIs over 100k)
IRA payment deduction: $2,727 (reported on 1.6% of returns)
18210:
$2,727
Pennsylvania:
$2,903
Total itemized deductions: $15,676 (27% of AGI, reported on 41.2% of returns)
Here:
$15,676
State:
$18,804
Here:
27.0% of AGI
State:
19.5% of AGI
(% of AGI for various income ranges: 14.9% for AGIs below $10k, 17.1% for AGIs $10k-25k, 16.4% for AGIs $25k-50k, 18.3% for AGIs $50k-75k, 17.0% for AGIs $75k-100k, 14.6% for AGIs over 100k)
Charity contributions deductions: $1,704 (3% of AGI, reported on 34.7% of returns)
Here:
$1,704
State:
$3,337
Here:
2.8% of AGI
State:
3.3% of AGI
(% of AGI for various income ranges: 0.8% for AGIs below $10k, 0.8% for AGIs $10k-25k, 1.4% for AGIs $25k-50k, 1.8% for AGIs $50k-75k, 1.9% for AGIs $75k-100k, 1.4% for AGIs over 100k)
Total tax: $4,519 (reported on 74.3% of returns)
18210:
$4,519
State:
$8,008
(% of AGI for various income ranges: 2.9% for AGIs below $10k, 4.3% for AGIs $10k-25k, 6.1% for AGIs $25k-50k, 8.4% for AGIs $50k-75k, 10.2% for AGIs $75k-100k, 15.1% for AGIs over 100k)
Earned income credit: $1,596 (reported on 14.3% of returns)
Here:
$1,596
State:
$1,643
Percentage of individuals using paid preparers for their 2004 taxes: 64.1%
Here:
64%
State:
56%
(% for various income ranges: 57.7% for AGIs below $10k, 65.4% for AGIs $10k-25k, 65.5% for AGIs $25k-50k, 65.6% for AGIs $50k-75k, 69.1% for AGIs $75k-100k, 63.1% for AGIs over 100k)
Household received Food Stamps/SNAP in the past 12 months: 190 Household did not receive Food Stamps/SNAP in the past 12 months: 2,806
Women who had a birth in the past 12 months: 63 (0 now married, 54 unmarried) Women who did not have a birth in the past 12 months: 1,286 (678 now married, 602 unmarried)
Housing units in zip code 18210 with a mortgage: 1,633 (96 second mortgage, 96 both second mortgage and home equity loan) Houses without a mortgage: 197
Median monthly owner costs for units with a mortgage: $1,354 Median monthly owner costs for units without a mortgage: $669
Residents with income below the poverty level in 2022:
This zip code:
9.3%
Whole state:
11.8%
Residents with income below 50% of the poverty level in 2022:
This zip code:
4.4%
Whole state:
6.1%
Median number of rooms in houses and condos:
Here:
6.2
State:
6.8
Median number of rooms in apartments:
Here:
5.2
State:
4.3
Notable locations in this zip code not listed on our city pages
Notable locations in zip code 18210: Albrightsville Volunteer Fire Company (A), Penn Forest Township Volunteer Fire Company 2 (B). Display/hide their locations on the map
Lakes, reservoirs, and swamps: Little Lake (A), Holiday Lake (B), Wernetts Pond (C), Placid Lake (D), Indian Mountain Lake (E), Yost Swamp (F). Display/hide their locations on the map
Streams, rivers, and creeks: Keipers Run (A), Swamp Run (B), Hawk Run (C), Dilldown Creek (D), Wolf Run (E), Carpsrocus Creek (F), Schoch Creek (G), Laurel Run (H), Pinoak Run (I). Display/hide their locations on the map
In group quarters: 18 (-1 institutionalized population)
Size of family households: 1,242 2-persons, 475 3-persons, 175 4-persons, 245 5-persons, 19 6-persons, 40 7-or-more-persons
Size of nonfamily households: 754 1-person, 55 2-persons
695 married couples with children.
213 single-parent households (47 men, 166 women).
83.3% of residents of 18210 zip code speak English at home.
6.9% of residents speak Spanish at home (52% very well, 39% well, 9% not well).
9.5% of residents speak other Indo-European language at home (62% very well, 37% well).
0.4% of residents speak Asian or Pacific Island language at home (3% very well, 48% well, 48% not well).
0.2% of residents speak other language at home (100% very well).
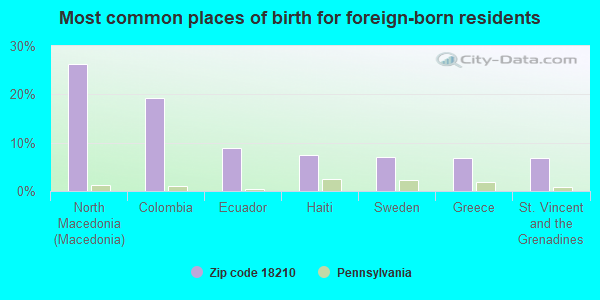
Foreign born population: 1,009 (14.0%) (82.5% of them are naturalized citizens)
This zip code:
14.0%
Whole state:
7.5%
26%North Macedonia (Macedonia)
19%Colombia
9%Ecuador
8%Haiti
7%Sweden
7%Greece
7%St. Vincent and the Grenadines
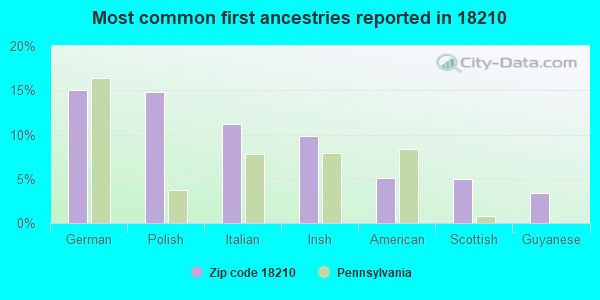
15%German
15%Polish
11%Italian
10%Irish
5%American
5%Scottish
3%Guyanese
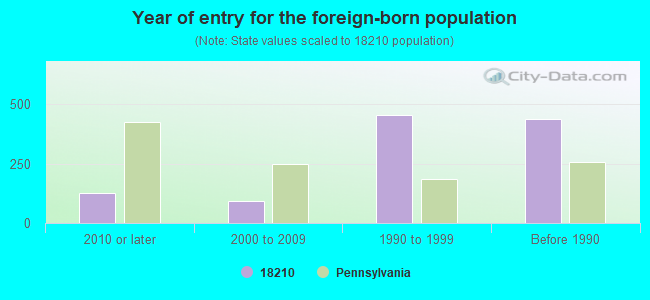
Year of entry for the foreign-born population
1262010 or later
942000 to 2009
4551990 to 1999
440Before 1990
Housing units lacking complete plumbing facilities: 1.5% Housing units lacking complete kitchen facilities: 1.7%
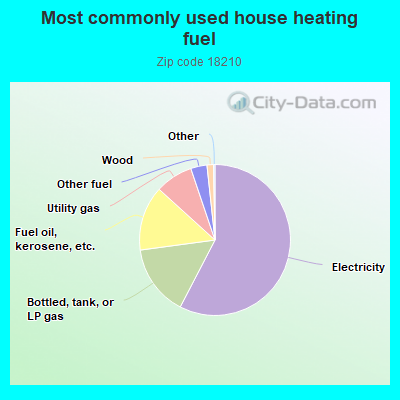
57.8%Electricity
15.3%Bottled, tank, or LP gas
13.9%Fuel oil, kerosene, etc.
8.1%Utility gas
3.5%Other fuel
1.4%Wood
Population in 1990: 3,862. Population change in the 1990s: +567 (+14.7%).
Place of birth for U.S.-born residents:
This state: 3,182
Northeast: 2,506
Midwest: 102
South: 192
West: 127
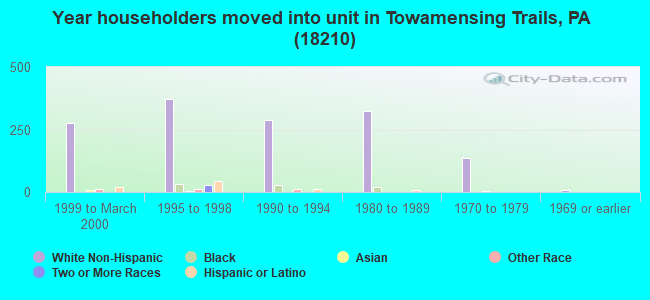
54% of the 18210 zip code residents lived in the same house 5 years ago. Out of people who lived in different houses, 23% lived in this county. Out of people who lived in different counties, 50% lived in Pennsylvania.
95% of the 18210 zip code residents lived in the same house 1 year ago. Out of people who lived in different houses, 39% moved from different county within same state. Out of people who lived in different houses, 41% moved from different state. Out of people who lived in different houses, 31% moved from abroad.
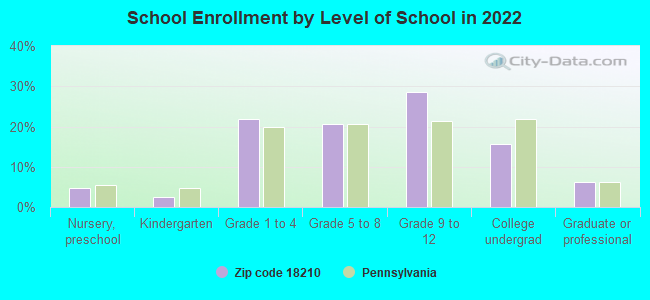
Private vs. public school enrollment:
Students in private schools in grades 1 to 8 (elementary and middle school): 8
Here:
1.7%
Pennsylvania:
15.7%
Students in private schools in grades 9 to 12 (high school): 2
Here:
0.9%
Pennsylvania:
13.4%
Students in private undergraduate colleges: 71
Here:
39.9%
Pennsylvania:
39.8%
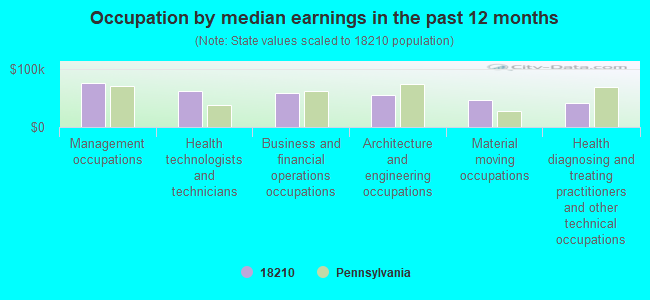
Occupation by median earnings in the past 12 months ($)
75,500Management occupations
61,710Health technologists and technicians
57,677Business and financial operations occupations
55,370Architecture and engineering occupations
46,861Material moving occupations
40,480Health diagnosing and treating practitioners and other technical occupations
Top industries in this zip code by the number of employees in 2005:
Administrative and Support and Waste Management and Remediation Services: Janitorial Services (50-99 employees: 1 establishment, 1-4 employees: 2 establishments)
Health Care and Social Assistance: Other Individual and Family Services (20-49: 1)
Arts, Entertainment, and Recreation: Fitness and Recreational Sports Centers (10-19: 1, 1-4: 1)
Accommodation and Food Services: Full-Service Restaurants (10-19: 1, 1-4: 1)
Real Estate and Rental and Leasing: Residential Property Managers (10-19: 1)
Accommodation and Food Services: Limited-Service Restaurants (10-19: 1)
Finance and Insurance: Commercial Banking (10-19: 1)
Other Services (except Public Administration): Civic and Social Organizations (10-19: 1)
People in group quarters in 2010:
10 people in residential treatment centers for juveniles (non-correctional)
People in group quarters in 2000:
19 people in homes for abused, dependent, and neglected children
4 people in homes for the mentally retarded
Fatal accident statistics in 2011:
Fatal accident count: 1
Vehicles involved in fatal accidents: 1
Fatal accidents caused by drunken drivers: 1
Fatalities: 1
Persons involved in fatal accidents: 2
Pedestrians involved in fatal accidents: 0
Fatal accident statistics in 2010:
Fatal accident count: 1
Vehicles involved in fatal accidents: 1
Fatal accidents caused by drunken drivers: 1
Fatalities: 1
Persons involved in fatal accidents: 1
Pedestrians involved in fatal accidents: 0
Home Mortgage Disclosure Act Aggregated Statistics For Year 2009 (Based on 2 partial tracts)
A) FHA, FSA/RHS & VA Home Purchase Loans
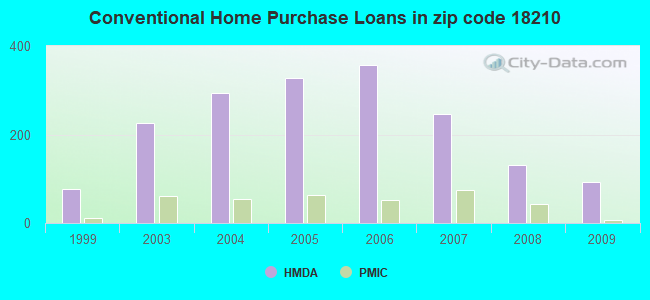
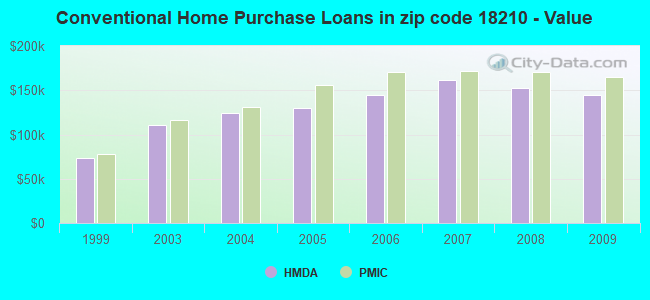
B) Conventional Home Purchase Loans
C) Refinancings
D) Home Improvement Loans
F) Non-occupant Loans on < 5 Family Dwellings (A B C & D)
G) Loans On Manufactured Home Dwelling (A B C & D)
Number
Average Value
Number
Average Value
Number
Average Value
Number
Average Value
Number
Average Value
Number
Average Value
LOANS ORIGINATED
33
$142,752
92
$145,149
245
$143,651
28
$48,374
143
$147,411
3
$124,160
APPLICATIONS APPROVED, NOT ACCEPTED
2
$155,410
3
$163,580
25
$155,562
3
$29,650
9
$167,961
0
$0
APPLICATIONS DENIED
14
$163,677
23
$138,018
128
$152,773
14
$45,089
34
$153,419
0
$0
APPLICATIONS WITHDRAWN
2
$176,635
10
$156,725
65
$149,311
4
$60,270
18
$155,354
1
$155,160
FILES CLOSED FOR INCOMPLETENESS
2
$99,060
4
$143,408
18
$181,046
2
$32,850
6
$145,133
1
$95,020
Aggregated Statistics For Year 2008 (Based on 2 partial tracts)
A) FHA, FSA/RHS & VA Home Purchase Loans
B) Conventional Home Purchase Loans
C) Refinancings
D) Home Improvement Loans
F) Non-occupant Loans on < 5 Family Dwellings (A B C & D)
G) Loans On Manufactured Home Dwelling (A B C & D)
Number
Average Value
Number
Average Value
Number
Average Value
Number
Average Value
Number
Average Value
Number
Average Value
LOANS ORIGINATED
29
$164,063
131
$152,797
176
$146,000
43
$56,511
127
$157,868
3
$97,373
APPLICATIONS APPROVED, NOT ACCEPTED
4
$150,482
12
$157,769
37
$155,923
9
$73,171
19
$156,142
2
$51,805
APPLICATIONS DENIED
10
$176,486
32
$172,041
157
$164,802
35
$65,601
43
$153,665
2
$48,265
APPLICATIONS WITHDRAWN
3
$141,343
19
$162,419
61
$166,691
4
$125,970
25
$156,896
2
$86,170
FILES CLOSED FOR INCOMPLETENESS
3
$118,263
7
$157,540
15
$193,467
2
$27,040
4
$167,540
0
$0
Aggregated Statistics For Year 2007 (Based on 2 partial tracts)
A) FHA, FSA/RHS & VA Home Purchase Loans
B) Conventional Home Purchase Loans
C) Refinancings
D) Home Improvement Loans
E) Loans on Dwellings For 5+ Families
F) Non-occupant Loans on < 5 Family Dwellings (A B C & D)
G) Loans On Manufactured Home Dwelling (A B C & D)
Number
Average Value
Number
Average Value
Number
Average Value
Number
Average Value
Number
Average Value
Number
Average Value
Number
Average Value
LOANS ORIGINATED
12
$163,118
247
$161,552
216
$137,364
65
$52,328
0
$0
176
$152,186
2
$83,390
APPLICATIONS APPROVED, NOT ACCEPTED
1
$144,040
26
$137,197
41
$147,614
11
$65,196
1
$179,420
22
$147,439
1
$21,730
APPLICATIONS DENIED
2
$124,580
46
$160,541
198
$157,156
58
$69,824
0
$0
34
$165,058
2
$83,895
APPLICATIONS WITHDRAWN
2
$111,695
18
$175,037
71
$152,367
11
$90,421
0
$0
18
$168,663
0
$0
FILES CLOSED FOR INCOMPLETENESS
0
$0
9
$155,831
20
$151,544
2
$162,990
0
$0
6
$116,158
0
$0
Aggregated Statistics For Year 2006 (Based on 2 partial tracts)
A) FHA, FSA/RHS & VA Home Purchase Loans
B) Conventional Home Purchase Loans
C) Refinancings
D) Home Improvement Loans
F) Non-occupant Loans on < 5 Family Dwellings (A B C & D)
G) Loans On Manufactured Home Dwelling (A B C & D)
Number
Average Value
Number
Average Value
Number
Average Value
Number
Average Value
Number
Average Value
Number
Average Value
LOANS ORIGINATED
11
$158,236
358
$144,570
232
$122,403
69
$54,166
194
$141,775
5
$107,650
APPLICATIONS APPROVED, NOT ACCEPTED
1
$210,250
43
$124,893
46
$138,831
16
$72,778
24
$145,724
1
$110,180
APPLICATIONS DENIED
4
$146,818
66
$150,870
213
$143,612
60
$53,749
36
$150,595
2
$94,760
APPLICATIONS WITHDRAWN
3
$111,863
39
$144,324
121
$138,442
12
$88,656
25
$147,577
1
$29,820
FILES CLOSED FOR INCOMPLETENESS
1
$121,300
13
$140,268
33
$153,917
3
$27,797
7
$147,360
2
$88,700
Aggregated Statistics For Year 2005 (Based on 2 partial tracts)
A) FHA, FSA/RHS & VA Home Purchase Loans
B) Conventional Home Purchase Loans
C) Refinancings
D) Home Improvement Loans
E) Loans on Dwellings For 5+ Families
F) Non-occupant Loans on < 5 Family Dwellings (A B C & D)
G) Loans On Manufactured Home Dwelling (A B C & D)
Number
Average Value
Number
Average Value
Number
Average Value
Number
Average Value
Number
Average Value
Number
Average Value
Number
Average Value
LOANS ORIGINATED
6
$129,552
327
$129,940
266
$114,369
78
$50,728
0
$0
212
$125,969
4
$92,110
APPLICATIONS APPROVED, NOT ACCEPTED
1
$75,810
37
$120,640
38
$123,810
7
$22,960
0
$0
18
$123,571
1
$28,300
APPLICATIONS DENIED
1
$54,580
55
$132,433
204
$129,979
55
$40,120
1
$151,620
34
$119,453
5
$99,868
APPLICATIONS WITHDRAWN
1
$143,530
41
$130,825
137
$141,154
22
$134,321
0
$0
26
$119,372
1
$126,860
FILES CLOSED FOR INCOMPLETENESS
1
$48,520
14
$125,231
40
$144,924
3
$43,633
0
$0
6
$89,203
0
$0
Aggregated Statistics For Year 2004 (Based on 2 partial tracts)
A) FHA, FSA/RHS & VA Home Purchase Loans
B) Conventional Home Purchase Loans
C) Refinancings
D) Home Improvement Loans
F) Non-occupant Loans on < 5 Family Dwellings (A B C & D)
G) Loans On Manufactured Home Dwelling (A B C & D)
Number
Average Value
Number
Average Value
Number
Average Value
Number
Average Value
Number
Average Value
Number
Average Value
LOANS ORIGINATED
9
$115,119
294
$124,175
261
$102,261
47
$38,690
208
$114,211
3
$73,113
APPLICATIONS APPROVED, NOT ACCEPTED
2
$70,000
36
$125,915
48
$106,871
11
$61,705
21
$97,446
1
$76,820
APPLICATIONS DENIED
3
$79,347
40
$129,344
184
$105,859
51
$34,169
27
$88,239
3
$64,017
APPLICATIONS WITHDRAWN
1
$64,190
26
$132,454
134
$112,840
5
$30,728
18
$131,853
1
$40,430
FILES CLOSED FOR INCOMPLETENESS
0
$0
12
$124,412
37
$121,091
4
$26,532
12
$110,051
0
$0
Aggregated Statistics For Year 2003 (Based on 2 partial tracts)
A) FHA, FSA/RHS & VA Home Purchase Loans
B) Conventional Home Purchase Loans
C) Refinancings
D) Home Improvement Loans
F) Non-occupant Loans on < 5 Family Dwellings (A B C & D)
Number
Average Value
Number
Average Value
Number
Average Value
Number
Average Value
Number
Average Value
LOANS ORIGINATED
9
$109,222
225
$110,927
402
$92,550
41
$37,806
225
$100,080
APPLICATIONS APPROVED, NOT ACCEPTED
2
$85,920
35
$112,358
59
$90,715
6
$28,050
26
$100,322
APPLICATIONS DENIED
2
$80,610
34
$102,046
170
$105,748
25
$37,925
28
$85,647
APPLICATIONS WITHDRAWN
1
$66,710
21
$111,525
113
$110,119
4
$41,190
21
$95,785
FILES CLOSED FOR INCOMPLETENESS
0
$0
11
$86,010
26
$101,702
2
$48,520
8
$80,928
Aggregated Statistics For Year 1999 (Based on 1 partial tract)
A) FHA, FSA/RHS & VA Home Purchase Loans
B) Conventional Home Purchase Loans
C) Refinancings
D) Home Improvement Loans
F) Non-occupant Loans on < 5 Family Dwellings (A B C & D)
Detailed PMIC statistics for the following Tracts:0201.01
2003 - 2018 National Fire Incident Reporting System (NFIRS) incidents
Based on the data from the years 2003 - 2018 the average number of fire incidents per year is 20. The highest number of fire incidents - 53 took place in 2005, and the least - 0 in 2009. The data has a dropping trend.
When looking into fire subcategories, the most incidents belonged to: Structure Fires (47.8%), and Outside Fires (21.0%).
Fire incident types reported to NFIRS in Zip Code 18210

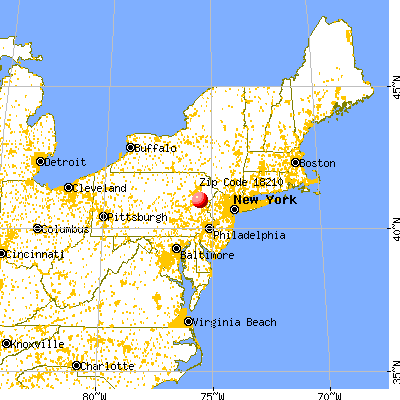


 Nearest zip codes: 18610, 18624, 18229, 18333, 18330, 18347.


 Based on the data from the years 2003 - 2018 the average number of fire incidents per year is 20. The highest number of fire incidents - 53 took place in 2005, and the least - 0 in 2009. The data has a dropping trend.
 When looking into fire subcategories, the most incidents belonged to: Structure Fires (47.8%), and Outside Fires (21.0%).