Estimated zip code population in 2022: 2,161 Zip code population in 2010: 2,078 Zip code population in 2000: 2,076
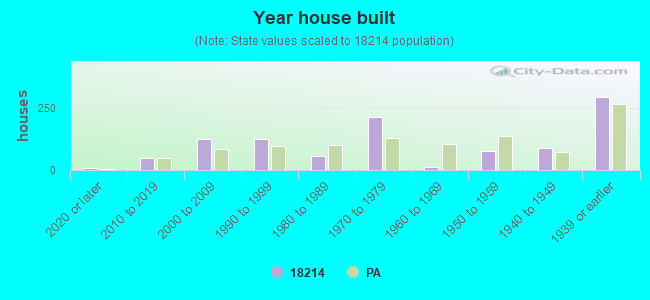
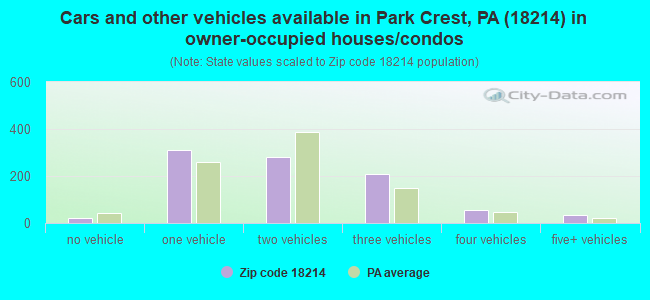
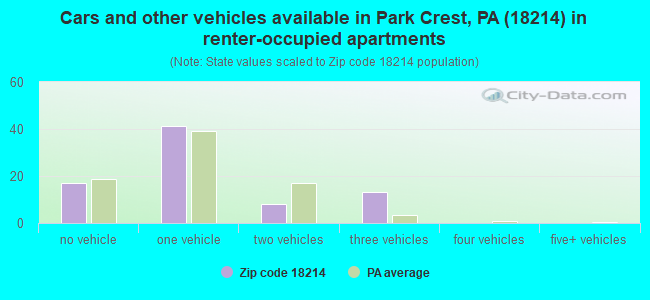
Houses and condos: 1,057 Renter-occupied apartments: 79
% of renters here:
8%
State:
31%
March 2022 cost of living index in zip code 18214: 91.4 (less than average, U.S. average is 100)
Land area: 23.9 sq. mi. Water area: 0.4 sq. mi.
Population density: 90 people per square mile
(very low).
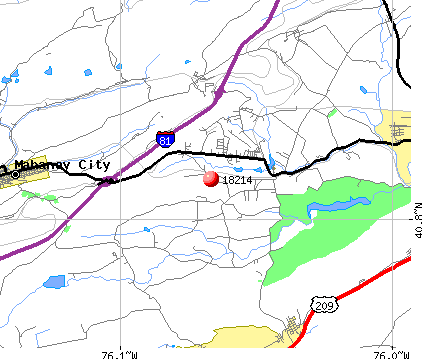
OSM Map
General Map
Google Map
MSN Map
OSM Map
General Map
Google Map
MSN Map
OSM Map
General Map
Google Map
MSN Map
OSM Map
General Map
Google Map
MSN Map
Please wait while loading the map...
Real estate property taxes paid for housing units in 2022:
This zip code:
1.5% ($2,904)
Pennsylvania:
1.3% ($3,094)
Median real estate property taxes paid for housing units with mortgages in 2022: $3,392 (1.6%) Median real estate property taxes paid for housing units with no mortgage in 2022: $2,575 (1.5%)
Business Search- 14 Million verified businesses
Males: 1,032
(47.8%)
Females: 1,128
(52.2%)
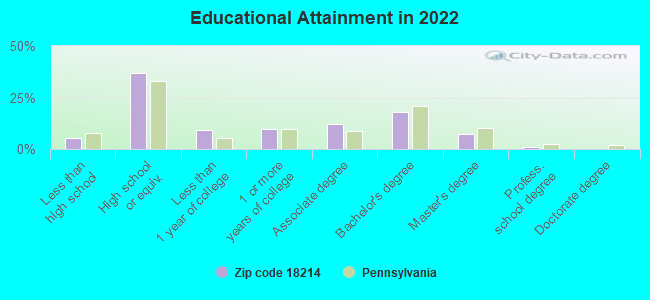
For population 25 years and over in 18214:
High school or higher: 94.2%
Bachelor's degree or higher: 26.5%
Graduate or professional degree: 8.5%
Unemployed: 4.9%
Mean travel time to work (commute): 24.0 minutes
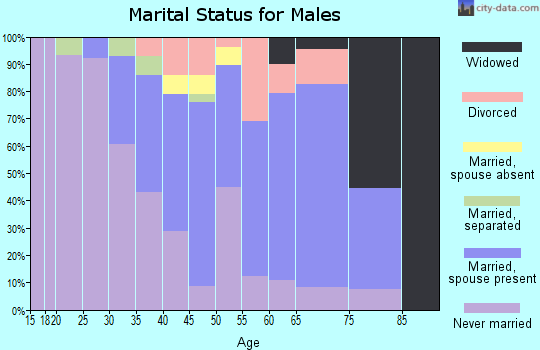
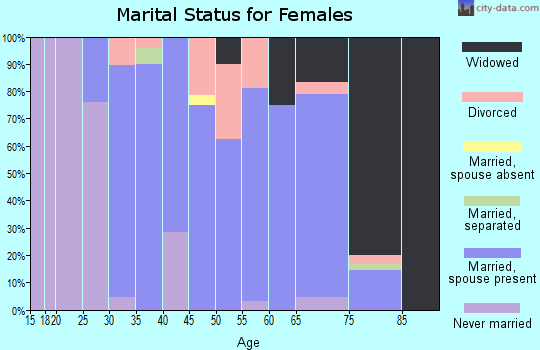
For population 15 years and over in 18214:
Never married: 25.5%
Now married: 56.4%
Separated: 1.2%
Widowed: 8.9%
Divorced: 8.0%
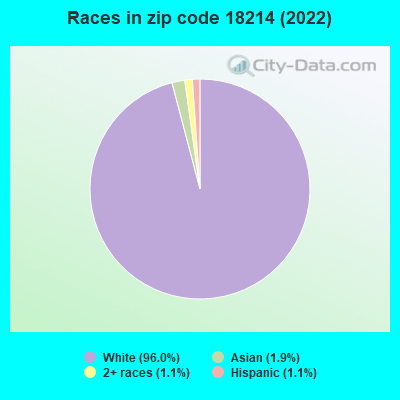
Zip code 18214 compared to state average:
Black race population percentage significantly below state average.
Hispanic race population percentage significantly below state average.
Median age significantly above state average.
Foreign-born population percentage significantly below state average.
Renting percentage significantly below state average.
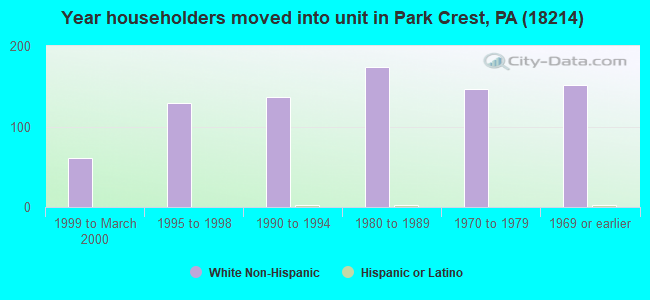
Length of stay since moving in significantly above state average.
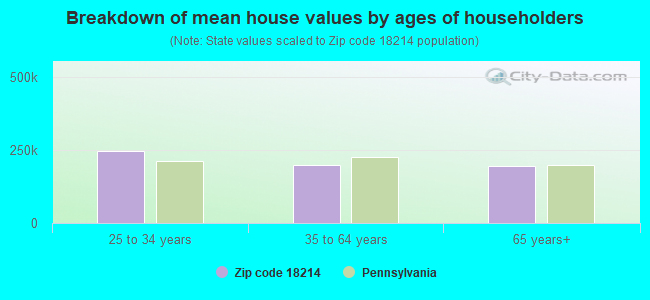
Estimated median house/condo value in 2022: $195,250
18214:
$195,250
Pennsylvania:
$245,500
According to our research of Pennsylvania and other state lists, there was 1 registered sex offender living in 18214 zip code as of May 20, 2024. The ratio of all residents to sex offenders in zip code 18214 is 1,983 to 1. The ratio of registered sex offenders to all residents in this zip code is much lower than the state average.
Median resident age:
This zip code:
50.6 years
Pennsylvania median age:
40.9 years
Average household size:
This zip code:
2.2 people
Pennsylvania:
2.4 people
Averages for the 2020 tax year for zip code 18214, filed in 2021:
Average Adjusted Gross Income (AGI) in 2020: $60,908 (Individual Income Tax Returns)
Here:
$60,908
State:
$75,707
Salary/wage: $56,724 (reported on 75.0% of returns)
Here:
$56,724
State:
$62,806
(% of AGI for various income ranges: 887.9% for AGIs below $25k, 3119.0% for AGIs $25k-50k, 5693.1% for AGIs $50k-75k, 8125.0% for AGIs $75k-100k, 13227.5% for AGIs $100k-200k)
Taxable interest for individuals: $827 (reported on 34.2% of returns)
This zip code:
$827
Pennsylvania:
$1,633
(% of AGI for various income ranges: 25.8% for AGIs below $25k, 28.0% for AGIs $25k-50k, 30.0% for AGIs $50k-75k, 75.0% for AGIs $75k-100k, 61.3% for AGIs $100k-200k)
Ordinary dividends: $3,252 (reported on 24.2% of returns)
Here:
$3,252
State:
$7,382
(% of AGI for various income ranges: 35.0% for AGIs below $25k, 26.0% for AGIs $25k-50k, 79.4% for AGIs $50k-75k, 171.0% for AGIs $75k-100k, 318.1% for AGIs $100k-200k)
Net capital gain/loss in AGI: +$3,461 (reported on 15.0% of returns)
Here:
+$3,461
State:
+$23,522
(% of AGI for various income ranges: 7.1% for AGIs below $25k, 30.0% for AGIs $25k-50k, 8.8% for AGIs $50k-75k, 172.0% for AGIs $75k-100k, 225.0% for AGIs $100k-200k)
Profit/loss from business: +$10,055 (reported on 9.2% of returns)
Here:
+$10,055
State:
+$16,274
(% of AGI for various income ranges: 41.2% for AGIs below $25k, 41.5% for AGIs $25k-50k, 201.3% for AGIs $50k-75k, 376.2% for AGIs $100k-200k)
Taxable individual retirement arrangement distribution: $16,044 (reported on 15.0% of returns)
18214:
$16,044
Pennsylvania:
$18,583
(% of AGI for various income ranges: 135.0% for AGIs below $25k, 189.0% for AGIs $25k-50k, 274.4% for AGIs $50k-75k, 376.0% for AGIs $75k-100k, 856.9% for AGIs $100k-200k)
Total itemized deductions: $27,633 (reported on 2.5% of returns)
Here:
$27,633
State:
$34,850
(% of AGI for various income ranges: 829.0% for AGIs $75k-100k)
Charity contributions: $5,250 (reported on 1.7% of returns)
Here:
$5,250
State:
$12,392
(% of AGI for various income ranges: 52.5% for AGIs $25k-50k)
Taxes paid: $7,267 (reported on 2.5% of returns)
18214:
$7,267
State:
$8,200
(% of AGI for various income ranges: 136.2% for AGIs $50k-75k)
Earned income credit: $1,460 (reported on 8.3% of returns)
Here:
$1,460
State:
$2,100
(% of AGI for various income ranges: 27.9% for AGIs below $25k, 39.5% for AGIs $25k-50k)
Percentage of individuals using paid preparers for their 2020 taxes: 90.0%
Here:
90%
State:
92%
(% for various income ranges: 88.9% for AGIs below $25k, 92.0% for AGIs $25k-50k, 90.5% for AGIs $50k-75k, 85.7% for AGIs $75k-100k, 90.9% for AGIs $100k-200k, 100.0% for AGIs over 200k)
Averages for the 2012 tax year for zip code 18214, filed in 2013:
Average Adjusted Gross Income (AGI) in 2012: $50,344 (Individual Income Tax Returns)
Here:
$50,344
State:
$61,346
Salary/wage: $44,726 (reported on 82.9% of returns)
Here:
$44,726
State:
$51,902
(% of AGI for various income ranges: 63.2% for AGIs below $25k, 72.0% for AGIs $25k-50k, 78.5% for AGIs $50k-75k, 75.6% for AGIs $75k-100k, 73.3% for AGIs $100k-200k)
Taxable interest for individuals: $800 (reported on 41.4% of returns)
This zip code:
$800
Pennsylvania:
$1,588
(% of AGI for various income ranges: 2.2% for AGIs below $25k, 0.9% for AGIs $25k-50k, 0.4% for AGIs $50k-75k, 0.4% for AGIs $75k-100k, 0.4% for AGIs $100k-200k)
Ordinary dividends: $2,183 (reported on 27.0% of returns)
Here:
$2,183
State:
$5,827
(% of AGI for various income ranges: 2.8% for AGIs below $25k, 1.3% for AGIs $25k-50k, 0.6% for AGIs $50k-75k, 0.6% for AGIs $75k-100k, 1.4% for AGIs $100k-200k)
Profit/loss from business: +$6,655 (reported on 9.9% of returns)
Here:
+$6,655
State:
+$16,268
(% of AGI for various income ranges: 4.6% for AGIs below $25k, 3.2% for AGIs $25k-50k, 1.8% for AGIs $75k-100k)
Taxable individual retirement arrangement distribution: $13,385 (reported on 11.7% of returns)
18214:
$13,385
Pennsylvania:
$14,550
(% of AGI for various income ranges: 4.3% for AGIs below $25k, 3.6% for AGIs $25k-50k, 4.9% for AGIs $50k-75k, 3.3% for AGIs $100k-200k)
Total itemized deductions: $17,404 (18% of AGI, reported on 23.4% of returns)
Here:
$17,404
State:
$23,538
Here:
18.1% of AGI
State:
18.4% of AGI
(% of AGI for various income ranges: 7.6% for AGIs $25k-50k, 6.5% for AGIs $50k-75k, 8.0% for AGIs $75k-100k, 11.2% for AGIs $100k-200k)
Charity contributions: $1,833 (reported on 18.9% of returns)
Here:
$1,833
State:
$4,025
(% of AGI for various income ranges: 0.7% for AGIs $25k-50k, 0.3% for AGIs $50k-75k, 0.8% for AGIs $75k-100k, 1.0% for AGIs $100k-200k)
Taxes paid: $7,373 (reported on 23.4% of returns)
18214:
$7,373
State:
$9,982
(% of AGI for various income ranges: 2.1% for AGIs $25k-50k, 2.6% for AGIs $50k-75k, 3.2% for AGIs $75k-100k, 5.5% for AGIs $100k-200k)
Earned income credit: $1,762 (reported on 11.7% of returns)
Here:
$1,762
State:
$2,106
(% of AGI for various income ranges: 3.3% for AGIs below $25k, 0.7% for AGIs $25k-50k)
Percentage of individuals using paid preparers for their 2012 taxes: 55.0%
Here:
55%
State:
53%
(% for various income ranges: 50.0% for AGIs below $25k, 53.6% for AGIs $25k-50k, 52.9% for AGIs $50k-75k, 66.7% for AGIs $75k-100k, 64.3% for AGIs $100k-200k)
Averages for the 2004 tax year for zip code 18214, filed in 2005:
Average Adjusted Gross Income (AGI) in 2004: $38,772 (Individual Income Tax Returns)
Here:
$38,772
State:
$48,049
Salary/wage: $36,583 (reported on 84.2% of returns)
Here:
$36,583
State:
$42,646
(% of AGI for various income ranges: 84.9% for AGIs below $10k, 66.0% for AGIs $10k-25k, 82.3% for AGIs $25k-50k, 84.0% for AGIs $50k-75k, 85.9% for AGIs $75k-100k, 66.2% for AGIs over 100k)
Taxable interest for individuals: $1,052 (reported on 53.3% of returns)
This zip code:
$1,052
Pennsylvania:
$1,657
(% of AGI for various income ranges: 9.0% for AGIs below $10k, 4.4% for AGIs $10k-25k, 1.9% for AGIs $25k-50k, 0.8% for AGIs $50k-75k, 0.4% for AGIs $75k-100k, 0.6% for AGIs over 100k)
Taxable dividends: $1,502 (reported on 29.1% of returns)
Here:
$1,502
State:
$3,566
(% of AGI for various income ranges: 3.4% for AGIs below $10k, 2.3% for AGIs $10k-25k, 0.9% for AGIs $25k-50k, 0.6% for AGIs $50k-75k, 1.3% for AGIs $75k-100k, 1.3% for AGIs over 100k)
Net capital gain/loss: +$1,819 (reported on 17.8% of returns)
Here:
+$1,819
State:
+$9,716
(% of AGI for various income ranges: -2.6% for AGIs below $10k, -0.3% for AGIs $10k-25k, 0.4% for AGIs $25k-50k, 0.1% for AGIs $50k-75k, 0.0% for AGIs $75k-100k, 4.8% for AGIs over 100k)
Profit/loss from business: +$8,904 (reported on 10.8% of returns)
Here:
+$8,904
State:
+$14,267
(% of AGI for various income ranges: -1.8% for AGIs below $10k, 6.0% for AGIs $10k-25k, 2.0% for AGIs $25k-50k, 2.6% for AGIs $50k-75k, 3.6% for AGIs $75k-100k)
IRA payment deduction: $2,308 (reported on 3.7% of returns)
18214:
$2,308
Pennsylvania:
$2,903
Total itemized deductions: $14,442 (21% of AGI, reported on 25.5% of returns)
Here:
$14,442
State:
$18,804
Here:
20.5% of AGI
State:
19.5% of AGI
(% of AGI for various income ranges: 6.4% for AGIs $10k-25k, 6.7% for AGIs $25k-50k, 10.5% for AGIs $50k-75k, 12.8% for AGIs $75k-100k, 10.4% for AGIs over 100k)
Charity contributions deductions: $1,831 (3% of AGI, reported on 23.6% of returns)
Here:
$1,831
State:
$3,337
Here:
2.5% of AGI
State:
3.3% of AGI
(% of AGI for various income ranges: 0.7% for AGIs $10k-25k, 0.7% for AGIs $25k-50k, 1.1% for AGIs $50k-75k, 1.7% for AGIs $75k-100k, 1.5% for AGIs over 100k)
Total tax: $4,696 (reported on 77.3% of returns)
18214:
$4,696
State:
$8,008
(% of AGI for various income ranges: 2.4% for AGIs below $10k, 4.4% for AGIs $10k-25k, 7.5% for AGIs $25k-50k, 8.4% for AGIs $50k-75k, 10.3% for AGIs $75k-100k, 16.3% for AGIs over 100k)
Earned income credit: $1,444 (reported on 9.4% of returns)
Here:
$1,444
State:
$1,643
Percentage of individuals using paid preparers for their 2004 taxes: 54.5%
Here:
55%
State:
56%
(% for various income ranges: 54.8% for AGIs below $10k, 58.9% for AGIs $10k-25k, 50.0% for AGIs $25k-50k, 53.8% for AGIs $50k-75k, 54.7% for AGIs $75k-100k, 58.8% for AGIs over 100k)
Household received Food Stamps/SNAP in the past 12 months: 116 Household did not receive Food Stamps/SNAP in the past 12 months: 877
Women who had a birth in the past 12 months: 35 (28 now married, 7 unmarried) Women who did not have a birth in the past 12 months: 424 (173 now married, 251 unmarried)
Housing units in zip code 18214 with a mortgage: 459 (30 second mortgage, 3 home equity loan, 26 both second mortgage and home equity loan) Houses without a mortgage: 120
Median monthly owner costs for units with a mortgage: $1,305 Median monthly owner costs for units without a mortgage: $555
Residents with income below the poverty level in 2022:
This zip code:
14.6%
Whole state:
11.8%
Residents with income below 50% of the poverty level in 2022:
This zip code:
6.7%
Whole state:
6.1%
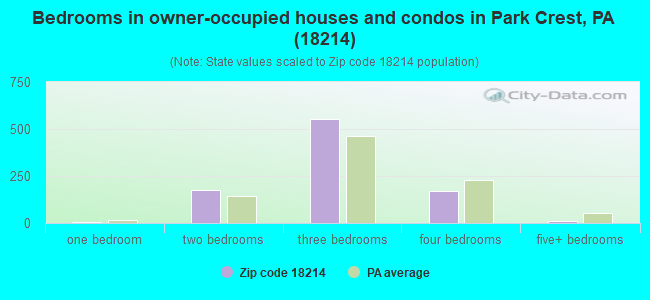
Median number of rooms in houses and condos:
Here:
6.6
State:
6.8
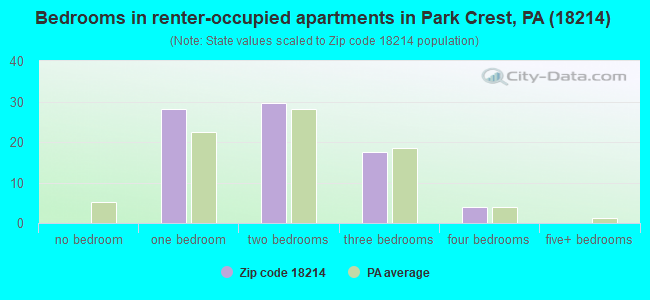
Median number of rooms in apartments:
Here:
5.2
State:
4.3
Notable locations in this zip code not listed on our city pages
Reservoirs: Broad Mountain Reservoir (A), Tuscarora Lake (B), Lakeside Park Reservoir (C), Eisenhuth Reservoir (D), Locust Lake (E), Codorus Reservoir (F). Display/hide their locations on the map
Size of family households: 376 2-persons, 109 3-persons, 94 4-persons, 29 5-persons, 11 6-persons
Size of nonfamily households: 312 1-person, 64 2-persons
225 married couples with children.
37 single-parent households (32 men, 5 women).
96.1% of residents of 18214 zip code speak English at home.
1.0% of residents speak Spanish at home (71% very well, 29% not well).
0.3% of residents speak other Indo-European language at home (100% very well).
2.7% of residents speak Asian or Pacific Island language at home (100% very well).
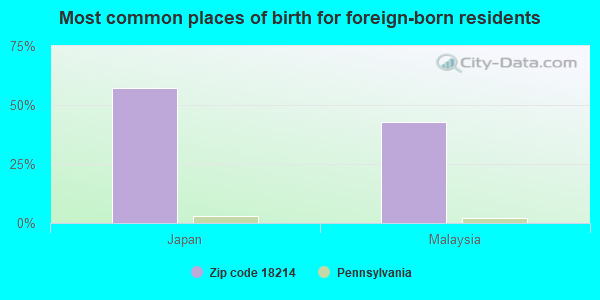
Foreign born population: 42 (2.0%) (44.9% of them are naturalized citizens)
This zip code:
2.0%
Whole state:
7.5%
57%Japan
43%Malaysia
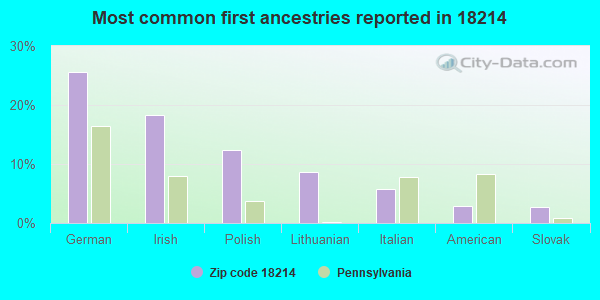
26%German
18%Irish
12%Polish
9%Lithuanian
6%Italian
3%American
3%Slovak
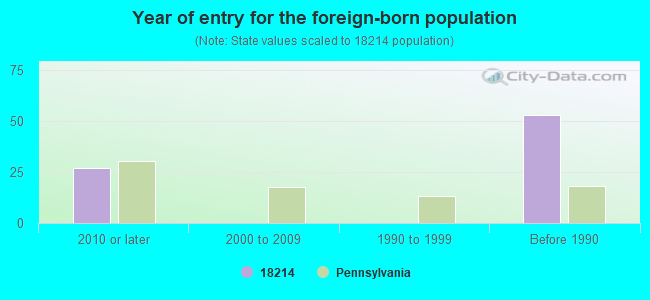
Year of entry for the foreign-born population
272010 or later
02000 to 2009
01990 to 1999
53Before 1990
Facilities with environmental interests located in this zip code:
ARTEX INC (ROUTE 54 & LAKEVIEW RD in BARNESVILLE, PA)
National Pollutant Discharge Elimination System NON-MAJOR (Tracking pollutant discharge elimination systems) - permit Business SIC classification: PETROLEUM BULK STATIONS AND TERMINALS
BARNESVILLE PETROLEUM STORAGE TERMINAL (LAKEVIEW ROAD in BARNESVILLE, PA)
OIL CONTROL (Facility Response Plan for oil discharge) Business SIC classification: PETROLEUM BULK STATIONS AND TERMINALS Organizations: ARTEX INC. (CONTACT/GENERAL)
Housing units lacking complete plumbing facilities: 0.6% Housing units lacking complete kitchen facilities: 0.6%
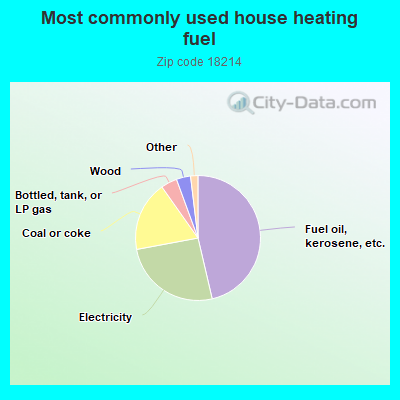
46.5%Fuel oil, kerosene, etc.
25.8%Electricity
18.2%Coal or coke
4.2%Bottled, tank, or LP gas
3.7%Wood
0.9%Utility gas
0.7%Other fuel
Population in 1990: 1,949. Population change in the 1990s: +127 (+6.5%).
Place of birth for U.S.-born residents:
This state: 1,915
Northeast: 71
South: 48
West: 25
76% of the 18214 zip code residents lived in the same house 5 years ago. Out of people who lived in different houses, 85% lived in this county. Out of people who lived in different counties, 50% lived in Pennsylvania.
98% of the 18214 zip code residents lived in the same house 1 year ago. Out of people who lived in different houses, 83% moved from this county. Out of people who lived in different houses, 7% moved from different county within same state. Out of people who lived in different houses, 20% moved from different state.
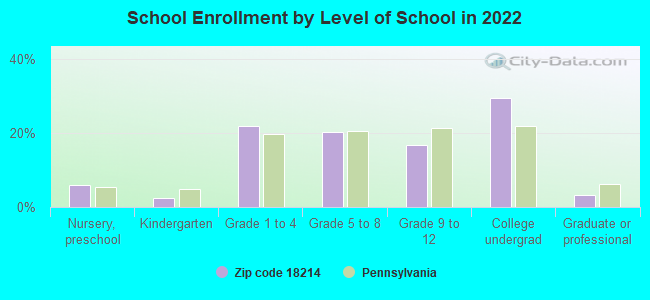
Private vs. public school enrollment:
Students in private schools in grades 1 to 8 (elementary and middle school): 35
Here:
21.2%
Pennsylvania:
15.7%
Students in private schools in grades 9 to 12 (high school): 11
Here:
17.6%
Pennsylvania:
13.4%
Students in private undergraduate colleges: 17
Here:
15.6%
Pennsylvania:
39.8%
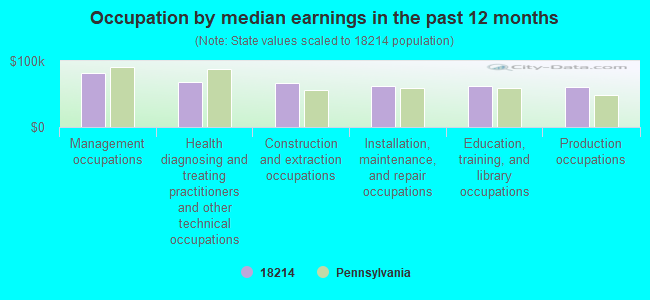
Occupation by median earnings in the past 12 months ($)
82,153Management occupations
67,599Health diagnosing and treating practitioners and other technical occupations
66,621Construction and extraction occupations
62,444Installation, maintenance, and repair occupations
62,079Education, training, and library occupations
61,133Production occupations
Top industries in this zip code by the number of employees in 2005:
Administrative and Support and Waste Management and Remediation Services: Exterminating and Pest Control Services (20-49 employees: 1 establishment)
Professional, Scientific, and Technical Services: Advertising Agencies (10-19: 1)
Arts, Entertainment, and Recreation: Golf Courses and Country Clubs (5-9: 1)
Construction: Residential Remodelers (5-9: 1)
Other Services (except Public Administration): Religious Organizations (1-4: 2)
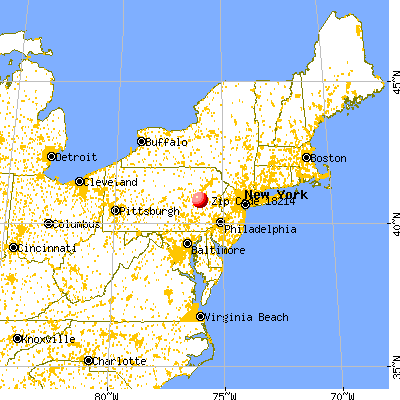


 Nearest zip codes: 17925, 18220, 17952, 17948, 17953, 17982.