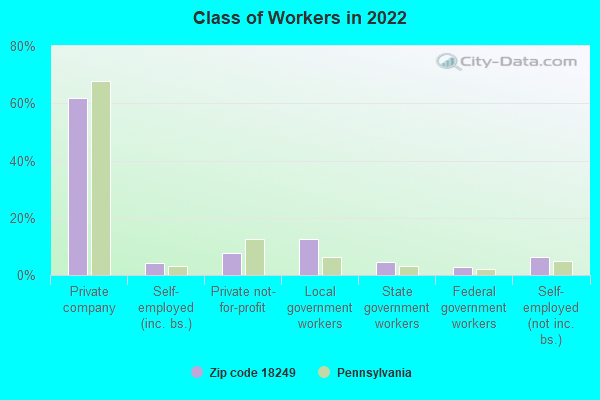
Estimated zip code population in 2022: 4,016 Zip code population in 2010: 4,129 Zip code population in 2000: 3,622
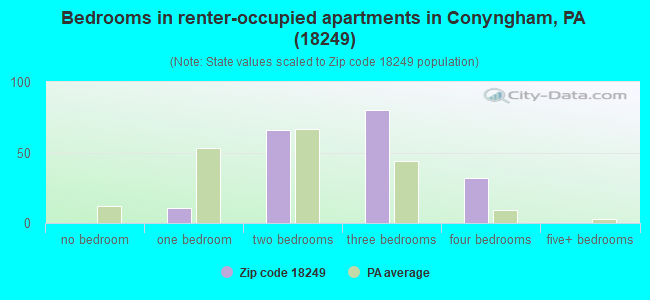
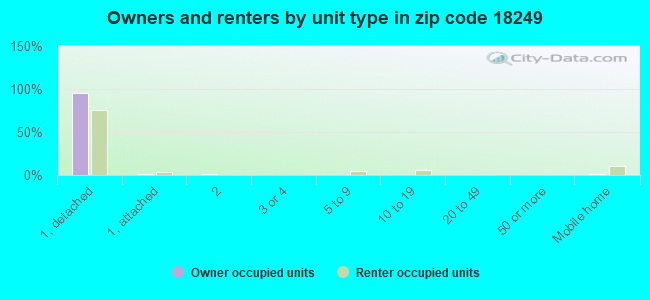
Houses and condos: 1,685 Renter-occupied apartments: 193
% of renters here:
13%
State:
31%
March 2022 cost of living index in zip code 18249: 92.6 (less than average, U.S. average is 100)
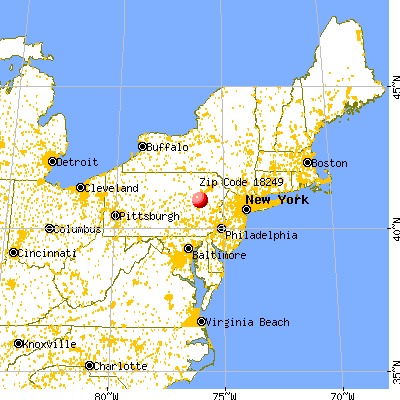
Land area: 31.9 sq. mi. Water area: 0.0 sq. mi.
Population density: 126 people per square mile
(very low).
OSM Map
General Map
Google Map
MSN Map
OSM Map
General Map
Google Map
MSN Map
OSM Map
General Map
Google Map
MSN Map
OSM Map
General Map
Google Map
MSN Map
Please wait while loading the map...
Real estate property taxes paid for housing units in 2022:
This zip code:
1.3% ($3,550)
Pennsylvania:
1.3% ($3,094)
Median real estate property taxes paid for housing units with mortgages in 2022: $3,658 (1.4%) Median real estate property taxes paid for housing units with no mortgage in 2022: $3,369 (1.1%)
Business Search- 14 Million verified businesses
Males: 1,984
(49.4%)
Females: 2,032
(50.6%)
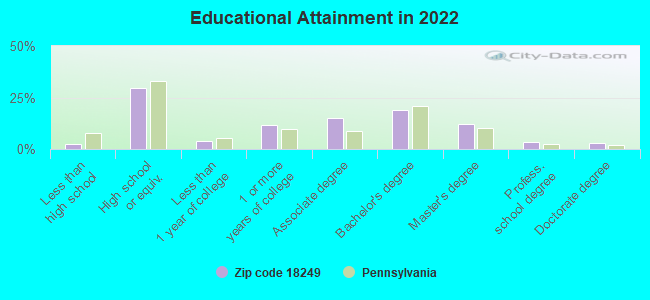
For population 25 years and over in 18249:
High school or higher: 98.4%
Bachelor's degree or higher: 38.0%
Graduate or professional degree: 19.0%
Unemployed: 3.3%
Mean travel time to work (commute): 26.0 minutes
For population 15 years and over in 18249:
Never married: 22.0%
Now married: 70.0%
Separated: 0.3%
Widowed: 4.2%
Divorced: 3.4%
Zip code 18249 compared to state average:
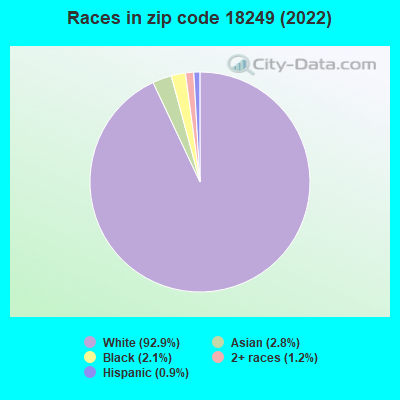
Black race population percentage significantly below state average.
Hispanic race population percentage significantly below state average.
Median age above state average.
Foreign-born population percentage below state average.
Renting percentage significantly below state average.
Length of stay since moving in significantly above state average.
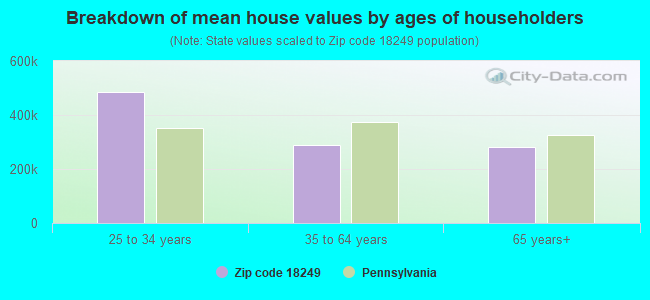
Estimated median house/condo value in 2022: $269,269
18249:
$269,269
Pennsylvania:
$245,500
According to our research of Pennsylvania and other state lists, there were 3 registered sex offenders living in 18249 zip code as of May 20, 2024. The ratio of all residents to sex offenders in zip code 18249 is 1,283 to 1. The ratio of registered sex offenders to all residents in this zip code is lower than the state average.
Median resident age:
This zip code:
47.9 years
Pennsylvania median age:
40.9 years
Average household size:
This zip code:
2.6 people
Pennsylvania:
2.4 people
Averages for the 2020 tax year for zip code 18249, filed in 2021:
Average Adjusted Gross Income (AGI) in 2020: $87,636 (Individual Income Tax Returns)
Here:
$87,636
State:
$75,707
Salary/wage: $66,899 (reported on 78.3% of returns)
Here:
$66,899
State:
$62,806
(% of AGI for various income ranges: 931.1% for AGIs below $25k, 3283.5% for AGIs $25k-50k, 6037.0% for AGIs $50k-75k, 8372.5% for AGIs $75k-100k, 14689.6% for AGIs $100k-200k, 66696.0% for AGIs over 200k)
Taxable interest for individuals: $1,678 (reported on 40.1% of returns)
This zip code:
$1,678
Pennsylvania:
$1,633
(% of AGI for various income ranges: 23.4% for AGIs below $25k, 33.2% for AGIs $25k-50k, 71.3% for AGIs $50k-75k, 105.0% for AGIs $75k-100k, 229.3% for AGIs $100k-200k, 648.0% for AGIs over 200k)
Ordinary dividends: $5,876 (reported on 34.1% of returns)
Here:
$5,876
State:
$7,382
(% of AGI for various income ranges: 67.4% for AGIs below $25k, 91.9% for AGIs $25k-50k, 116.5% for AGIs $50k-75k, 206.2% for AGIs $75k-100k, 472.2% for AGIs $100k-200k, 3908.0% for AGIs over 200k)
Net capital gain/loss in AGI: +$24,274 (reported on 28.6% of returns)
Here:
+$24,274
State:
+$23,522
(% of AGI for various income ranges: 15.1% for AGIs below $25k, 39.4% for AGIs $25k-50k, 100.9% for AGIs $50k-75k, 211.2% for AGIs $75k-100k, 428.9% for AGIs $100k-200k, 26294.0% for AGIs over 200k)
Profit/loss from business: +$16,743 (reported on 13.8% of returns)
Here:
+$16,743
State:
+$16,274
(% of AGI for various income ranges: 108.9% for AGIs below $25k, 143.9% for AGIs $25k-50k, 290.4% for AGIs $50k-75k, 274.4% for AGIs $75k-100k, 354.1% for AGIs $100k-200k, 4266.0% for AGIs over 200k)
Taxable individual retirement arrangement distribution: $21,333 (reported on 15.2% of returns)
18249:
$21,333
Pennsylvania:
$18,583
(% of AGI for various income ranges: 121.1% for AGIs below $25k, 183.9% for AGIs $25k-50k, 308.7% for AGIs $50k-75k, 502.5% for AGIs $75k-100k, 840.7% for AGIs $100k-200k, 4524.0% for AGIs over 200k)
Total itemized deductions: $28,920 (reported on 6.9% of returns)
Here:
$28,920
State:
$34,850
(% of AGI for various income ranges: 144.3% for AGIs below $25k, 421.7% for AGIs $50k-75k, 330.0% for AGIs $100k-200k, 3944.0% for AGIs over 200k)
Charity contributions: $7,283 (reported on 5.5% of returns)
Here:
$7,283
State:
$12,392
(% of AGI for various income ranges: 77.4% for AGIs $50k-75k, 82.2% for AGIs $100k-200k, 948.0% for AGIs over 200k)
Taxes paid: $8,280 (reported on 6.9% of returns)
18249:
$8,280
State:
$8,200
(% of AGI for various income ranges: 27.7% for AGIs below $25k, 159.1% for AGIs $50k-75k, 113.3% for AGIs $100k-200k, 946.0% for AGIs over 200k)
Earned income credit: $1,675 (reported on 7.4% of returns)
Here:
$1,675
State:
$2,100
(% of AGI for various income ranges: 35.7% for AGIs below $25k, 46.1% for AGIs $25k-50k)
Percentage of individuals using paid preparers for their 2020 taxes: 91.7%
Here:
92%
State:
92%
(% for various income ranges: 87.7% for AGIs below $25k, 97.4% for AGIs $25k-50k, 93.8% for AGIs $50k-75k, 90.9% for AGIs $75k-100k, 90.7% for AGIs $100k-200k, 93.8% for AGIs over 200k)
Averages for the 2012 tax year for zip code 18249, filed in 2013:
Average Adjusted Gross Income (AGI) in 2012: $71,468 (Individual Income Tax Returns)
Here:
$71,468
State:
$61,346
Salary/wage: $55,830 (reported on 82.9% of returns)
Here:
$55,830
State:
$51,902
(% of AGI for various income ranges: 66.5% for AGIs below $25k, 74.4% for AGIs $25k-50k, 73.2% for AGIs $50k-75k, 72.9% for AGIs $75k-100k, 73.9% for AGIs $100k-200k, 44.2% for AGIs over 200k)
Taxable interest for individuals: $1,366 (reported on 46.2% of returns)
This zip code:
$1,366
Pennsylvania:
$1,588
(% of AGI for various income ranges: 2.6% for AGIs below $25k, 0.8% for AGIs $25k-50k, 1.0% for AGIs $50k-75k, 0.7% for AGIs $75k-100k, 0.8% for AGIs $100k-200k, 0.8% for AGIs over 200k)
Ordinary dividends: $5,501 (reported on 35.7% of returns)
Here:
$5,501
State:
$5,827
(% of AGI for various income ranges: 4.0% for AGIs below $25k, 1.9% for AGIs $25k-50k, 1.6% for AGIs $50k-75k, 2.1% for AGIs $75k-100k, 2.5% for AGIs $100k-200k, 3.9% for AGIs over 200k)
Net capital gain/loss in AGI: +$4,567 (reported on 25.6% of returns)
Here:
+$4,567
State:
+$14,495
(% of AGI for various income ranges: 0.3% for AGIs $25k-50k, 0.1% for AGIs $50k-75k, 0.6% for AGIs $75k-100k, 1.0% for AGIs $100k-200k, 4.3% for AGIs over 200k)
Profit/loss from business: +$23,575 (reported on 16.1% of returns)
Here:
+$23,575
State:
+$16,268
(% of AGI for various income ranges: 6.0% for AGIs below $25k, 2.7% for AGIs $25k-50k, 3.0% for AGIs $50k-75k, 2.6% for AGIs $75k-100k, 4.4% for AGIs $100k-200k, 9.4% for AGIs over 200k)
Taxable individual retirement arrangement distribution: $17,265 (reported on 13.1% of returns)
18249:
$17,265
Pennsylvania:
$14,550
(% of AGI for various income ranges: 6.9% for AGIs below $25k, 3.4% for AGIs $25k-50k, 2.2% for AGIs $50k-75k, 4.9% for AGIs $75k-100k, 5.2% for AGIs $100k-200k)
Self-employment retirement plans: $20,450 (reported on 1.0% of returns)
18249:
$20,450
Pennsylvania:
$20,922
Total itemized deductions: $21,624 (16% of AGI, reported on 37.7% of returns)
Here:
$21,624
State:
$23,538
Here:
16.4% of AGI
State:
18.4% of AGI
(% of AGI for various income ranges: 7.5% for AGIs below $25k, 9.3% for AGIs $25k-50k, 11.5% for AGIs $50k-75k, 13.3% for AGIs $75k-100k, 14.0% for AGIs $100k-200k, 9.2% for AGIs over 200k)
Charity contributions: $3,142 (reported on 33.2% of returns)
Here:
$3,142
State:
$4,025
(% of AGI for various income ranges: 0.9% for AGIs below $25k, 0.8% for AGIs $25k-50k, 1.1% for AGIs $50k-75k, 1.4% for AGIs $75k-100k, 2.0% for AGIs $100k-200k, 1.4% for AGIs over 200k)
Taxes paid: $9,672 (reported on 38.2% of returns)
18249:
$9,672
State:
$9,982
(% of AGI for various income ranges: 2.1% for AGIs below $25k, 3.3% for AGIs $25k-50k, 4.4% for AGIs $50k-75k, 5.4% for AGIs $75k-100k, 6.4% for AGIs $100k-200k, 5.3% for AGIs over 200k)
Earned income credit: $1,694 (reported on 8.5% of returns)
Here:
$1,694
State:
$2,106
(% of AGI for various income ranges: 2.9% for AGIs below $25k, 0.6% for AGIs $25k-50k)
Percentage of individuals using paid preparers for their 2012 taxes: 62.3%
Here:
62%
State:
53%
(% for various income ranges: 55.2% for AGIs below $25k, 60.0% for AGIs $25k-50k, 62.1% for AGIs $50k-75k, 66.7% for AGIs $75k-100k, 70.0% for AGIs $100k-200k, 88.9% for AGIs over 200k)
Averages for the 2004 tax year for zip code 18249, filed in 2005:
Average Adjusted Gross Income (AGI) in 2004: $57,656 (Individual Income Tax Returns)
Here:
$57,656
State:
$48,049
Salary/wage: $49,096 (reported on 83.3% of returns)
Here:
$49,096
State:
$42,646
(% of AGI for various income ranges: 86.1% for AGIs below $10k, 75.0% for AGIs $10k-25k, 78.0% for AGIs $25k-50k, 79.1% for AGIs $50k-75k, 80.1% for AGIs $75k-100k, 62.2% for AGIs over 100k)
Taxable interest for individuals: $1,951 (reported on 60.6% of returns)
This zip code:
$1,951
Pennsylvania:
$1,657
(% of AGI for various income ranges: 12.7% for AGIs below $10k, 3.4% for AGIs $10k-25k, 2.9% for AGIs $25k-50k, 2.1% for AGIs $50k-75k, 1.9% for AGIs $75k-100k, 1.4% for AGIs over 100k)
Taxable dividends: $3,710 (reported on 43.9% of returns)
Here:
$3,710
State:
$3,566
(% of AGI for various income ranges: 10.5% for AGIs below $10k, 2.9% for AGIs $10k-25k, 2.0% for AGIs $25k-50k, 1.6% for AGIs $50k-75k, 1.5% for AGIs $75k-100k, 3.7% for AGIs over 100k)
Net capital gain/loss: +$7,462 (reported on 31.5% of returns)
Here:
+$7,462
State:
+$9,716
(% of AGI for various income ranges: -6.7% for AGIs below $10k, 1.2% for AGIs $10k-25k, 1.3% for AGIs $25k-50k, 0.0% for AGIs $50k-75k, 1.8% for AGIs $75k-100k, 7.6% for AGIs over 100k)
Profit/loss from business: +$25,274 (reported on 15.4% of returns)
Here:
+$25,274
State:
+$14,267
(% of AGI for various income ranges: 3.9% for AGIs below $10k, 4.9% for AGIs $10k-25k, 4.4% for AGIs $25k-50k, 3.1% for AGIs $50k-75k, 3.7% for AGIs $75k-100k, 10.0% for AGIs over 100k)
IRA payment deduction: $3,533 (reported on 5.3% of returns)
18249:
$3,533
Pennsylvania:
$2,903
(% of AGI for various income ranges: 0.6% for AGIs $10k-25k, 0.7% for AGIs $25k-50k, 0.7% for AGIs $50k-75k, 0.2% for AGIs $75k-100k, 0.1% for AGIs over 100k)
Self-employed pension: $14,800 (reported on 1.2% of returns)
Here:
$14,800
Pennsylvania:
$14,674
Total itemized deductions: $18,063 (18% of AGI, reported on 38.7% of returns)
Here:
$18,063
State:
$18,804
Here:
17.5% of AGI
State:
19.5% of AGI
(% of AGI for various income ranges: 8.3% for AGIs $10k-25k, 12.3% for AGIs $25k-50k, 14.4% for AGIs $50k-75k, 13.9% for AGIs $75k-100k, 11.4% for AGIs over 100k)
Charity contributions deductions: $2,756 (3% of AGI, reported on 36.3% of returns)
Here:
$2,756
State:
$3,337
Here:
2.6% of AGI
State:
3.3% of AGI
(% of AGI for various income ranges: 0.6% for AGIs $10k-25k, 1.7% for AGIs $25k-50k, 1.6% for AGIs $50k-75k, 1.9% for AGIs $75k-100k, 1.9% for AGIs over 100k)
Total tax: $9,860 (reported on 79.4% of returns)
18249:
$9,860
State:
$8,008
(% of AGI for various income ranges: 3.1% for AGIs below $10k, 5.1% for AGIs $10k-25k, 7.4% for AGIs $25k-50k, 8.4% for AGIs $50k-75k, 11.0% for AGIs $75k-100k, 19.2% for AGIs over 100k)
Earned income credit: $1,336 (reported on 6.9% of returns)
Here:
$1,336
State:
$1,643
Percentage of individuals using paid preparers for their 2004 taxes: 62.1%
Here:
62%
State:
56%
(% for various income ranges: 56.2% for AGIs below $10k, 57.7% for AGIs $10k-25k, 64.0% for AGIs $25k-50k, 63.5% for AGIs $50k-75k, 61.0% for AGIs $75k-100k, 73.1% for AGIs over 100k)
Household received Food Stamps/SNAP in the past 12 months: 42 Household did not receive Food Stamps/SNAP in the past 12 months: 1,471
Women who had a birth in the past 12 months: 45 (49 now married, 0 unmarried) Women who did not have a birth in the past 12 months: 646 (396 now married, 245 unmarried)
Housing units in zip code 18249 with a mortgage: 748 (94 second mortgage, 86 both second mortgage and home equity loan) Houses without a mortgage: 97
Median monthly owner costs for units with a mortgage: $1,620 Median monthly owner costs for units without a mortgage: $728
Residents with income below the poverty level in 2022:
This zip code:
4.0%
Whole state:
11.8%
Residents with income below 50% of the poverty level in 2022:
This zip code:
2.7%
Whole state:
6.1%
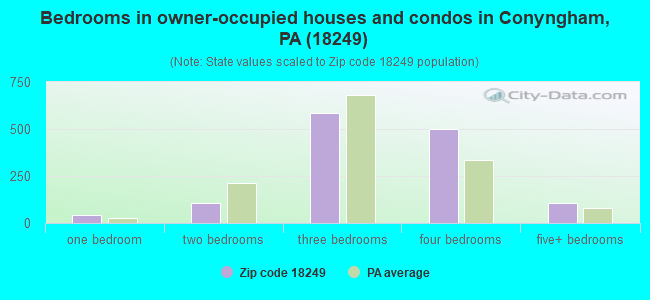
Median number of rooms in houses and condos:
Here:
7.7
State:
6.8
Median number of rooms in apartments:
Here:
5.7
State:
4.3
Notable locations in this zip code not listed on our city pages
Notable locations in zip code 18249: Sugarloaf Golf Course (A), Conyngham Station (B), Tank (C), Sugarloaf Fire Company (D), Tomhickon Colliery (E), Black Ridge Colliery (F), Derringer Colliery (G). Display/hide their locations on the map
Streams, rivers, and creeks: Scotch Run (A), Barnes Run (B), Little Nescopeck Creek (C), Kester Creek (D), Black Creek (E). Display/hide their locations on the map
640 married couples with children.
82 single-parent households (37 men, 45 women).
95.6% of residents of 18249 zip code speak English at home.
0.5% of residents speak Spanish at home (50% very well, 30% well, 20% not well).
3.2% of residents speak other Indo-European language at home (89% very well, 8% well, 2% not well).
0.2% of residents speak Asian or Pacific Island language at home (100% well).
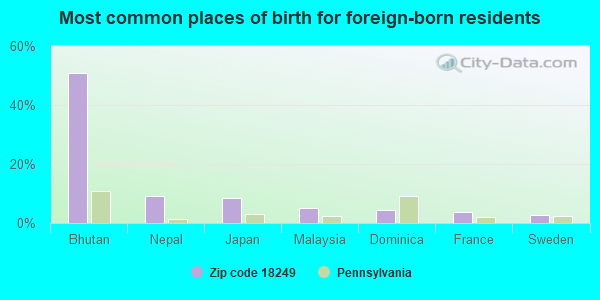
Foreign born population: 142 (3.5%) (95.7% of them are naturalized citizens)
This zip code:
3.5%
Whole state:
7.5%
51%Bhutan
9%Nepal
9%Japan
5%Malaysia
4%Dominica
4%France
3%Sweden
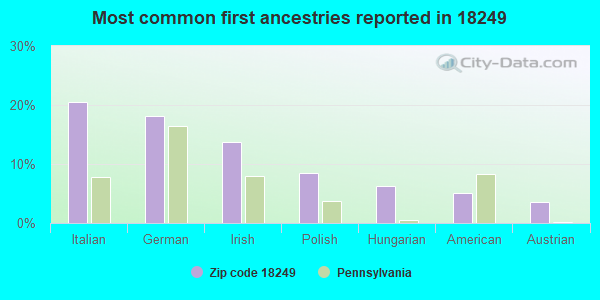
21%Italian
18%German
14%Irish
9%Polish
6%Hungarian
5%American
4%Austrian
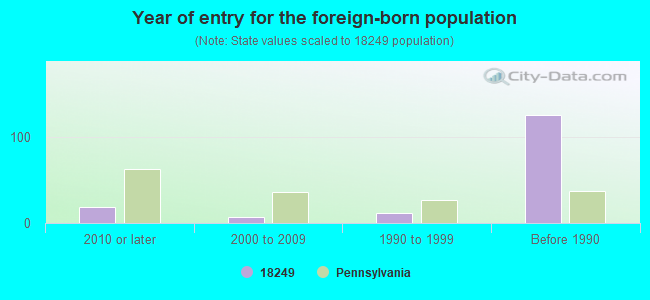
Year of entry for the foreign-born population
182010 or later
72000 to 2009
121990 to 1999
125Before 1990
Public elementary/middle school in in zip code 18249 not listed on the city page:
VALLEY EL/MS(Students: 1,152, Location: 100 ROCK GLEN RD, Grades: KG-8)
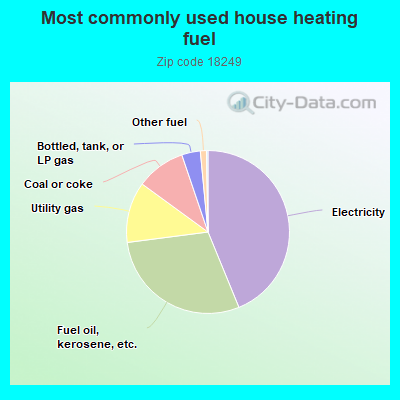
43.9%Electricity
29.2%Fuel oil, kerosene, etc.
12.1%Utility gas
9.8%Coal or coke
3.7%Bottled, tank, or LP gas
1.2%Other fuel
Population in 1990: 5,007.
Place of birth for U.S.-born residents:
This state: 3,479
Northeast: 162
Midwest: 73
South: 74
West: 22
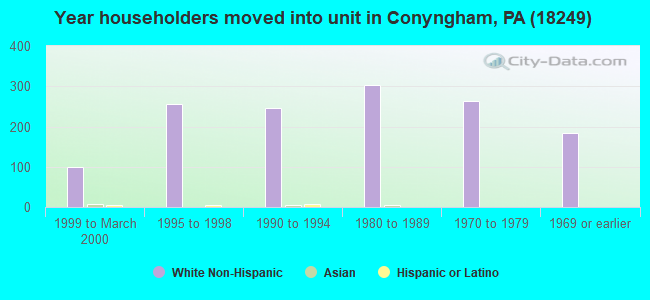
78% of the 18249 zip code residents lived in the same house 5 years ago. Out of people who lived in different houses, 67% lived in this county. Out of people who lived in different counties, 50% lived in Pennsylvania.
93% of the 18249 zip code residents lived in the same house 1 year ago. Out of people who lived in different houses, 31% moved from this county. Out of people who lived in different houses, 60% moved from different county within same state. Out of people who lived in different houses, 5% moved from different state. Out of people who lived in different houses, 3% moved from abroad.
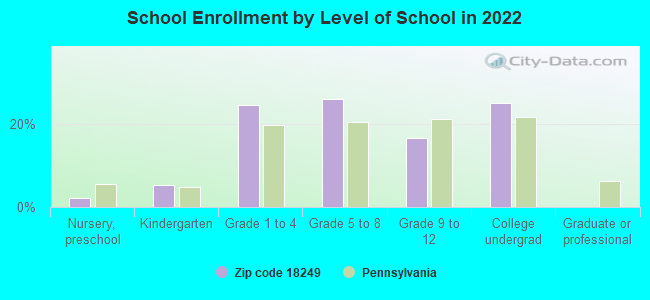
Private vs. public school enrollment:
Students in private schools in grades 1 to 8 (elementary and middle school): 31
Here:
8.9%
Pennsylvania:
15.7%
Students in private schools in grades 9 to 12 (high school): 8
Here:
7.3%
Pennsylvania:
13.4%
Students in private undergraduate colleges: 106
Here:
61.1%
Pennsylvania:
39.8%
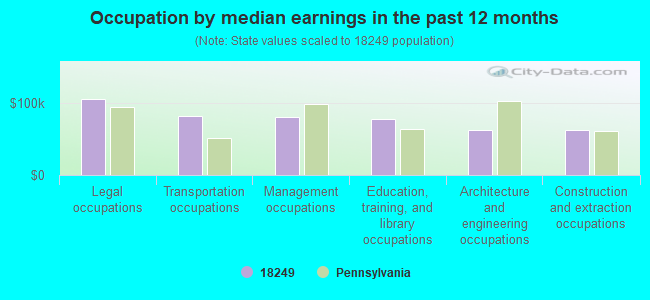
Occupation by median earnings in the past 12 months ($)
105,652Legal occupations
82,690Transportation occupations
80,137Management occupations
77,815Education, training, and library occupations
62,760Architecture and engineering occupations
62,108Construction and extraction occupations
Top industries in this zip code by the number of employees in 2005:
Arts, Entertainment, and Recreation: Golf Courses and Country Clubs (50-99 employees: 1 establishment, 5-9 employees: 1 establishment)
Accommodation and Food Services: Full-Service Restaurants (20-49: 1, 5-9: 1)
Administrative and Support and Waste Management and Remediation Services: Landscaping Services (20-49: 1, 1-4: 2)
Health Care and Social Assistance: Home Health Care Services (20-49: 1, 1-4: 1)
Health Care and Social Assistance: Offices of All Other Miscellaneous Health Practitioners (20-49: 1)
Other Services (except Public Administration): Other Personal Care Services (20-49: 1)
Accommodation and Food Services: Snack and Nonalcoholic Beverage Bars (10-19: 1, 1-4: 1)
Health Care and Social Assistance: Offices of Physicians (except Mental Health Specialists) (5-9: 2, 1-4: 1)
Construction: Plumbing, Heating, and Air-Conditioning Contractors (10-19: 1)
People in group quarters in 2000:
14 people in religious group quarters
Fatal accident statistics in 2011:
Fatal accident count: 1
Vehicles involved in fatal accidents: 1
Fatal accidents caused by drunken drivers: 1
Fatalities: 1
Persons involved in fatal accidents: 1
Pedestrians involved in fatal accidents: 0
Home Mortgage Disclosure Act Aggregated Statistics For Year 2009 (Based on 1 full and 6 partial tracts)
A) FHA, FSA/RHS & VA Home Purchase Loans
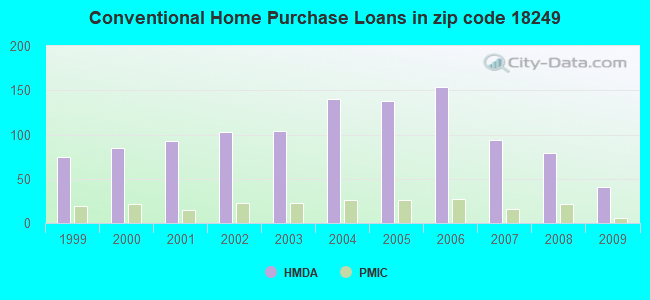
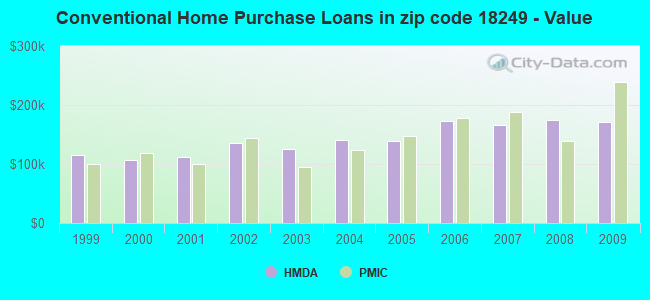
B) Conventional Home Purchase Loans
C) Refinancings
D) Home Improvement Loans
F) Non-occupant Loans on < 5 Family Dwellings (A B C & D)
Number
Average Value
Number
Average Value
Number
Average Value
Number
Average Value
Number
Average Value
LOANS ORIGINATED
16
$132,759
41
$170,910
216
$163,657
27
$63,216
19
$157,475
APPLICATIONS APPROVED, NOT ACCEPTED
0
$0
5
$118,218
26
$154,167
1
$9,000
0
$0
APPLICATIONS DENIED
1
$218,250
3
$152,470
72
$168,544
16
$26,121
2
$228,300
APPLICATIONS WITHDRAWN
2
$201,620
3
$196,800
50
$205,495
3
$75,547
0
$0
FILES CLOSED FOR INCOMPLETENESS
1
$129,070
2
$191,000
10
$161,410
0
$0
0
$0
Aggregated Statistics For Year 2008 (Based on 1 full and 6 partial tracts)
A) FHA, FSA/RHS & VA Home Purchase Loans
B) Conventional Home Purchase Loans
C) Refinancings
D) Home Improvement Loans
F) Non-occupant Loans on < 5 Family Dwellings (A B C & D)
G) Loans On Manufactured Home Dwelling (A B C & D)
Number
Average Value
Number
Average Value
Number
Average Value
Number
Average Value
Number
Average Value
Number
Average Value
LOANS ORIGINATED
12
$176,868
79
$174,481
122
$136,863
53
$45,292
9
$198,126
1
$96,610
APPLICATIONS APPROVED, NOT ACCEPTED
1
$167,660
6
$221,883
19
$108,679
15
$26,974
2
$249,280
0
$0
APPLICATIONS DENIED
3
$176,787
7
$221,889
74
$147,459
18
$48,941
5
$178,812
0
$0
APPLICATIONS WITHDRAWN
3
$104,540
6
$178,382
38
$168,002
3
$26,723
1
$170,320
0
$0
FILES CLOSED FOR INCOMPLETENESS
1
$166,320
0
$0
4
$252,508
1
$126,410
0
$0
0
$0
Aggregated Statistics For Year 2007 (Based on 1 full and 6 partial tracts)
A) FHA, FSA/RHS & VA Home Purchase Loans
B) Conventional Home Purchase Loans
C) Refinancings
D) Home Improvement Loans
E) Loans on Dwellings For 5+ Families
F) Non-occupant Loans on < 5 Family Dwellings (A B C & D)
G) Loans On Manufactured Home Dwelling (A B C & D)
Number
Average Value
Number
Average Value
Number
Average Value
Number
Average Value
Number
Average Value
Number
Average Value
Number
Average Value
LOANS ORIGINATED
7
$155,206
94
$165,680
153
$116,559
67
$54,795
0
$0
30
$140,245
5
$77,906
APPLICATIONS APPROVED, NOT ACCEPTED
0
$0
8
$188,431
27
$141,133
8
$31,749
0
$0
1
$554,860
1
$28,050
APPLICATIONS DENIED
1
$167,000
21
$112,112
118
$152,573
27
$59,969
1
$8,000
9
$85,122
3
$75,663
APPLICATIONS WITHDRAWN
0
$0
5
$186,168
42
$131,892
9
$86,052
0
$0
2
$103,375
0
$0
FILES CLOSED FOR INCOMPLETENESS
0
$0
5
$160,686
9
$143,751
0
$0
0
$0
2
$128,085
0
$0
Aggregated Statistics For Year 2006 (Based on 1 full and 6 partial tracts)
A) FHA, FSA/RHS & VA Home Purchase Loans
B) Conventional Home Purchase Loans
C) Refinancings
D) Home Improvement Loans
F) Non-occupant Loans on < 5 Family Dwellings (A B C & D)
G) Loans On Manufactured Home Dwelling (A B C & D)
Number
Average Value
Number
Average Value
Number
Average Value
Number
Average Value
Number
Average Value
Number
Average Value
LOANS ORIGINATED
3
$162,960
154
$172,149
174
$107,929
70
$34,206
32
$153,810
2
$28,110
APPLICATIONS APPROVED, NOT ACCEPTED
0
$0
22
$124,320
33
$107,327
8
$55,381
2
$98,435
2
$102,180
APPLICATIONS DENIED
0
$0
22
$122,430
119
$147,344
34
$45,878
10
$75,079
5
$99,256
APPLICATIONS WITHDRAWN
1
$114,000
11
$103,705
46
$128,271
6
$61,360
0
$0
0
$0
FILES CLOSED FOR INCOMPLETENESS
0
$0
5
$140,976
12
$148,487
2
$87,500
0
$0
0
$0
Aggregated Statistics For Year 2005 (Based on 1 full and 6 partial tracts)
A) FHA, FSA/RHS & VA Home Purchase Loans
B) Conventional Home Purchase Loans
C) Refinancings
D) Home Improvement Loans
F) Non-occupant Loans on < 5 Family Dwellings (A B C & D)
G) Loans On Manufactured Home Dwelling (A B C & D)
Number
Average Value
Number
Average Value
Number
Average Value
Number
Average Value
Number
Average Value
Number
Average Value
LOANS ORIGINATED
4
$101,650
138
$138,599
125
$114,333
69
$43,233
24
$130,313
2
$61,290
APPLICATIONS APPROVED, NOT ACCEPTED
0
$0
10
$117,233
32
$98,417
8
$42,045
4
$91,905
0
$0
APPLICATIONS DENIED
1
$92,370
25
$130,852
123
$125,417
34
$65,920
10
$112,625
5
$56,338
APPLICATIONS WITHDRAWN
2
$125,915
13
$138,116
97
$133,861
7
$136,243
2
$143,085
0
$0
FILES CLOSED FOR INCOMPLETENESS
0
$0
2
$41,895
18
$130,872
3
$19,560
1
$14,640
0
$0
Aggregated Statistics For Year 2004 (Based on 1 full and 6 partial tracts)
A) FHA, FSA/RHS & VA Home Purchase Loans
B) Conventional Home Purchase Loans
C) Refinancings
D) Home Improvement Loans
F) Non-occupant Loans on < 5 Family Dwellings (A B C & D)
G) Loans On Manufactured Home Dwelling (A B C & D)
Number
Average Value
Number
Average Value
Number
Average Value
Number
Average Value
Number
Average Value
Number
Average Value
LOANS ORIGINATED
2
$113,410
140
$140,236
180
$99,797
51
$34,559
25
$79,740
6
$42,183
APPLICATIONS APPROVED, NOT ACCEPTED
1
$92,000
10
$110,252
28
$127,031
8
$21,558
3
$125,343
1
$69,190
APPLICATIONS DENIED
2
$102,315
22
$93,835
115
$123,074
29
$30,418
5
$55,846
4
$45,895
APPLICATIONS WITHDRAWN
2
$115,970
7
$95,151
51
$111,932
2
$21,205
2
$115,810
1
$29,100
FILES CLOSED FOR INCOMPLETENESS
0
$0
5
$101,936
21
$126,421
5
$31,670
1
$83,830
1
$100,000
Aggregated Statistics For Year 2003 (Based on 1 full and 6 partial tracts)
A) FHA, FSA/RHS & VA Home Purchase Loans
B) Conventional Home Purchase Loans
C) Refinancings
D) Home Improvement Loans
E) Loans on Dwellings For 5+ Families
F) Non-occupant Loans on < 5 Family Dwellings (A B C & D)
Number
Average Value
Number
Average Value
Number
Average Value
Number
Average Value
Number
Average Value
Number
Average Value
LOANS ORIGINATED
4
$85,292
104
$125,820
361
$106,136
34
$30,961
1
$195,000
25
$98,383
APPLICATIONS APPROVED, NOT ACCEPTED
0
$0
8
$152,971
40
$101,511
11
$38,098
0
$0
1
$271,440
APPLICATIONS DENIED
0
$0
12
$66,110
118
$103,513
19
$35,307
0
$0
4
$63,188
APPLICATIONS WITHDRAWN
0
$0
17
$119,782
68
$111,815
9
$40,880
0
$0
4
$166,372
FILES CLOSED FOR INCOMPLETENESS
0
$0
0
$0
9
$172,824
0
$0
0
$0
0
$0
Aggregated Statistics For Year 2002 (Based on 1 full and 4 partial tracts)
A) FHA, FSA/RHS & VA Home Purchase Loans
B) Conventional Home Purchase Loans
C) Refinancings
D) Home Improvement Loans
F) Non-occupant Loans on < 5 Family Dwellings (A B C & D)
Number
Average Value
Number
Average Value
Number
Average Value
Number
Average Value
Number
Average Value
LOANS ORIGINATED
3
$99,600
103
$135,733
199
$104,981
47
$40,899
12
$90,001
APPLICATIONS APPROVED, NOT ACCEPTED
0
$0
9
$114,560
28
$97,105
14
$29,814
1
$88,000
APPLICATIONS DENIED
0
$0
8
$69,720
81
$103,712
8
$38,658
1
$6,000
APPLICATIONS WITHDRAWN
1
$171,000
1
$54,710
51
$109,567
1
$70,520
1
$88,000
FILES CLOSED FOR INCOMPLETENESS
0
$0
1
$56,000
12
$105,145
1
$90,790
1
$270,110
Aggregated Statistics For Year 2001 (Based on 1 full and 4 partial tracts)
A) FHA, FSA/RHS & VA Home Purchase Loans
B) Conventional Home Purchase Loans
C) Refinancings
D) Home Improvement Loans
E) Loans on Dwellings For 5+ Families
F) Non-occupant Loans on < 5 Family Dwellings (A B C & D)
Number
Average Value
Number
Average Value
Number
Average Value
Number
Average Value
Number
Average Value
Number
Average Value
LOANS ORIGINATED
10
$110,272
93
$112,449
126
$89,542
39
$27,015
1
$800,000
13
$67,132
APPLICATIONS APPROVED, NOT ACCEPTED
1
$73,000
8
$105,031
20
$102,846
6
$123,260
0
$0
0
$0
APPLICATIONS DENIED
0
$0
10
$112,350
52
$76,616
9
$19,052
0
$0
4
$111,435
APPLICATIONS WITHDRAWN
0
$0
3
$172,090
38
$102,349
7
$24,820
0
$0
0
$0
FILES CLOSED FOR INCOMPLETENESS
0
$0
4
$73,638
8
$147,256
0
$0
0
$0
0
$0
Aggregated Statistics For Year 2000 (Based on 1 full and 4 partial tracts)
A) FHA, FSA/RHS & VA Home Purchase Loans
B) Conventional Home Purchase Loans
C) Refinancings
D) Home Improvement Loans
E) Loans on Dwellings For 5+ Families
F) Non-occupant Loans on < 5 Family Dwellings (A B C & D)
Number
Average Value
Number
Average Value
Number
Average Value
Number
Average Value
Number
Average Value
Number
Average Value
LOANS ORIGINATED
10
$108,517
85
$106,266
55
$58,944
34
$35,722
2
$243,000
8
$93,701
APPLICATIONS APPROVED, NOT ACCEPTED
1
$130,400
5
$163,706
18
$58,399
6
$44,130
0
$0
0
$0
APPLICATIONS DENIED
2
$80,440
12
$70,543
33
$58,445
7
$25,411
0
$0
1
$18,620
APPLICATIONS WITHDRAWN
0
$0
7
$151,244
29
$76,628
1
$13,310
0
$0
1
$26,610
FILES CLOSED FOR INCOMPLETENESS
0
$0
4
$301,875
4
$111,138
0
$0
0
$0
0
$0
Aggregated Statistics For Year 1999 (Based on 1 full and 4 partial tracts)
A) FHA, FSA/RHS & VA Home Purchase Loans
B) Conventional Home Purchase Loans
C) Refinancings
D) Home Improvement Loans
F) Non-occupant Loans on < 5 Family Dwellings (A B C & D)
2003 - 2018 National Fire Incident Reporting System (NFIRS) incidents
Based on the data from the years 2003 - 2018 the average number of fire incidents per year is 19. The highest number of reported fire incidents - 80 took place in 2005, and the least - 0 in 2009. The data has an increasing trend.
When looking into fire subcategories, the most incidents belonged to: Structure Fires (34.8%), and Mobile Property/Vehicle Fires (32.4%).
Fire incident types reported to NFIRS in Zip Code 18249


 Nearest zip codes: 18241, 18251, 18256, 18219, 18242, 18202.


 (Students: 1,152, Location: 100 ROCK GLEN RD, Grades: KG-8)


 Based on the data from the years 2003 - 2018 the average number of fire incidents per year is 19. The highest number of reported fire incidents - 80 took place in 2005, and the least - 0 in 2009. The data has an increasing trend.
 When looking into fire subcategories, the most incidents belonged to: Structure Fires (34.8%), and Mobile Property/Vehicle Fires (32.4%).