Estimated zip code population in 2022: 7,776 Zip code population in 2010: 7,759 Zip code population in 2000: 6,736
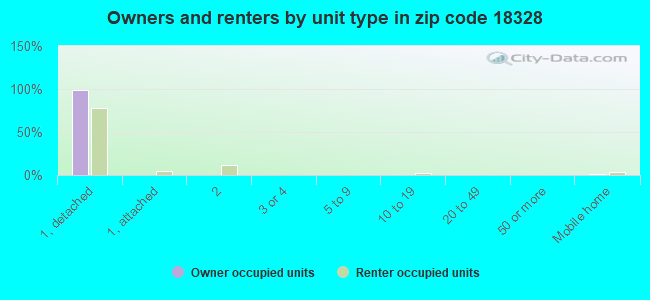
Houses and condos: 5,177 Renter-occupied apartments: 371
% of renters here:
11%
State:
31%
March 2022 cost of living index in zip code 18328: 104.9 (near average, U.S. average is 100)
Land area: 83.3 sq. mi. Water area: 3.5 sq. mi.
Population density: 93 people per square mile
(very low).
OSM Map
General Map
Google Map
MSN Map
OSM Map
General Map
Google Map
MSN Map
OSM Map
General Map
Google Map
MSN Map
OSM Map
General Map
Google Map
MSN Map
Please wait while loading the map...
Real estate property taxes paid for housing units in 2022:
This zip code:
1.5% ($3,057)
Pennsylvania:
1.3% ($3,094)
Median real estate property taxes paid for housing units with mortgages in 2022: $3,051 (1.4%) Median real estate property taxes paid for housing units with no mortgage in 2022: $3,074 (1.7%)
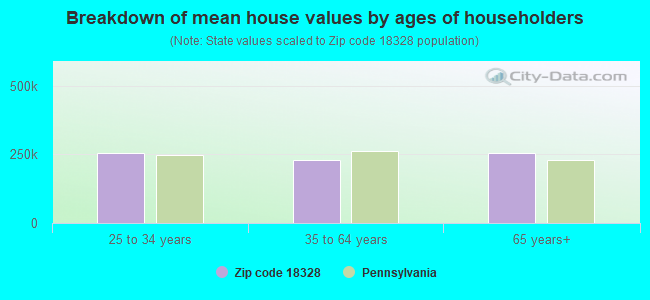
Estimated median house/condo value in 2022: $209,684
18328:
$209,684
Pennsylvania:
$245,500
According to our research of Pennsylvania and other state lists, there were 9 registered sex offenders living in 18328 zip code as of May 20, 2024. The ratio of all residents to sex offenders in zip code 18328 is 831 to 1. The ratio of registered sex offenders to all residents in this zip code is lower than the state average.
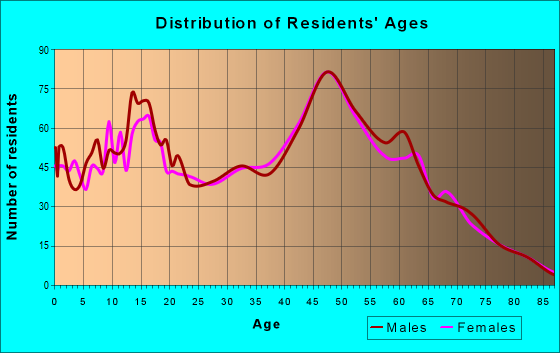
Median resident age:
This zip code:
48.6 years
Pennsylvania median age:
40.9 years
Average household size:
This zip code:
2.3 people
Pennsylvania:
2.4 people
Averages for the 2020 tax year for zip code 18328, filed in 2021:
Average Adjusted Gross Income (AGI) in 2020: $66,689 (Individual Income Tax Returns)
Here:
$66,689
State:
$75,707
Salary/wage: $57,670 (reported on 79.8% of returns)
Here:
$57,670
State:
$62,806
(% of AGI for various income ranges: 1016.5% for AGIs below $25k, 3351.2% for AGIs $25k-50k, 5946.9% for AGIs $50k-75k, 9017.5% for AGIs $75k-100k, 16224.7% for AGIs $100k-200k, 86970.0% for AGIs over 200k)
Taxable interest for individuals: $985 (reported on 26.7% of returns)
This zip code:
$985
Pennsylvania:
$1,633
(% of AGI for various income ranges: 16.8% for AGIs below $25k, 13.9% for AGIs $25k-50k, 34.0% for AGIs $50k-75k, 41.9% for AGIs $75k-100k, 92.9% for AGIs $100k-200k, 443.3% for AGIs over 200k)
Ordinary dividends: $4,157 (reported on 17.5% of returns)
Here:
$4,157
State:
$7,382
(% of AGI for various income ranges: 26.5% for AGIs below $25k, 38.4% for AGIs $25k-50k, 59.8% for AGIs $50k-75k, 78.4% for AGIs $75k-100k, 157.4% for AGIs $100k-200k, 3950.0% for AGIs over 200k)
Net capital gain/loss in AGI: +$10,330 (reported on 14.9% of returns)
Here:
+$10,330
State:
+$23,522
(% of AGI for various income ranges: 8.5% for AGIs below $25k, 12.5% for AGIs $25k-50k, 51.2% for AGIs $50k-75k, 160.9% for AGIs $75k-100k, 375.0% for AGIs $100k-200k, 11840.0% for AGIs over 200k)
Profit/loss from business: +$8,630 (reported on 11.5% of returns)
Here:
+$8,630
State:
+$16,274
(% of AGI for various income ranges: 105.6% for AGIs below $25k, 174.3% for AGIs $25k-50k, 137.7% for AGIs $50k-75k, 15.9% for AGIs $75k-100k, 188.4% for AGIs $100k-200k, 1246.7% for AGIs over 200k)
Taxable individual retirement arrangement distribution: $19,289 (reported on 9.2% of returns)
18328:
$19,289
Pennsylvania:
$18,583
(% of AGI for various income ranges: 61.1% for AGIs below $25k, 103.9% for AGIs $25k-50k, 155.0% for AGIs $50k-75k, 294.7% for AGIs $75k-100k, 1023.4% for AGIs $100k-200k)
Total itemized deductions: $24,968 (reported on 6.5% of returns)
Here:
$24,968
State:
$34,850
(% of AGI for various income ranges: 134.9% for AGIs $25k-50k, 202.5% for AGIs $50k-75k, 323.1% for AGIs $75k-100k, 575.0% for AGIs $100k-200k, 3733.3% for AGIs over 200k)
Charity contributions: $4,062 (reported on 5.5% of returns)
Here:
$4,062
State:
$12,392
(% of AGI for various income ranges: 11.2% for AGIs $25k-50k, 26.0% for AGIs $50k-75k, 29.4% for AGIs $75k-100k, 80.8% for AGIs $100k-200k, 833.3% for AGIs over 200k)
Taxes paid: $7,936 (reported on 6.5% of returns)
18328:
$7,936
State:
$8,200
(% of AGI for various income ranges: 41.3% for AGIs $25k-50k, 64.4% for AGIs $50k-75k, 99.4% for AGIs $75k-100k, 197.4% for AGIs $100k-200k, 1073.3% for AGIs over 200k)
Earned income credit: $2,102 (reported on 12.8% of returns)
Here:
$2,102
State:
$2,100
(% of AGI for various income ranges: 80.9% for AGIs below $25k, 61.3% for AGIs $25k-50k)
Percentage of individuals using paid preparers for their 2020 taxes: 94.2%
Here:
94%
State:
92%
(% for various income ranges: 92.7% for AGIs below $25k, 93.5% for AGIs $25k-50k, 95.3% for AGIs $50k-75k, 93.3% for AGIs $75k-100k, 96.7% for AGIs $100k-200k, 100.0% for AGIs over 200k)
Averages for the 2012 tax year for zip code 18328, filed in 2013:
Average Adjusted Gross Income (AGI) in 2012: $52,325 (Individual Income Tax Returns)
Here:
$52,325
State:
$61,346
Salary/wage: $45,681 (reported on 81.9% of returns)
Here:
$45,681
State:
$51,902
(% of AGI for various income ranges: 67.2% for AGIs below $25k, 70.9% for AGIs $25k-50k, 78.3% for AGIs $50k-75k, 76.5% for AGIs $75k-100k, 80.5% for AGIs $100k-200k, 35.2% for AGIs over 200k)
Taxable interest for individuals: $922 (reported on 28.3% of returns)
This zip code:
$922
Pennsylvania:
$1,588
(% of AGI for various income ranges: 1.4% for AGIs below $25k, 0.7% for AGIs $25k-50k, 0.4% for AGIs $50k-75k, 0.3% for AGIs $75k-100k, 0.4% for AGIs $100k-200k, 0.4% for AGIs over 200k)
Ordinary dividends: $2,675 (reported on 17.3% of returns)
Here:
$2,675
State:
$5,827
(% of AGI for various income ranges: 1.6% for AGIs below $25k, 0.5% for AGIs $25k-50k, 0.5% for AGIs $50k-75k, 0.5% for AGIs $75k-100k, 1.0% for AGIs $100k-200k, 2.1% for AGIs over 200k)
Net capital gain/loss in AGI: +$6,618 (reported on 11.9% of returns)
Here:
+$6,618
State:
+$14,495
(% of AGI for various income ranges: 0.2% for AGIs $25k-50k, 0.7% for AGIs $100k-200k, 11.8% for AGIs over 200k)
Profit/loss from business: +$9,902 (reported on 12.7% of returns)
Here:
+$9,902
State:
+$16,268
(% of AGI for various income ranges: 9.1% for AGIs below $25k, 3.8% for AGIs $25k-50k, 0.6% for AGIs $50k-75k, 1.6% for AGIs $75k-100k, 2.4% for AGIs $100k-200k)
Taxable individual retirement arrangement distribution: $13,714 (reported on 10.0% of returns)
18328:
$13,714
Pennsylvania:
$14,550
(% of AGI for various income ranges: 2.8% for AGIs below $25k, 2.1% for AGIs $25k-50k, 2.6% for AGIs $50k-75k, 2.3% for AGIs $75k-100k, 4.3% for AGIs $100k-200k)
Total itemized deductions: $19,409 (23% of AGI, reported on 41.0% of returns)
Here:
$19,409
State:
$23,538
Here:
23.1% of AGI
State:
18.4% of AGI
(% of AGI for various income ranges: 15.1% for AGIs below $25k, 15.1% for AGIs $25k-50k, 16.0% for AGIs $50k-75k, 15.8% for AGIs $75k-100k, 15.8% for AGIs $100k-200k, 11.7% for AGIs over 200k)
Charity contributions: $1,947 (reported on 31.8% of returns)
Here:
$1,947
State:
$4,025
(% of AGI for various income ranges: 0.7% for AGIs below $25k, 1.1% for AGIs $25k-50k, 1.2% for AGIs $50k-75k, 1.2% for AGIs $75k-100k, 1.6% for AGIs $100k-200k, 0.7% for AGIs over 200k)
Taxes paid: $6,999 (reported on 40.7% of returns)
18328:
$6,999
State:
$9,982
(% of AGI for various income ranges: 4.1% for AGIs below $25k, 4.6% for AGIs $25k-50k, 5.1% for AGIs $50k-75k, 5.7% for AGIs $75k-100k, 6.5% for AGIs $100k-200k, 5.4% for AGIs over 200k)
Earned income credit: $2,175 (reported on 14.8% of returns)
Here:
$2,175
State:
$2,106
(% of AGI for various income ranges: 5.7% for AGIs below $25k, 1.0% for AGIs $25k-50k)
Percentage of individuals using paid preparers for their 2012 taxes: 60.6%
Here:
61%
State:
53%
(% for various income ranges: 54.0% for AGIs below $25k, 62.1% for AGIs $25k-50k, 66.1% for AGIs $50k-75k, 63.4% for AGIs $75k-100k, 67.5% for AGIs $100k-200k, 75.0% for AGIs over 200k)
Averages for the 2004 tax year for zip code 18328, filed in 2005:
Average Adjusted Gross Income (AGI) in 2004: $44,528 (Individual Income Tax Returns)
Here:
$44,528
State:
$48,049
Salary/wage: $42,075 (reported on 84.0% of returns)
Here:
$42,075
State:
$42,646
(% of AGI for various income ranges: 89.7% for AGIs below $10k, 65.1% for AGIs $10k-25k, 79.8% for AGIs $25k-50k, 84.3% for AGIs $50k-75k, 87.2% for AGIs $75k-100k, 70.9% for AGIs over 100k)
Taxable interest for individuals: $946 (reported on 43.1% of returns)
This zip code:
$946
Pennsylvania:
$1,657
(% of AGI for various income ranges: 4.5% for AGIs below $10k, 2.5% for AGIs $10k-25k, 0.9% for AGIs $25k-50k, 0.5% for AGIs $50k-75k, 0.8% for AGIs $75k-100k, 0.7% for AGIs over 100k)
Taxable dividends: $1,660 (reported on 22.5% of returns)
Here:
$1,660
State:
$3,566
(% of AGI for various income ranges: 4.1% for AGIs below $10k, 1.5% for AGIs $10k-25k, 0.7% for AGIs $25k-50k, 0.3% for AGIs $50k-75k, 0.5% for AGIs $75k-100k, 1.4% for AGIs over 100k)
Net capital gain/loss: +$4,478 (reported on 15.9% of returns)
Here:
+$4,478
State:
+$9,716
(% of AGI for various income ranges: -0.7% for AGIs below $10k, 0.2% for AGIs $10k-25k, 0.3% for AGIs $25k-50k, 0.0% for AGIs $50k-75k, 0.5% for AGIs $75k-100k, 5.9% for AGIs over 100k)
Profit/loss from business: +$11,306 (reported on 13.9% of returns)
Here:
+$11,306
State:
+$14,267
(% of AGI for various income ranges: 3.8% for AGIs below $10k, 9.7% for AGIs $10k-25k, 3.7% for AGIs $25k-50k, 2.2% for AGIs $50k-75k, 1.2% for AGIs $75k-100k, 4.8% for AGIs over 100k)
IRA payment deduction: $2,864 (reported on 2.5% of returns)
18328:
$2,864
Pennsylvania:
$2,903
(% of AGI for various income ranges: 0.2% for AGIs $10k-25k, 0.2% for AGIs $25k-50k, 0.2% for AGIs $50k-75k, 0.1% for AGIs $75k-100k, 0.1% for AGIs over 100k)
Self-employed pension: $8,500 (reported on 0.5% of returns)
Here:
$8,500
Pennsylvania:
$14,674
Total itemized deductions: $17,440 (27% of AGI, reported on 47.5% of returns)
Here:
$17,440
State:
$18,804
Here:
26.5% of AGI
State:
19.5% of AGI
(% of AGI for various income ranges: 17.0% for AGIs below $10k, 18.7% for AGIs $10k-25k, 25.1% for AGIs $25k-50k, 18.4% for AGIs $50k-75k, 17.0% for AGIs $75k-100k, 14.7% for AGIs over 100k)
Charity contributions deductions: $1,820 (3% of AGI, reported on 40.7% of returns)
Here:
$1,820
State:
$3,337
Here:
2.7% of AGI
State:
3.3% of AGI
(% of AGI for various income ranges: 0.8% for AGIs below $10k, 1.1% for AGIs $10k-25k, 1.3% for AGIs $25k-50k, 1.7% for AGIs $50k-75k, 1.8% for AGIs $75k-100k, 2.0% for AGIs over 100k)
Total tax: $5,684 (reported on 76.1% of returns)
18328:
$5,684
State:
$8,008
(% of AGI for various income ranges: 2.5% for AGIs below $10k, 4.5% for AGIs $10k-25k, 6.5% for AGIs $25k-50k, 8.1% for AGIs $50k-75k, 9.7% for AGIs $75k-100k, 16.4% for AGIs over 100k)
Earned income credit: $1,671 (reported on 11.2% of returns)
Here:
$1,671
State:
$1,643
Percentage of individuals using paid preparers for their 2004 taxes: 66.0%
Here:
66%
State:
56%
(% for various income ranges: 54.6% for AGIs below $10k, 64.1% for AGIs $10k-25k, 67.0% for AGIs $25k-50k, 72.6% for AGIs $50k-75k, 67.3% for AGIs $75k-100k, 77.2% for AGIs over 100k)
Likely homosexual households (counted as self-reported same-sex unmarried-partner households)
Lesbian couples: 0.0% of all households
Gay men: 0.4% of all households
Household received Food Stamps/SNAP in the past 12 months: 394 Household did not receive Food Stamps/SNAP in the past 12 months: 2,907
Women who had a birth in the past 12 months: 38 (41 now married, 0 unmarried) Women who did not have a birth in the past 12 months: 1,107 (427 now married, 679 unmarried)
Housing units in zip code 18328 with a mortgage: 2,103 (203 second mortgage, 24 home equity loan, 151 both second mortgage and home equity loan) Houses without a mortgage: 128
Median monthly owner costs for units with a mortgage: $1,513 Median monthly owner costs for units without a mortgage: $586
Residents with income below the poverty level in 2022:
This zip code:
12.5%
Whole state:
11.8%
Residents with income below 50% of the poverty level in 2022:
This zip code:
3.3%
Whole state:
6.1%
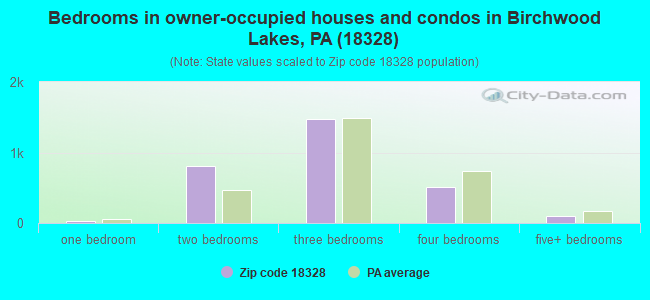
Median number of rooms in houses and condos:
Here:
5.9
State:
6.8
Median number of rooms in apartments:
Here:
5.3
State:
4.3
Notable locations in this zip code not listed on our city pages
Notable locations in zip code 18328: Pocono Mountain Lake Resort (A), Marcel Lake Estate (B), Porters Lake Club (C), Camp Fire Girls Camp (D), Camp Girard (E), Camp Log-N-Twig (F), Camp Massad (G), Camp Speers (H), Hunters Range (I), Delaware Township Volunteer Fire Department Main Station (J), Delaware Township Volunteer Fire Department Station 2 (K), National Park Service - Digmans Ferry Fire Department (L). Display/hide their locations on the map
Lakes, reservoirs, and swamps: Little Mud Pond (A), Lake Kemadobi (B), Nichecronk Pond (C), Woodpecker Lake (D), Twelvemile Pond (E), Lake Minisink (F), Camp William Penn Lake (G), Beaver Pond (H). Display/hide their locations on the map
Streams, rivers, and creeks: Pennel Run (A), Hornbecks Creek (B), Rock Hill Creek (C), Middle Branch Bush Kill (D), Spruce Run (E), Dry Brook (F), Dingmans Creek (G), Dancing Ridge Run (H), Long Meadow Brook (I). Display/hide their locations on the map
In group quarters: 32 (-1 institutionalized population)
Size of family households: 1,179 2-persons, 459 3-persons, 295 4-persons, 110 5-persons, 100 6-persons, 18 7-or-more-persons
Size of nonfamily households: 815 1-person, 301 2-persons, 33 4-persons
821 married couples with children.
377 single-parent households (136 men, 241 women).
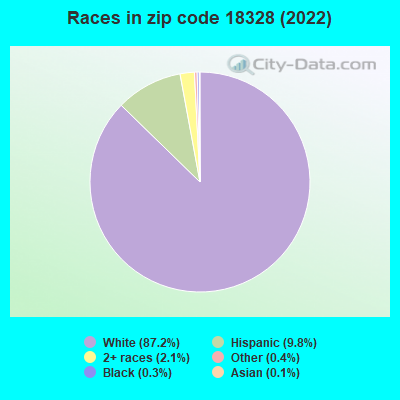
91.3% of residents of 18328 zip code speak English at home.
5.5% of residents speak Spanish at home (71% very well, 6% well, 23% not well).
2.6% of residents speak other Indo-European language at home (52% very well, 42% well, 6% not well).
0.2% of residents speak Asian or Pacific Island language at home (100% very well).
0.3% of residents speak other language at home (100% very well).
Foreign born population: 499 (6.4%) (71.7% of them are naturalized citizens)
This zip code:
6.4%
Whole state:
7.5%
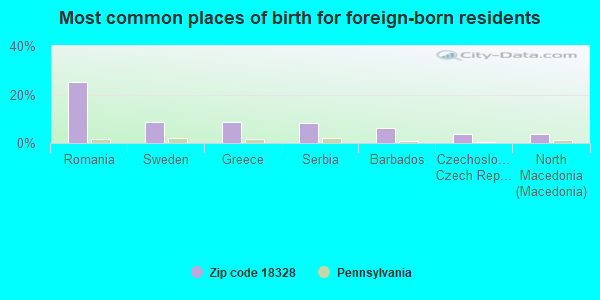
25%Romania
8%Sweden
8%Greece
8%Serbia
6%Barbados
4%Czechoslovakia (includes Czech Republic and Slovakia)
4%North Macedonia (Macedonia)
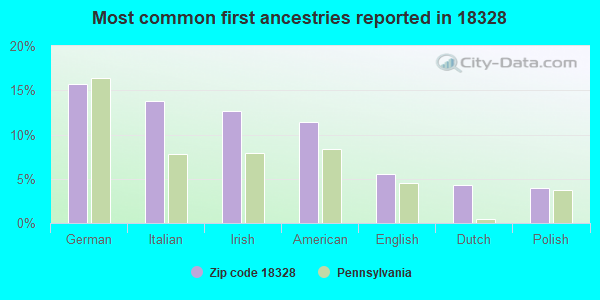
16%German
14%Italian
13%Irish
11%American
6%English
4%Dutch
4%Polish
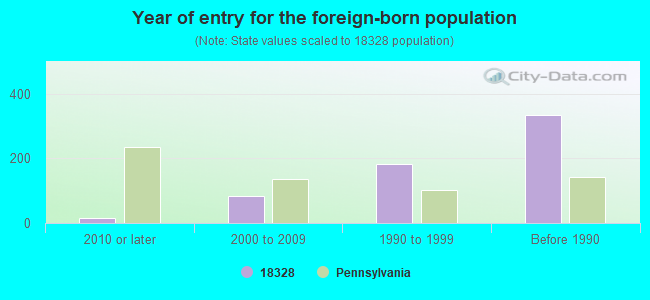
Year of entry for the foreign-born population
162010 or later
822000 to 2009
1831990 to 1999
334Before 1990
Public high school in in zip code 18328 not listed on the city page:
Small Quantity Generators, between 100 kg and 1000 kg of hazardous waste/month (Resource Conservation and Recovery Act (tracking hazardous waste)) - notification Organizations: OPERNAME (CONTACT/OPERATOR)
, JARVIS GUY (CONTACT/OWNER)
AMERICAN ENVIRONMENTAL TECHNOLOGIES (NICHECRONK RD DANIELLE TERRACE in DINGMANS FERRY, PA)
ADVANCED RECYCLING TECHNOLOGIES (RT 739 7.3 ML S OF RT 84 in DINGMANS FERRY, PA)
USED OIL PROGRAM (Resource Conservation and Recovery Act (tracking hazardous waste)) Organizations: JOHN ROBERT (CONTACT/OWNER)
Housing units lacking complete plumbing facilities: 6.4% Housing units lacking complete kitchen facilities: 3.0%
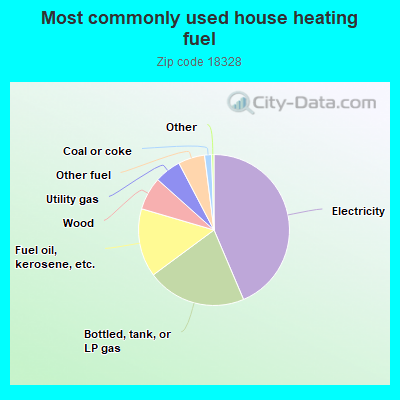
43.7%Electricity
21.3%Bottled, tank, or LP gas
14.7%Fuel oil, kerosene, etc.
7.1%Wood
5.7%Utility gas
5.7%Other fuel
1.5%Coal or coke
Population in 1990: 3,705. Population change in the 1990s: +3,031 (+81.8%).
Place of birth for U.S.-born residents:
This state: 1,404
Northeast: 5,339
Midwest: 117
South: 241
West: 155
64% of the 18328 zip code residents lived in the same house 5 years ago. Out of people who lived in different houses, 27% lived in this county. Out of people who lived in different counties, 50% lived in Pennsylvania.
95% of the 18328 zip code residents lived in the same house 1 year ago. Out of people who lived in different houses, 29% moved from this county. Out of people who lived in different houses, 10% moved from different county within same state. Out of people who lived in different houses, 69% moved from different state.
Private vs. public school enrollment:
Students in private schools in grades 1 to 8 (elementary and middle school): 22
Here:
3.2%
Pennsylvania:
15.7%
Students in private schools in grades 9 to 12 (high school): 13
Here:
4.0%
Pennsylvania:
13.4%
Students in private undergraduate colleges: 61
Here:
37.1%
Pennsylvania:
39.8%
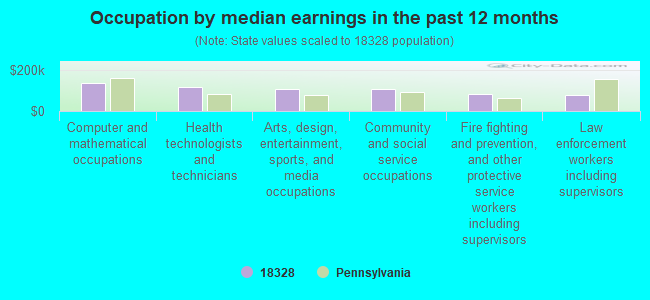
Occupation by median earnings in the past 12 months ($)
136,617Computer and mathematical occupations
118,256Health technologists and technicians
108,122Arts, design, entertainment, sports, and media occupations
108,007Community and social service occupations
81,935Fire fighting and prevention, and other protective service workers including supervisors
77,446Law enforcement workers including supervisors
Companies with federal contracts located in this zip code:
GAH SERVICE (164 DOE DRIVE in DINGMANS FERRY, PA; small business) : $349,664 in 2 contractsfrom 2004 to 2005
$179,494 with Army for Program Management/Support Services. Taking place in NJ. Signed on 2005-09-02. Completion date: 2006-11-30.
$170,170 with Army for Program Management/Support Services. Signed on 2004-09-20. Completion date: 2004-11-30.
SEQUOIA TREE INC (HC 67 BOX 271 in DINGMANS FERRY, PA; small business)
$3,600 with National Park Service for Tree Thinning Services. Signed on 2004-09-19. Completion date: 2004-09-19.
Top industries in this zip code by the number of employees in 2005:
Other Services (except Public Administration): Civic and Social Organizations (50-99 employees: 1 establishment)
Other Services (except Public Administration): Other Similar Organizations (except Business, Professional, Labor, and Political Organizations) (20-49: 1, 10-19: 1, 5-9: 1)
Educational Services: Other Technical and Trade Schools (20-49: 1)
Accommodation and Food Services: Full-Service Restaurants (10-19: 1, 1-4: 4)
Health Care and Social Assistance: Child Day Care Services (10-19: 1, 5-9: 1)
Health Care and Social Assistance: Offices of Physicians (except Mental Health Specialists) (10-19: 1, 1-4: 1)
Health Care and Social Assistance: Offices of Physical, Occupational and Speech Therapists, and Audiologists (10-19: 1)
People in group quarters in 2010:
9 people in college/university student housing
People in group quarters in 2000:
20 people in college dormitories (includes college quarters off campus)
3 people in homes for the mentally retarded
Fatal accident statistics in 2014:
Fatal accident count: 1
Vehicles involved in fatal accidents: 2
Fatal accidents caused by drunken drivers: 1
Fatalities: 1
Persons involved in fatal accidents: 3
Pedestrians involved in fatal accidents: 0
Fatal accident statistics in 2012:
Fatal accident count: 1
Vehicles involved in fatal accidents: 1
Fatal accidents caused by drunken drivers: 0
Fatalities: 1
Persons involved in fatal accidents: 1
Pedestrians involved in fatal accidents: 0
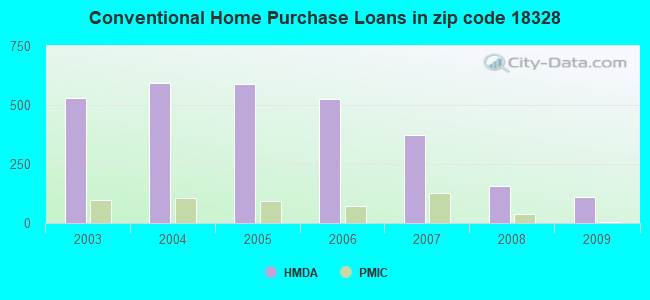
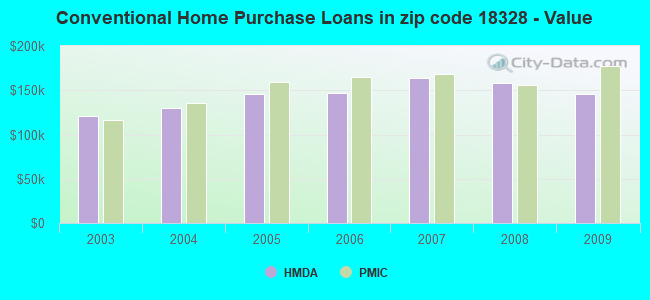
Home Mortgage Disclosure Act Aggregated Statistics For Year 2009 (Based on 4 partial tracts)
A) FHA, FSA/RHS & VA Home Purchase Loans
B) Conventional Home Purchase Loans
C) Refinancings
D) Home Improvement Loans
E) Loans on Dwellings For 5+ Families
F) Non-occupant Loans on < 5 Family Dwellings (A B C & D)
G) Loans On Manufactured Home Dwelling (A B C & D)
Number
Average Value
Number
Average Value
Number
Average Value
Number
Average Value
Number
Average Value
Number
Average Value
Number
Average Value
LOANS ORIGINATED
94
$150,508
109
$146,016
430
$157,586
43
$68,142
1
$167,120
150
$156,477
3
$37,927
APPLICATIONS APPROVED, NOT ACCEPTED
6
$113,032
11
$173,701
49
$154,106
7
$94,180
0
$0
13
$152,555
0
$0
APPLICATIONS DENIED
18
$154,159
21
$118,921
334
$165,277
33
$54,091
0
$0
43
$145,489
2
$60,270
APPLICATIONS WITHDRAWN
18
$145,327
24
$136,928
172
$174,985
6
$95,795
0
$0
31
$150,356
0
$0
FILES CLOSED FOR INCOMPLETENESS
2
$139,440
3
$137,877
33
$184,735
4
$85,625
0
$0
4
$139,480
0
$0
Aggregated Statistics For Year 2008 (Based on 4 partial tracts)
A) FHA, FSA/RHS & VA Home Purchase Loans
B) Conventional Home Purchase Loans
C) Refinancings
D) Home Improvement Loans
F) Non-occupant Loans on < 5 Family Dwellings (A B C & D)
G) Loans On Manufactured Home Dwelling (A B C & D)
Number
Average Value
Number
Average Value
Number
Average Value
Number
Average Value
Number
Average Value
Number
Average Value
LOANS ORIGINATED
74
$160,974
157
$158,394
357
$151,931
68
$55,519
105
$160,398
3
$45,963
APPLICATIONS APPROVED, NOT ACCEPTED
0
$0
10
$161,249
76
$151,121
15
$28,962
6
$133,032
0
$0
APPLICATIONS DENIED
15
$132,786
31
$163,559
441
$159,310
106
$57,210
38
$99,055
2
$63,010
APPLICATIONS WITHDRAWN
13
$183,575
17
$189,130
135
$164,748
12
$123,030
18
$172,275
0
$0
FILES CLOSED FOR INCOMPLETENESS
2
$122,985
10
$215,786
54
$146,974
3
$57,740
5
$223,176
1
$196,340
Aggregated Statistics For Year 2007 (Based on 4 partial tracts)
A) FHA, FSA/RHS & VA Home Purchase Loans
B) Conventional Home Purchase Loans
C) Refinancings
D) Home Improvement Loans
F) Non-occupant Loans on < 5 Family Dwellings (A B C & D)
G) Loans On Manufactured Home Dwelling (A B C & D)
Number
Average Value
Number
Average Value
Number
Average Value
Number
Average Value
Number
Average Value
Number
Average Value
LOANS ORIGINATED
51
$160,264
372
$163,905
521
$143,880
145
$58,277
188
$147,237
4
$67,348
APPLICATIONS APPROVED, NOT ACCEPTED
3
$92,243
62
$170,931
155
$154,141
31
$61,772
39
$181,858
4
$85,002
APPLICATIONS DENIED
11
$164,521
106
$157,260
622
$145,622
172
$67,927
46
$115,401
4
$27,962
APPLICATIONS WITHDRAWN
7
$201,183
66
$153,079
281
$162,156
34
$96,181
19
$180,729
0
$0
FILES CLOSED FOR INCOMPLETENESS
0
$0
17
$111,526
69
$174,761
5
$87,996
10
$98,661
0
$0
Aggregated Statistics For Year 2006 (Based on 4 partial tracts)
A) FHA, FSA/RHS & VA Home Purchase Loans
B) Conventional Home Purchase Loans
C) Refinancings
D) Home Improvement Loans
F) Non-occupant Loans on < 5 Family Dwellings (A B C & D)
G) Loans On Manufactured Home Dwelling (A B C & D)
Number
Average Value
Number
Average Value
Number
Average Value
Number
Average Value
Number
Average Value
Number
Average Value
LOANS ORIGINATED
68
$151,208
525
$147,258
653
$130,761
173
$56,496
186
$145,131
12
$87,143
APPLICATIONS APPROVED, NOT ACCEPTED
4
$176,798
70
$142,519
134
$123,751
29
$57,502
28
$125,868
1
$52,050
APPLICATIONS DENIED
3
$230,383
163
$127,540
577
$131,676
115
$63,959
51
$114,649
10
$82,280
APPLICATIONS WITHDRAWN
3
$129,917
70
$136,039
364
$143,853
30
$82,760
27
$150,076
2
$64,835
FILES CLOSED FOR INCOMPLETENESS
0
$0
20
$176,780
128
$156,458
3
$56,053
8
$104,139
2
$225,185
Aggregated Statistics For Year 2005 (Based on 4 partial tracts)
A) FHA, FSA/RHS & VA Home Purchase Loans
B) Conventional Home Purchase Loans
C) Refinancings
D) Home Improvement Loans
F) Non-occupant Loans on < 5 Family Dwellings (A B C & D)
G) Loans On Manufactured Home Dwelling (A B C & D)
Number
Average Value
Number
Average Value
Number
Average Value
Number
Average Value
Number
Average Value
Number
Average Value
LOANS ORIGINATED
45
$147,122
587
$146,166
806
$130,742
158
$76,495
238
$145,740
11
$86,040
APPLICATIONS APPROVED, NOT ACCEPTED
9
$154,743
79
$151,699
169
$122,080
23
$67,870
33
$134,801
1
$42,010
APPLICATIONS DENIED
7
$146,180
151
$130,598
591
$134,768
122
$83,780
51
$265,285
14
$65,893
APPLICATIONS WITHDRAWN
6
$153,522
80
$149,215
480
$139,780
49
$127,497
28
$124,279
0
$0
FILES CLOSED FOR INCOMPLETENESS
0
$0
24
$147,224
66
$127,140
6
$38,370
10
$110,574
2
$135,980
Aggregated Statistics For Year 2004 (Based on 4 partial tracts)
A) FHA, FSA/RHS & VA Home Purchase Loans
B) Conventional Home Purchase Loans
C) Refinancings
D) Home Improvement Loans
F) Non-occupant Loans on < 5 Family Dwellings (A B C & D)
G) Loans On Manufactured Home Dwelling (A B C & D)
Number
Average Value
Number
Average Value
Number
Average Value
Number
Average Value
Number
Average Value
Number
Average Value
LOANS ORIGINATED
24
$121,971
593
$130,415
754
$112,802
101
$51,918
227
$120,739
4
$61,340
APPLICATIONS APPROVED, NOT ACCEPTED
7
$123,234
68
$112,093
165
$111,367
28
$44,555
30
$104,016
1
$24,660
APPLICATIONS DENIED
16
$134,749
92
$130,397
527
$112,897
110
$37,235
47
$104,366
9
$64,124
APPLICATIONS WITHDRAWN
10
$112,900
61
$123,035
378
$117,936
22
$68,803
21
$113,650
6
$74,905
FILES CLOSED FOR INCOMPLETENESS
2
$148,970
26
$98,662
87
$118,144
10
$36,325
10
$79,529
0
$0
Aggregated Statistics For Year 2003 (Based on 4 partial tracts)
A) FHA, FSA/RHS & VA Home Purchase Loans
B) Conventional Home Purchase Loans
C) Refinancings
D) Home Improvement Loans
F) Non-occupant Loans on < 5 Family Dwellings (A B C & D)


 Nearest zip codes: 18324, 18371, 07851, 07881, 18337, 18458.


 (Students: 1,355, Location: 279 TIMBERWOLF DR, Grades: 9-12)