Estimated zip code population in 2022: 5,107 Zip code population in 2010: 5,613 Zip code population in 2000: 4,794
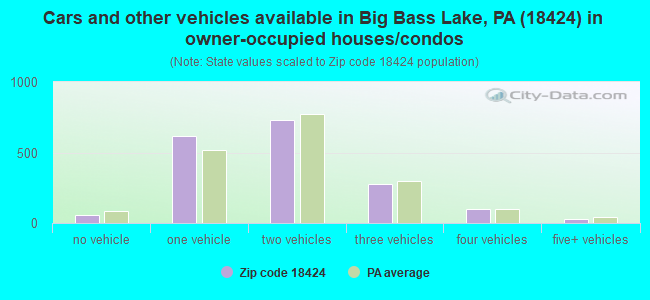
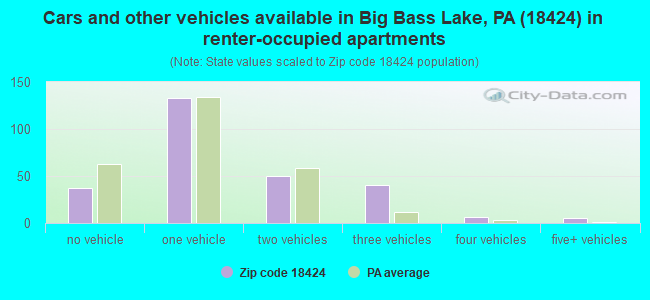
Houses and condos: 4,236 Renter-occupied apartments: 270
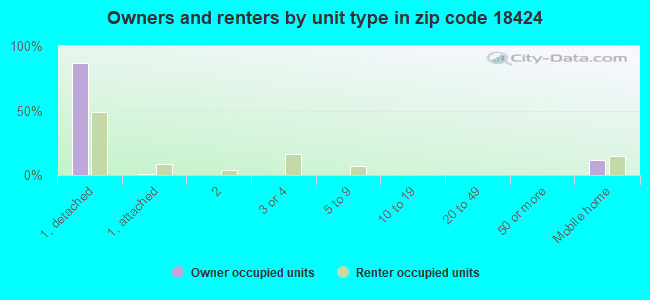
% of renters here:
13%
State:
31%
March 2022 cost of living index in zip code 18424: 92.7 (less than average, U.S. average is 100)
Land area: 82.6 sq. mi. Water area: 1.8 sq. mi.
Population density: 62 people per square mile
(very low).
OSM Map
General Map
Google Map
MSN Map
OSM Map
General Map
Google Map
MSN Map
OSM Map
General Map
Google Map
MSN Map
OSM Map
General Map
Google Map
MSN Map
Please wait while loading the map...
Real estate property taxes paid for housing units in 2022:
This zip code:
1.6% ($2,956)
Pennsylvania:
1.3% ($3,094)
Median real estate property taxes paid for housing units with mortgages in 2022: $3,299 (1.6%) Median real estate property taxes paid for housing units with no mortgage in 2022: $2,459 (1.4%)
Averages for the 2020 tax year for zip code 18424, filed in 2021:
Average Adjusted Gross Income (AGI) in 2020: $63,723 (Individual Income Tax Returns)
Here:
$63,723
State:
$75,707
Salary/wage: $55,563 (reported on 76.9% of returns)
Here:
$55,563
State:
$62,806
(% of AGI for various income ranges: 966.2% for AGIs below $25k, 3207.8% for AGIs $25k-50k, 5950.3% for AGIs $50k-75k, 8078.1% for AGIs $75k-100k, 16963.9% for AGIs $100k-200k, 53782.5% for AGIs over 200k)
Taxable interest for individuals: $1,120 (reported on 29.4% of returns)
This zip code:
$1,120
Pennsylvania:
$1,633
(% of AGI for various income ranges: 16.4% for AGIs below $25k, 19.0% for AGIs $25k-50k, 36.3% for AGIs $50k-75k, 96.7% for AGIs $75k-100k, 113.9% for AGIs $100k-200k, 372.5% for AGIs over 200k)
Ordinary dividends: $4,247 (reported on 20.3% of returns)
Here:
$4,247
State:
$7,382
(% of AGI for various income ranges: 30.7% for AGIs below $25k, 34.7% for AGIs $25k-50k, 90.3% for AGIs $50k-75k, 145.2% for AGIs $75k-100k, 281.7% for AGIs $100k-200k, 2060.0% for AGIs over 200k)
Net capital gain/loss in AGI: +$11,176 (reported on 16.1% of returns)
Here:
+$11,176
State:
+$23,522
(% of AGI for various income ranges: 8.9% for AGIs below $25k, 24.3% for AGIs $25k-50k, 88.0% for AGIs $50k-75k, 99.5% for AGIs $75k-100k, 445.2% for AGIs $100k-200k, 8525.0% for AGIs over 200k)
Profit/loss from business: +$17,879 (reported on 11.9% of returns)
Here:
+$17,879
State:
+$16,274
(% of AGI for various income ranges: 83.3% for AGIs below $25k, 131.4% for AGIs $25k-50k, 223.1% for AGIs $50k-75k, 354.3% for AGIs $75k-100k, 701.3% for AGIs $100k-200k, 4302.5% for AGIs over 200k)
Taxable individual retirement arrangement distribution: $18,010 (reported on 10.8% of returns)
18424:
$18,010
Pennsylvania:
$18,583
(% of AGI for various income ranges: 77.6% for AGIs below $25k, 109.8% for AGIs $25k-50k, 177.4% for AGIs $50k-75k, 381.0% for AGIs $75k-100k, 1347.0% for AGIs $100k-200k)
Total itemized deductions: $28,038 (reported on 5.6% of returns)
Here:
$28,038
State:
$34,850
(% of AGI for various income ranges: 92.4% for AGIs below $25k, 214.6% for AGIs $50k-75k, 401.9% for AGIs $75k-100k, 576.1% for AGIs $100k-200k, 2645.0% for AGIs over 200k)
Charity contributions: $6,577 (reported on 4.5% of returns)
Here:
$6,577
State:
$12,392
(% of AGI for various income ranges: 29.4% for AGIs $50k-75k, 81.9% for AGIs $75k-100k, 107.8% for AGIs $100k-200k, 830.0% for AGIs over 200k)
Taxes paid: $8,362 (reported on 5.6% of returns)
18424:
$8,362
State:
$8,200
(% of AGI for various income ranges: 25.5% for AGIs below $25k, 59.1% for AGIs $50k-75k, 118.6% for AGIs $75k-100k, 196.1% for AGIs $100k-200k, 727.5% for AGIs over 200k)
Earned income credit: $2,064 (reported on 11.5% of returns)
Here:
$2,064
State:
$2,100
(% of AGI for various income ranges: 65.3% for AGIs below $25k, 55.5% for AGIs $25k-50k)
Percentage of individuals using paid preparers for their 2020 taxes: 92.3%
Here:
92%
State:
92%
(% for various income ranges: 90.1% for AGIs below $25k, 93.2% for AGIs $25k-50k, 93.9% for AGIs $50k-75k, 93.5% for AGIs $75k-100k, 92.5% for AGIs $100k-200k, 91.7% for AGIs over 200k)
Averages for the 2012 tax year for zip code 18424, filed in 2013:
Average Adjusted Gross Income (AGI) in 2012: $50,240 (Individual Income Tax Returns)
Here:
$50,240
State:
$61,346
Salary/wage: $43,180 (reported on 79.0% of returns)
Here:
$43,180
State:
$51,902
(% of AGI for various income ranges: 66.1% for AGIs below $25k, 74.5% for AGIs $25k-50k, 72.2% for AGIs $50k-75k, 66.5% for AGIs $75k-100k, 67.2% for AGIs $100k-200k, 56.6% for AGIs over 200k)
Taxable interest for individuals: $1,066 (reported on 35.0% of returns)
This zip code:
$1,066
Pennsylvania:
$1,588
(% of AGI for various income ranges: 1.5% for AGIs below $25k, 0.5% for AGIs $25k-50k, 0.7% for AGIs $50k-75k, 0.8% for AGIs $75k-100k, 0.8% for AGIs $100k-200k, 0.5% for AGIs over 200k)
Ordinary dividends: $3,036 (reported on 21.8% of returns)
Here:
$3,036
State:
$5,827
(% of AGI for various income ranges: 1.9% for AGIs below $25k, 1.1% for AGIs $25k-50k, 0.9% for AGIs $50k-75k, 0.9% for AGIs $75k-100k, 1.7% for AGIs $100k-200k, 1.6% for AGIs over 200k)
Net capital gain/loss in AGI: +$2,176 (reported on 14.0% of returns)
Here:
+$2,176
State:
+$14,495
(% of AGI for various income ranges: 0.5% for AGIs below $25k, 0.2% for AGIs $75k-100k, 0.2% for AGIs $100k-200k, 4.3% for AGIs over 200k)
Profit/loss from business: +$12,452 (reported on 11.9% of returns)
Here:
+$12,452
State:
+$16,268
(% of AGI for various income ranges: 5.0% for AGIs below $25k, 2.2% for AGIs $25k-50k, 2.0% for AGIs $50k-75k, 2.6% for AGIs $75k-100k, 5.2% for AGIs $100k-200k)
Taxable individual retirement arrangement distribution: $14,755 (reported on 12.8% of returns)
18424:
$14,755
Pennsylvania:
$14,550
(% of AGI for various income ranges: 4.1% for AGIs below $25k, 2.6% for AGIs $25k-50k, 2.9% for AGIs $50k-75k, 5.2% for AGIs $75k-100k, 5.9% for AGIs $100k-200k)
Total itemized deductions: $20,008 (22% of AGI, reported on 31.3% of returns)
Here:
$20,008
State:
$23,538
Here:
22.4% of AGI
State:
18.4% of AGI
(% of AGI for various income ranges: 10.1% for AGIs below $25k, 10.2% for AGIs $25k-50k, 11.8% for AGIs $50k-75k, 13.0% for AGIs $75k-100k, 13.9% for AGIs $100k-200k, 14.9% for AGIs over 200k)
Charity contributions: $2,574 (reported on 23.5% of returns)
Here:
$2,574
State:
$4,025
(% of AGI for various income ranges: 0.6% for AGIs below $25k, 0.7% for AGIs $25k-50k, 1.1% for AGIs $50k-75k, 1.1% for AGIs $75k-100k, 1.2% for AGIs $100k-200k, 2.6% for AGIs over 200k)
Taxes paid: $7,566 (reported on 31.3% of returns)
18424:
$7,566
State:
$9,982
(% of AGI for various income ranges: 3.2% for AGIs below $25k, 3.4% for AGIs $25k-50k, 4.2% for AGIs $50k-75k, 5.3% for AGIs $75k-100k, 5.8% for AGIs $100k-200k, 5.6% for AGIs over 200k)
Earned income credit: $2,114 (reported on 15.2% of returns)
Here:
$2,114
State:
$2,106
(% of AGI for various income ranges: 4.7% for AGIs below $25k, 1.2% for AGIs $25k-50k)
Percentage of individuals using paid preparers for their 2012 taxes: 53.9%
Here:
54%
State:
53%
(% for various income ranges: 46.9% for AGIs below $25k, 53.6% for AGIs $25k-50k, 57.5% for AGIs $50k-75k, 62.5% for AGIs $75k-100k, 65.2% for AGIs $100k-200k, 75.0% for AGIs over 200k)
Averages for the 2004 tax year for zip code 18424, filed in 2005:
Average Adjusted Gross Income (AGI) in 2004: $39,834 (Individual Income Tax Returns)
Here:
$39,834
State:
$48,049
Salary/wage: $35,813 (reported on 81.3% of returns)
Here:
$35,813
State:
$42,646
(% of AGI for various income ranges: 110.8% for AGIs below $10k, 68.1% for AGIs $10k-25k, 74.8% for AGIs $25k-50k, 76.6% for AGIs $50k-75k, 76.9% for AGIs $75k-100k, 65.4% for AGIs over 100k)
Taxable interest for individuals: $991 (reported on 49.0% of returns)
This zip code:
$991
Pennsylvania:
$1,657
(% of AGI for various income ranges: 7.0% for AGIs below $10k, 1.8% for AGIs $10k-25k, 0.9% for AGIs $25k-50k, 0.9% for AGIs $50k-75k, 1.0% for AGIs $75k-100k, 1.3% for AGIs over 100k)
Taxable dividends: $1,614 (reported on 26.7% of returns)
Here:
$1,614
State:
$3,566
(% of AGI for various income ranges: 4.9% for AGIs below $10k, 1.4% for AGIs $10k-25k, 0.7% for AGIs $25k-50k, 1.0% for AGIs $50k-75k, 1.1% for AGIs $75k-100k, 1.2% for AGIs over 100k)
Net capital gain/loss: +$4,629 (reported on 17.7% of returns)
Here:
+$4,629
State:
+$9,716
(% of AGI for various income ranges: -3.3% for AGIs below $10k, 0.8% for AGIs $10k-25k, -0.1% for AGIs $25k-50k, 0.3% for AGIs $50k-75k, 1.9% for AGIs $75k-100k, 6.5% for AGIs over 100k)
Profit/loss from business: +$14,348 (reported on 14.2% of returns)
Here:
+$14,348
State:
+$14,267
(% of AGI for various income ranges: -0.2% for AGIs below $10k, 5.8% for AGIs $10k-25k, 3.8% for AGIs $25k-50k, 4.3% for AGIs $50k-75k, 3.1% for AGIs $75k-100k, 8.5% for AGIs over 100k)
IRA payment deduction: $2,767 (reported on 2.9% of returns)
18424:
$2,767
Pennsylvania:
$2,903
(% of AGI for various income ranges: 0.4% for AGIs $10k-25k, 0.2% for AGIs $25k-50k, 0.3% for AGIs $50k-75k, 0.1% for AGIs over 100k)
Total itemized deductions: $16,277 (23% of AGI, reported on 31.2% of returns)
Here:
$16,277
State:
$18,804
Here:
22.8% of AGI
State:
19.5% of AGI
(% of AGI for various income ranges: 15.3% for AGIs below $10k, 8.0% for AGIs $10k-25k, 11.6% for AGIs $25k-50k, 13.1% for AGIs $50k-75k, 14.6% for AGIs $75k-100k, 14.0% for AGIs over 100k)
Charity contributions deductions: $1,900 (3% of AGI, reported on 26.9% of returns)
Here:
$1,900
State:
$3,337
Here:
2.5% of AGI
State:
3.3% of AGI
(% of AGI for various income ranges: 1.1% for AGIs below $10k, 0.5% for AGIs $10k-25k, 1.0% for AGIs $25k-50k, 1.3% for AGIs $50k-75k, 1.6% for AGIs $75k-100k, 1.7% for AGIs over 100k)
Total tax: $5,359 (reported on 75.7% of returns)
18424:
$5,359
State:
$8,008
(% of AGI for various income ranges: 3.3% for AGIs below $10k, 4.5% for AGIs $10k-25k, 7.0% for AGIs $25k-50k, 9.0% for AGIs $50k-75k, 10.3% for AGIs $75k-100k, 17.0% for AGIs over 100k)
Earned income credit: $1,564 (reported on 12.1% of returns)
Here:
$1,564
State:
$1,643
Percentage of individuals using paid preparers for their 2004 taxes: 57.6%
Here:
58%
State:
56%
(% for various income ranges: 48.9% for AGIs below $10k, 58.2% for AGIs $10k-25k, 58.1% for AGIs $25k-50k, 61.6% for AGIs $50k-75k, 62.5% for AGIs $75k-100k, 66.9% for AGIs over 100k)
Likely homosexual households (counted as self-reported same-sex unmarried-partner households)
Lesbian couples: 0.1% of all households
Gay men: 0.0% of all households
Household received Food Stamps/SNAP in the past 12 months: 354 Household did not receive Food Stamps/SNAP in the past 12 months: 1,726
Women who had a birth in the past 12 months: 32 (28 now married, 5 unmarried) Women who did not have a birth in the past 12 months: 1,031 (440 now married, 589 unmarried)
Housing units in zip code 18424 with a mortgage: 935 (97 second mortgage, 85 both second mortgage and home equity loan) Houses without a mortgage: 140
Median monthly owner costs for units with a mortgage: $1,417 Median monthly owner costs for units without a mortgage: $635
Residents with income below the poverty level in 2022:
This zip code:
12.4%
Whole state:
11.8%
Residents with income below 50% of the poverty level in 2022:
This zip code:
9.1%
Whole state:
6.1%
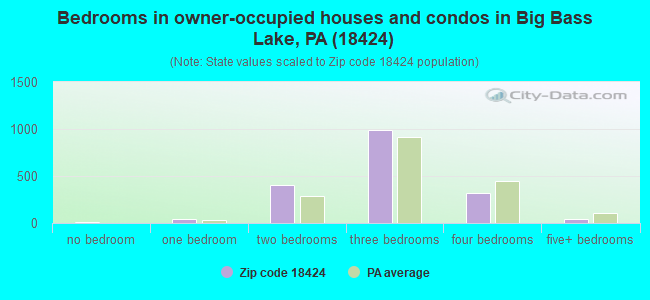
Median number of rooms in houses and condos:
Here:
6.2
State:
6.8
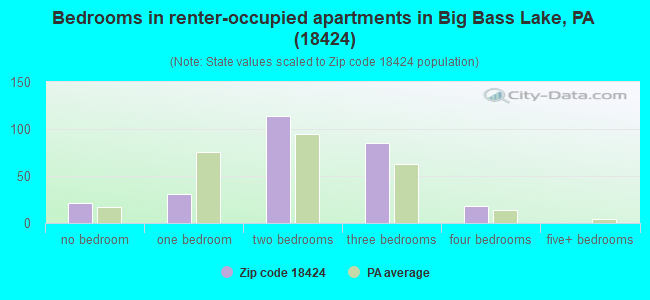
Median number of rooms in apartments:
Here:
4.4
State:
4.3
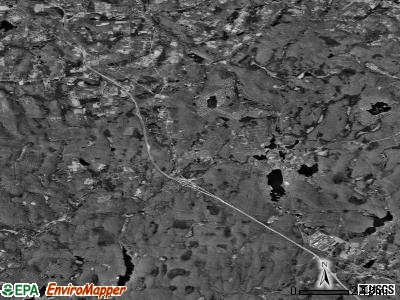
Notable locations in this zip code not listed on our city pages
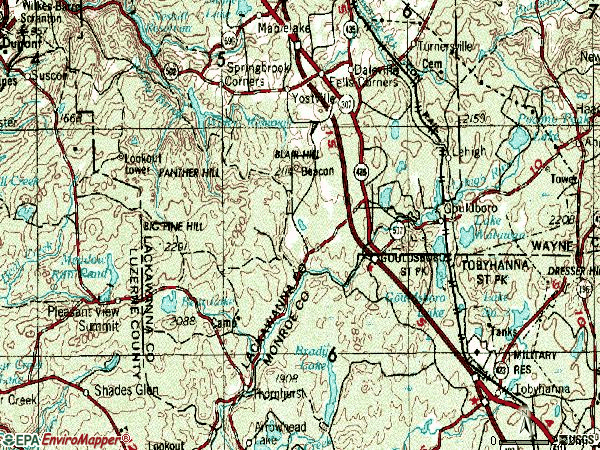
Notable locations in zip code 18424: Big Pine Hill View (A), Drums (B), Bradys Switch (C), Thornhurst Volunteer Fire and Rescue Company Station 54 (D), Gouldsboro Volunteer Fire Department Station 55 (E). Display/hide their locations on the map
Lakes, reservoirs, and swamps: Grassy Pond (A), Lehigh Pond (B), Kasulaitis Lake (C), Lake Champagne (D), Nines Pond (E), Larsen Lake (F), Bear Lake (G), Tobyhanna Lake (H). Display/hide their locations on the map
Streams, rivers, and creeks: West Fork Lehigh River (A), Rucks Run (B), Tripup Run (C), Tamarack Creek (D), Hagen Run (E), Fritz Run (F), Frame Cabin Run (G), Meadow Brook (H), Fenner Mill Run (I). Display/hide their locations on the map
In group quarters: 11 (-1 institutionalized population)
Size of family households: 695 2-persons, 284 3-persons, 176 4-persons, 166 5-persons, 24 6-persons, 4 7-or-more-persons
Size of nonfamily households: 589 1-person, 138 2-persons, 1 5-persons
590 married couples with children.
172 single-parent households (46 men, 126 women).
95.6% of residents of 18424 zip code speak English at home.
2.1% of residents speak Spanish at home (92% very well, 3% well, 5% not at all).
1.7% of residents speak other Indo-European language at home (70% very well, 5% well, 25% not well).
0.1% of residents speak Asian or Pacific Island language at home (100% very well).
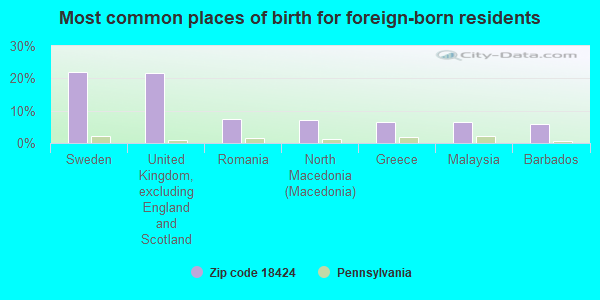
Foreign born population: 174 (3.4%) (85.5% of them are naturalized citizens)
This zip code:
3.4%
Whole state:
7.5%
22%Sweden
22%United Kingdom, excluding England and Scotland
8%Romania
7%North Macedonia (Macedonia)
6%Greece
6%Malaysia
6%Barbados
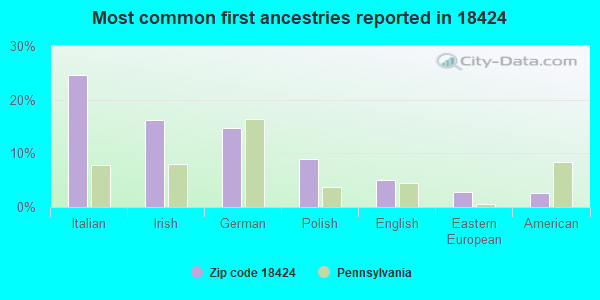
25%Italian
16%Irish
15%German
9%Polish
5%English
3%Eastern European
3%American
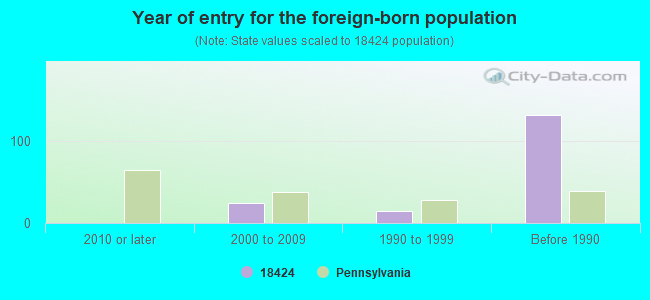
Year of entry for the foreign-born population
02010 or later
242000 to 2009
151990 to 1999
132Before 1990
Facilities with environmental interests located in this zip code:
ACKERMAN TRUCKING CO/JOHN (RR 1 BOX 565 in GOULDSBORO, PA)
Housing units lacking complete plumbing facilities: 2.6% Housing units lacking complete kitchen facilities: 1.4%
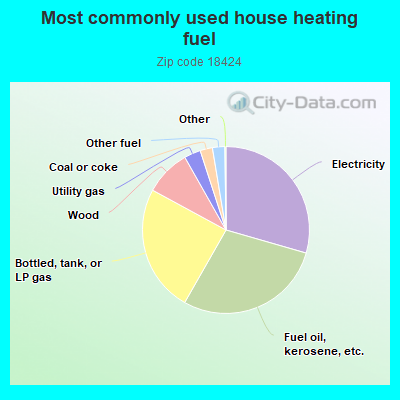
29.5%Electricity
28.8%Fuel oil, kerosene, etc.
24.7%Bottled, tank, or LP gas
8.9%Wood
3.2%Utility gas
2.4%Coal or coke
2.4%Other fuel
Population in 1990: 2,805. Population change in the 1990s: +1,989 (+70.9%).
Place of birth for U.S.-born residents:
This state: 2,820
Northeast: 1,791
Midwest: 80
South: 170
West: 84
64% of the 18424 zip code residents lived in the same house 5 years ago. Out of people who lived in different houses, 35% lived in this county. Out of people who lived in different counties, 50% lived in Pennsylvania.
94% of the 18424 zip code residents lived in the same house 1 year ago. Out of people who lived in different houses, 23% moved from this county. Out of people who lived in different houses, 45% moved from different county within same state. Out of people who lived in different houses, 35% moved from different state.
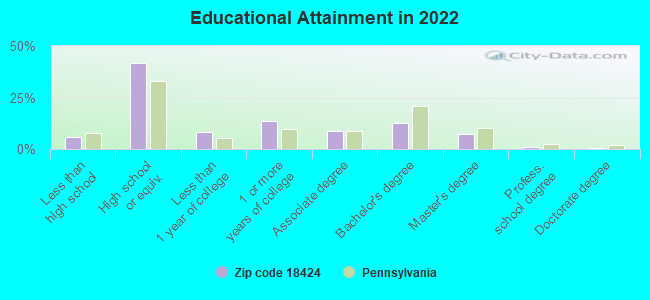
Private vs. public school enrollment:
Students in private schools in grades 1 to 8 (elementary and middle school): 17
Here:
3.5%
Pennsylvania:
15.7%
Students in private schools in grades 9 to 12 (high school): 10
Here:
3.8%
Pennsylvania:
13.4%
Students in private undergraduate colleges: 49
Here:
40.3%
Pennsylvania:
39.8%
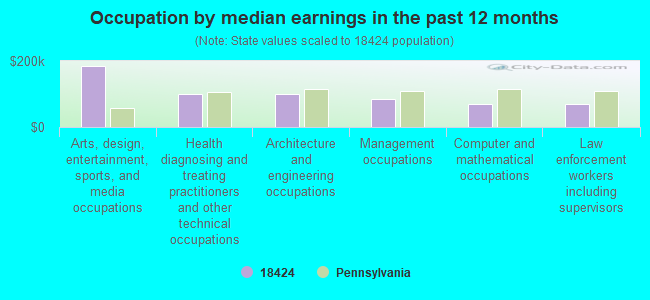
Occupation by median earnings in the past 12 months ($)
185,804Arts, design, entertainment, sports, and media occupations
101,031Health diagnosing and treating practitioners and other technical occupations
100,303Architecture and engineering occupations
84,783Management occupations
70,919Computer and mathematical occupations
69,139Law enforcement workers including supervisors
Companies with federal contracts located in this zip code:
KNIGHT WELL DRILLING, INC (ROUTE 507 in GOULDSBORO, PA; small business) : $21,709 in 3 contractsfrom 2000 to 2006
$11,616 with Army for Maintenance, Repair or Alteration of Real Property -- Miscellaneous Buildings. Signed on 2000-03-20. Completion date: 2000-05-12.
$5,400 with Army for Well Drilling/Exploratory Services. Signed on 2005-06-06. Completion date: 2005-06-30.
$4,693, same as above.Signed on 2006-04-03. Completion date: 2006-04-28.
GOULDSBORO WAYNE PEAT HUMUS CO (RR1 in GOULDSBORO, PA; small business)
$4,248 with Army for Fertilizers. Signed on 2003-05-13. Completion date: 2003-06-13.
Top industries in this zip code by the number of employees in 2005:
Health Care and Social Assistance: Residential Mental Retardation Facilities (100-249 employees: 1 establishment, 5-9 employees: 1 establishment)
Other Services (except Public Administration): Other Similar Organizations (except Business, Professional, Labor, and Political Organizations) (20-49: 2, 5-9: 1)
Accommodation and Food Services: Full-Service Restaurants (10-19: 2, 1-4: 3)
Professional, Scientific, and Technical Services: Administrative Management and General Management Consulting Services (20-49: 1, 1-4: 1)
Wholesale Trade: Men's and Boys' Clothing and Furnishings Merchant Wholesalers (20-49: 1)
Construction: Water and Sewer Line and Related Structures Construction (10-19: 2)
Construction: Highway, Street, and Bridge Construction (10-19: 1, 1-4: 2)
Administrative and Support and Waste Management and Remediation Services: Office Administrative Services (10-19: 1, 1-4: 1)
Fatal accident statistics in 2014:
Fatal accident count: 2
Vehicles involved in fatal accidents: 4
Fatal accidents caused by drunken drivers: 0
Fatalities: 3
Persons involved in fatal accidents: 6
Pedestrians involved in fatal accidents: 0
Fatal accident statistics in 2013:
Fatal accident count: 2
Vehicles involved in fatal accidents: 3
Fatal accidents caused by drunken drivers: 1
Fatalities: 2
Persons involved in fatal accidents: 4
Pedestrians involved in fatal accidents: 0
Home Mortgage Disclosure Act Aggregated Statistics For Year 2009 (Based on 2 partial tracts)
A) FHA, FSA/RHS & VA Home Purchase Loans
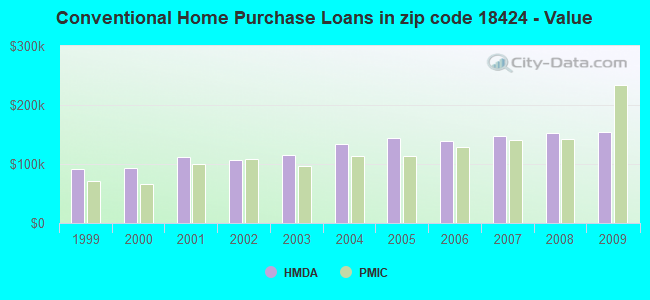
B) Conventional Home Purchase Loans
C) Refinancings
D) Home Improvement Loans
F) Non-occupant Loans on < 5 Family Dwellings (A B C & D)
G) Loans On Manufactured Home Dwelling (A B C & D)
Number
Average Value
Number
Average Value
Number
Average Value
Number
Average Value
Number
Average Value
Number
Average Value
LOANS ORIGINATED
23
$147,559
58
$153,430
215
$155,976
24
$52,596
55
$149,776
3
$113,897
APPLICATIONS APPROVED, NOT ACCEPTED
0
$0
1
$321,330
11
$121,273
3
$18,590
2
$118,175
0
$0
APPLICATIONS DENIED
3
$137,207
15
$166,653
73
$165,023
16
$74,633
17
$176,779
8
$67,608
APPLICATIONS WITHDRAWN
2
$122,160
4
$171,508
35
$153,519
4
$76,790
8
$149,156
1
$84,090
FILES CLOSED FOR INCOMPLETENESS
1
$147,830
2
$100,470
16
$206,860
0
$0
4
$203,152
0
$0
Aggregated Statistics For Year 2008 (Based on 2 partial tracts)
A) FHA, FSA/RHS & VA Home Purchase Loans
B) Conventional Home Purchase Loans
C) Refinancings
D) Home Improvement Loans
F) Non-occupant Loans on < 5 Family Dwellings (A B C & D)
G) Loans On Manufactured Home Dwelling (A B C & D)
Number
Average Value
Number
Average Value
Number
Average Value
Number
Average Value
Number
Average Value
Number
Average Value
LOANS ORIGINATED
10
$169,250
60
$152,520
112
$149,101
39
$45,758
35
$167,632
2
$81,880
APPLICATIONS APPROVED, NOT ACCEPTED
1
$197,400
10
$144,996
27
$140,353
3
$28,030
8
$120,830
1
$15,050
APPLICATIONS DENIED
2
$190,320
19
$111,815
114
$144,893
35
$51,114
12
$133,370
8
$50,456
APPLICATIONS WITHDRAWN
1
$114,190
4
$180,138
43
$154,540
2
$150,040
4
$209,128
1
$70,820
FILES CLOSED FOR INCOMPLETENESS
1
$89,410
3
$159,927
2
$115,520
1
$203,600
3
$134,847
0
$0
Aggregated Statistics For Year 2007 (Based on 2 partial tracts)
A) FHA, FSA/RHS & VA Home Purchase Loans
B) Conventional Home Purchase Loans
C) Refinancings
D) Home Improvement Loans
F) Non-occupant Loans on < 5 Family Dwellings (A B C & D)
G) Loans On Manufactured Home Dwelling (A B C & D)
Number
Average Value
Number
Average Value
Number
Average Value
Number
Average Value
Number
Average Value
Number
Average Value
LOANS ORIGINATED
5
$182,706
108
$147,533
149
$130,992
47
$52,999
56
$144,683
5
$93,832
APPLICATIONS APPROVED, NOT ACCEPTED
0
$0
15
$172,437
27
$160,483
5
$34,522
10
$115,519
1
$29,210
APPLICATIONS DENIED
0
$0
27
$138,059
100
$148,537
32
$54,523
14
$160,158
5
$105,870
APPLICATIONS WITHDRAWN
3
$103,273
13
$131,827
42
$166,186
6
$68,603
7
$137,586
0
$0
FILES CLOSED FOR INCOMPLETENESS
0
$0
4
$107,995
14
$140,747
0
$0
1
$83,210
0
$0
Aggregated Statistics For Year 2006 (Based on 2 partial tracts)
A) FHA, FSA/RHS & VA Home Purchase Loans
B) Conventional Home Purchase Loans
C) Refinancings
D) Home Improvement Loans
F) Non-occupant Loans on < 5 Family Dwellings (A B C & D)
G) Loans On Manufactured Home Dwelling (A B C & D)
Number
Average Value
Number
Average Value
Number
Average Value
Number
Average Value
Number
Average Value
Number
Average Value
LOANS ORIGINATED
6
$177,040
173
$138,669
182
$119,410
37
$49,236
89
$141,910
15
$38,713
APPLICATIONS APPROVED, NOT ACCEPTED
0
$0
13
$84,979
26
$135,129
6
$48,687
9
$133,666
2
$65,945
APPLICATIONS DENIED
1
$62,850
23
$115,422
106
$128,287
40
$47,380
13
$131,827
7
$38,696
APPLICATIONS WITHDRAWN
2
$123,045
25
$135,294
54
$132,878
7
$68,160
6
$107,847
4
$44,925
FILES CLOSED FOR INCOMPLETENESS
0
$0
4
$175,490
30
$138,622
2
$88,520
3
$155,797
1
$70,820
Aggregated Statistics For Year 2005 (Based on 2 partial tracts)
A) FHA, FSA/RHS & VA Home Purchase Loans
B) Conventional Home Purchase Loans
C) Refinancings
D) Home Improvement Loans
F) Non-occupant Loans on < 5 Family Dwellings (A B C & D)
G) Loans On Manufactured Home Dwelling (A B C & D)
Number
Average Value
Number
Average Value
Number
Average Value
Number
Average Value
Number
Average Value
Number
Average Value
LOANS ORIGINATED
5
$134,020
185
$143,953
212
$109,598
50
$40,737
77
$129,722
7
$60,573
APPLICATIONS APPROVED, NOT ACCEPTED
0
$0
14
$187,220
35
$113,027
9
$32,064
10
$119,591
4
$32,752
APPLICATIONS DENIED
1
$69,050
21
$99,775
126
$110,762
32
$89,571
9
$84,094
5
$69,576
APPLICATIONS WITHDRAWN
1
$131,010
32
$114,384
93
$135,226
8
$59,751
19
$115,309
1
$57,540
FILES CLOSED FOR INCOMPLETENESS
0
$0
3
$123,043
11
$138,655
0
$0
1
$106,220
0
$0
Aggregated Statistics For Year 2004 (Based on 2 partial tracts)
A) FHA, FSA/RHS & VA Home Purchase Loans
B) Conventional Home Purchase Loans
C) Refinancings
D) Home Improvement Loans
E) Loans on Dwellings For 5+ Families
F) Non-occupant Loans on < 5 Family Dwellings (A B C & D)
G) Loans On Manufactured Home Dwelling (A B C & D)
Number
Average Value
Number
Average Value
Number
Average Value
Number
Average Value
Number
Average Value
Number
Average Value
Number
Average Value
LOANS ORIGINATED
9
$113,601
180
$134,742
189
$101,006
46
$55,671
1
$186,780
77
$120,088
2
$111,535
APPLICATIONS APPROVED, NOT ACCEPTED
0
$0
19
$130,031
32
$112,227
4
$75,905
0
$0
4
$106,668
1
$44,260
APPLICATIONS DENIED
3
$99,733
25
$130,549
83
$91,410
17
$21,869
0
$0
11
$86,911
5
$40,896
APPLICATIONS WITHDRAWN
0
$0
18
$159,041
69
$111,099
1
$24,790
0
$0
4
$149,820
0
$0
FILES CLOSED FOR INCOMPLETENESS
0
$0
6
$95,453
13
$108,335
2
$48,685
0
$0
1
$115,960
0
$0
Aggregated Statistics For Year 2003 (Based on 2 partial tracts)
A) FHA, FSA/RHS & VA Home Purchase Loans
B) Conventional Home Purchase Loans
C) Refinancings
D) Home Improvement Loans
F) Non-occupant Loans on < 5 Family Dwellings (A B C & D)
Number
Average Value
Number
Average Value
Number
Average Value
Number
Average Value
Number
Average Value
LOANS ORIGINATED
6
$111,535
140
$114,886
328
$98,989
31
$37,978
87
$107,547
APPLICATIONS APPROVED, NOT ACCEPTED
1
$60,190
11
$112,179
35
$97,372
3
$20,360
7
$113,053
APPLICATIONS DENIED
1
$92,950
23
$95,756
104
$87,618
21
$27,652
6
$80,110
APPLICATIONS WITHDRAWN
2
$91,175
14
$110,334
74
$109,801
4
$25,670
11
$111,857
FILES CLOSED FOR INCOMPLETENESS
0
$0
3
$66,980
17
$111,795
2
$69,930
2
$27,440
Aggregated Statistics For Year 2002 (Based on 2 partial tracts)
A) FHA, FSA/RHS & VA Home Purchase Loans
B) Conventional Home Purchase Loans
C) Refinancings
D) Home Improvement Loans
F) Non-occupant Loans on < 5 Family Dwellings (A B C & D)
Number
Average Value
Number
Average Value
Number
Average Value
Number
Average Value
Number
Average Value
LOANS ORIGINATED
19
$80,646
117
$106,406
232
$103,137
36
$45,834
66
$111,401
APPLICATIONS APPROVED, NOT ACCEPTED
1
$185,890
15
$90,881
35
$105,870
4
$91,175
9
$97,176
APPLICATIONS DENIED
0
$0
30
$84,035
76
$89,941
11
$82,806
5
$141,278
APPLICATIONS WITHDRAWN
2
$117,730
13
$78,783
57
$95,835
4
$24,565
2
$73,915
FILES CLOSED FOR INCOMPLETENESS
0
$0
2
$111,095
9
$97,273
1
$199,170
1
$35,410
Aggregated Statistics For Year 2001 (Based on 2 partial tracts)
A) FHA, FSA/RHS & VA Home Purchase Loans
B) Conventional Home Purchase Loans
C) Refinancings
D) Home Improvement Loans
F) Non-occupant Loans on < 5 Family Dwellings (A B C & D)
Number
Average Value
Number
Average Value
Number
Average Value
Number
Average Value
Number
Average Value
LOANS ORIGINATED
11
$63,815
104
$112,259
161
$83,412
41
$24,937
38
$73,914
APPLICATIONS APPROVED, NOT ACCEPTED
0
$0
14
$69,994
34
$61,990
10
$24,166
6
$80,848
APPLICATIONS DENIED
0
$0
23
$54,921
90
$74,524
19
$17,797
4
$95,160
APPLICATIONS WITHDRAWN
0
$0
10
$82,412
62
$78,783
2
$30,540
2
$44,260
FILES CLOSED FOR INCOMPLETENESS
0
$0
2
$34,080
4
$95,602
2
$13,280
0
$0
Aggregated Statistics For Year 2000 (Based on 2 partial tracts)
A) FHA, FSA/RHS & VA Home Purchase Loans
B) Conventional Home Purchase Loans
C) Refinancings
D) Home Improvement Loans
F) Non-occupant Loans on < 5 Family Dwellings (A B C & D)
Number
Average Value
Number
Average Value
Number
Average Value
Number
Average Value
Number
Average Value
LOANS ORIGINATED
7
$85,486
112
$92,701
77
$77,150
43
$28,903
35
$78,302
APPLICATIONS APPROVED, NOT ACCEPTED
1
$43,370
12
$51,711
24
$55,694
12
$23,532
2
$64,620
APPLICATIONS DENIED
2
$63,290
25
$49,784
60
$65,239
25
$22,555
3
$54,883
APPLICATIONS WITHDRAWN
1
$107,990
6
$71,997
51
$57,225
6
$25,670
4
$88,298
FILES CLOSED FOR INCOMPLETENESS
0
$0
2
$106,225
4
$47,358
1
$35,410
1
$132,780
Aggregated Statistics For Year 1999 (Based on 1 partial tract)
A) FHA, FSA/RHS & VA Home Purchase Loans
B) Conventional Home Purchase Loans
C) Refinancings
D) Home Improvement Loans
F) Non-occupant Loans on < 5 Family Dwellings (A B C & D)
Detailed PMIC statistics for the following Tracts:1129.00
2008 - 2018 National Fire Incident Reporting System (NFIRS) incidents
Based on the data from the years 2008 - 2018 the average number of fire incidents per year is 15. The highest number of fires - 25 took place in 2016, and the least - 4 in 2013. The data has a decreasing trend.
When looking into fire subcategories, the most incidents belonged to: Structure Fires (54.0%), and Outside Fires (28.6%).
Fire incident types reported to NFIRS in Zip Code 18424


 Nearest zip codes: 18347, 18444, 18350, 18466, 18346, 18610.
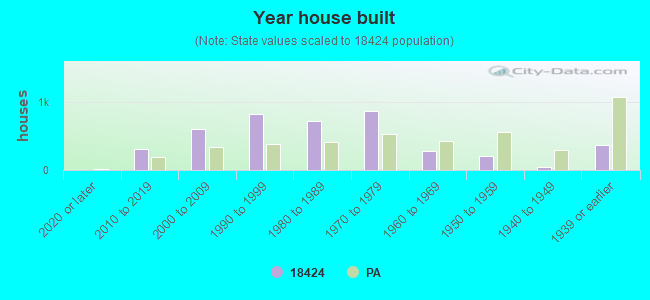


 Based on the data from the years 2008 - 2018 the average number of fire incidents per year is 15. The highest number of fires - 25 took place in 2016, and the least - 4 in 2013. The data has a decreasing trend.
 When looking into fire subcategories, the most incidents belonged to: Structure Fires (54.0%), and Outside Fires (28.6%).