Estimated zip code population in 2022: 10,261 Zip code population in 2010: 10,548 Zip code population in 2000: 9,803
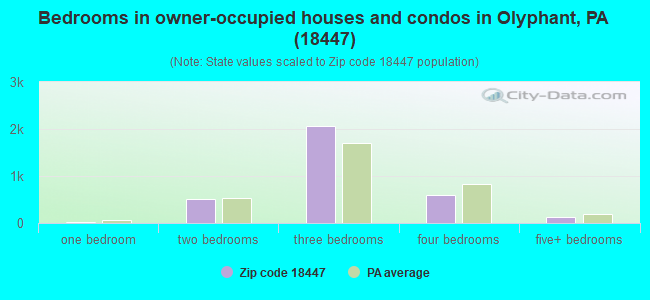
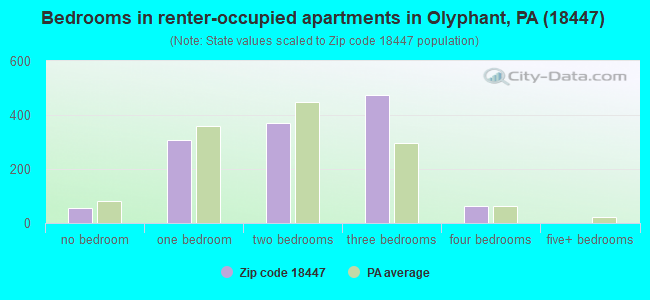
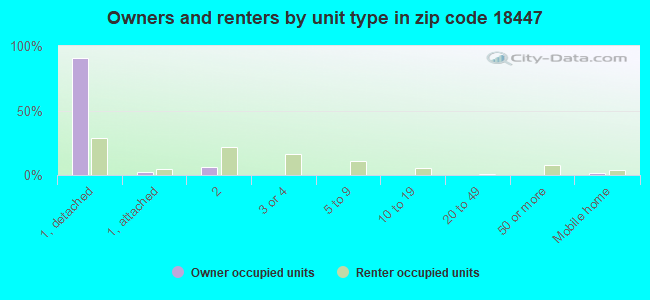
Houses and condos: 4,982 Renter-occupied apartments: 1,281
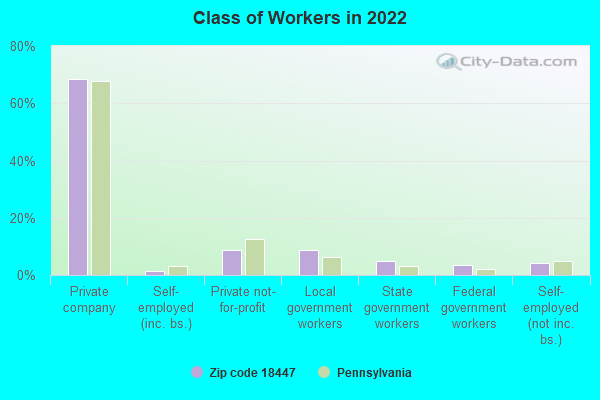
% of renters here:
28%
State:
31%
March 2022 cost of living index in zip code 18447: 94.1 (less than average, U.S. average is 100)
Land area: 20.5 sq. mi. Water area: 0.0 sq. mi.
Population density: 500 people per square mile
(low).
OSM Map
General Map
Google Map
MSN Map
OSM Map
General Map
Google Map
MSN Map
OSM Map
General Map
Google Map
MSN Map
OSM Map
General Map
Google Map
MSN Map
Please wait while loading the map...
Real estate property taxes paid for housing units in 2022:
This zip code:
1.2% ($2,179)
Pennsylvania:
1.3% ($3,094)
Median real estate property taxes paid for housing units with mortgages in 2022: $2,291 (1.2%) Median real estate property taxes paid for housing units with no mortgage in 2022: $2,123 (1.2%)
Business Search- 14 Million verified businesses
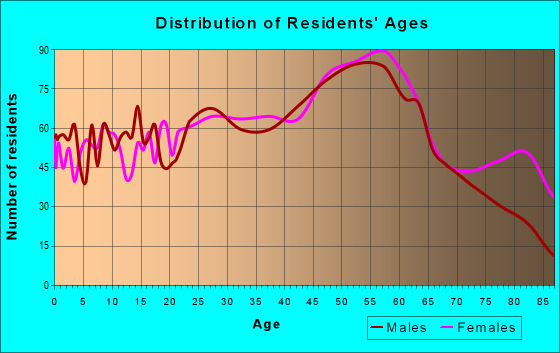
Males: 5,158
(50.3%)
Females: 5,103
(49.7%)
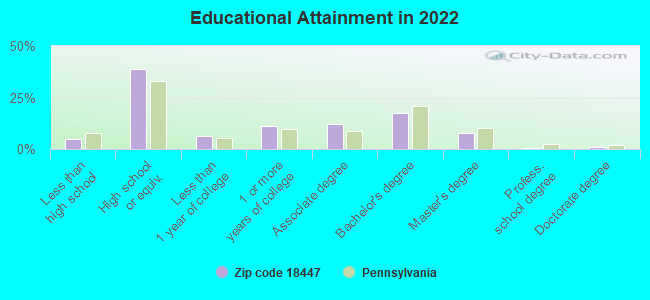
For population 25 years and over in 18447:
High school or higher: 94.9%
Bachelor's degree or higher: 26.8%
Graduate or professional degree: 9.4%
Unemployed: 2.2%
Mean travel time to work (commute): 21.3 minutes
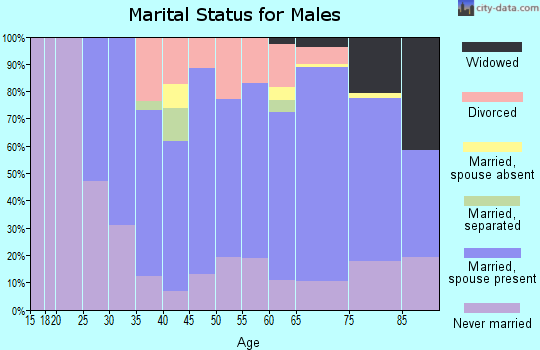
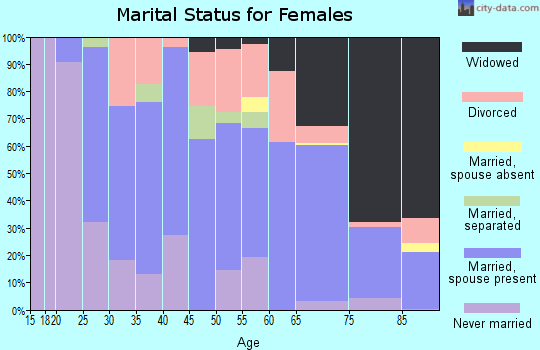
For population 15 years and over in 18447:
Never married: 33.5%
Now married: 46.6%
Separated: 1.1%
Widowed: 7.9%
Divorced: 10.9%
Zip code 18447 compared to state average:
Unemployed percentage below state average.
Black race population percentage significantly below state average.
Foreign-born population percentage significantly below state average.
Length of stay since moving in significantly above state average.
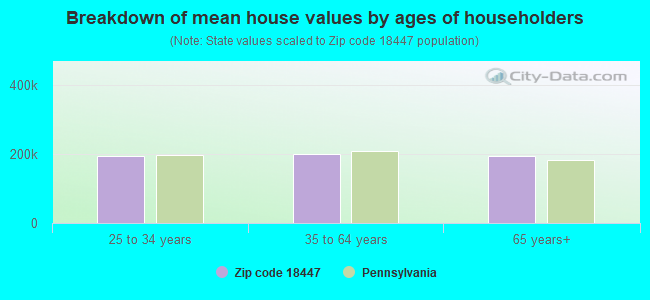
Estimated median house/condo value in 2022: $181,357
18447:
$181,357
Pennsylvania:
$245,500
According to our research of Pennsylvania and other state lists, there were 11 registered sex offenders living in 18447 zip code as of May 21, 2024. The ratio of all residents to sex offenders in zip code 18447 is 991 to 1. The ratio of registered sex offenders to all residents in this zip code is lower than the state average.
Median resident age:
This zip code:
44.6 years
Pennsylvania median age:
40.9 years
Average household size:
This zip code:
2.2 people
Pennsylvania:
2.4 people
Averages for the 2020 tax year for zip code 18447, filed in 2021:
Average Adjusted Gross Income (AGI) in 2020: $55,416 (Individual Income Tax Returns)
Here:
$55,416
State:
$75,707
Salary/wage: $49,029 (reported on 80.5% of returns)
Here:
$49,029
State:
$62,806
(% of AGI for various income ranges: 1028.5% for AGIs below $25k, 3438.2% for AGIs $25k-50k, 5884.1% for AGIs $50k-75k, 8590.2% for AGIs $75k-100k, 14661.7% for AGIs $100k-200k, 49880.0% for AGIs over 200k)
Taxable interest for individuals: $1,335 (reported on 29.7% of returns)
This zip code:
$1,335
Pennsylvania:
$1,633
(% of AGI for various income ranges: 28.0% for AGIs below $25k, 24.2% for AGIs $25k-50k, 32.2% for AGIs $50k-75k, 83.5% for AGIs $75k-100k, 134.3% for AGIs $100k-200k, 955.0% for AGIs over 200k)
Ordinary dividends: $2,898 (reported on 23.4% of returns)
Here:
$2,898
State:
$7,382
(% of AGI for various income ranges: 33.9% for AGIs below $25k, 30.9% for AGIs $25k-50k, 86.8% for AGIs $50k-75k, 161.0% for AGIs $75k-100k, 260.9% for AGIs $100k-200k, 1232.5% for AGIs over 200k)
Net capital gain/loss in AGI: +$5,136 (reported on 15.7% of returns)
Here:
+$5,136
State:
+$23,522
(% of AGI for various income ranges: 7.5% for AGIs below $25k, 15.9% for AGIs $25k-50k, 60.1% for AGIs $50k-75k, 111.0% for AGIs $75k-100k, 345.3% for AGIs $100k-200k, 4160.0% for AGIs over 200k)
Profit/loss from business: +$10,235 (reported on 10.4% of returns)
Here:
+$10,235
State:
+$16,274
(% of AGI for various income ranges: 39.7% for AGIs below $25k, 76.7% for AGIs $25k-50k, 113.2% for AGIs $50k-75k, 147.2% for AGIs $75k-100k, 475.5% for AGIs $100k-200k, 2167.5% for AGIs over 200k)
Taxable individual retirement arrangement distribution: $13,746 (reported on 11.5% of returns)
18447:
$13,746
Pennsylvania:
$18,583
(% of AGI for various income ranges: 94.3% for AGIs below $25k, 107.0% for AGIs $25k-50k, 239.7% for AGIs $50k-75k, 318.0% for AGIs $75k-100k, 723.2% for AGIs $100k-200k)
Total itemized deductions: $29,488 (reported on 2.9% of returns)
Here:
$29,488
State:
$34,850
(% of AGI for various income ranges: 58.8% for AGIs $25k-50k, 162.1% for AGIs $50k-75k, 143.2% for AGIs $75k-100k, 280.4% for AGIs $100k-200k, 2550.0% for AGIs over 200k)
Charity contributions: $4,646 (reported on 2.4% of returns)
Here:
$4,646
State:
$12,392
(% of AGI for various income ranges: 32.9% for AGIs $50k-75k, 80.9% for AGIs $100k-200k)
Taxes paid: $6,594 (reported on 2.9% of returns)
18447:
$6,594
State:
$8,200
(% of AGI for various income ranges: 9.6% for AGIs $25k-50k, 28.7% for AGIs $50k-75k, 39.5% for AGIs $75k-100k, 79.6% for AGIs $100k-200k, 532.5% for AGIs over 200k)
Earned income credit: $2,132 (reported on 12.6% of returns)
Here:
$2,132
State:
$2,100
(% of AGI for various income ranges: 73.6% for AGIs below $25k, 52.7% for AGIs $25k-50k)
Percentage of individuals using paid preparers for their 2020 taxes: 92.2%
Here:
92%
State:
92%
(% for various income ranges: 90.2% for AGIs below $25k, 94.0% for AGIs $25k-50k, 92.3% for AGIs $50k-75k, 92.5% for AGIs $75k-100k, 91.5% for AGIs $100k-200k, 100.0% for AGIs over 200k)
Averages for the 2012 tax year for zip code 18447, filed in 2013:
Average Adjusted Gross Income (AGI) in 2012: $45,199 (Individual Income Tax Returns)
Here:
$45,199
State:
$61,346
Salary/wage: $40,267 (reported on 83.0% of returns)
Here:
$40,267
State:
$51,902
(% of AGI for various income ranges: 69.4% for AGIs below $25k, 77.6% for AGIs $25k-50k, 77.7% for AGIs $50k-75k, 78.1% for AGIs $75k-100k, 74.5% for AGIs $100k-200k, 44.1% for AGIs over 200k)
Taxable interest for individuals: $1,183 (reported on 37.5% of returns)
This zip code:
$1,183
Pennsylvania:
$1,588
(% of AGI for various income ranges: 1.9% for AGIs below $25k, 0.9% for AGIs $25k-50k, 0.7% for AGIs $50k-75k, 0.8% for AGIs $75k-100k, 1.2% for AGIs $100k-200k, 0.7% for AGIs over 200k)
Ordinary dividends: $2,431 (reported on 25.9% of returns)
Here:
$2,431
State:
$5,827
(% of AGI for various income ranges: 1.8% for AGIs below $25k, 1.0% for AGIs $25k-50k, 1.0% for AGIs $50k-75k, 0.8% for AGIs $75k-100k, 1.5% for AGIs $100k-200k, 4.5% for AGIs over 200k)
Net capital gain/loss in AGI: +$4,009 (reported on 12.5% of returns)
Here:
+$4,009
State:
+$14,495
(% of AGI for various income ranges: 0.2% for AGIs $25k-50k, 0.7% for AGIs $50k-75k, 0.8% for AGIs $75k-100k, 1.6% for AGIs $100k-200k, 6.9% for AGIs over 200k)
Profit/loss from business: +$13,238 (reported on 10.8% of returns)
Here:
+$13,238
State:
+$16,268
(% of AGI for various income ranges: 6.0% for AGIs below $25k, 2.7% for AGIs $25k-50k, 1.8% for AGIs $50k-75k, 1.8% for AGIs $75k-100k, 5.7% for AGIs $100k-200k)
Taxable individual retirement arrangement distribution: $10,680 (reported on 11.0% of returns)
18447:
$10,680
Pennsylvania:
$14,550
(% of AGI for various income ranges: 4.4% for AGIs below $25k, 2.3% for AGIs $25k-50k, 2.6% for AGIs $50k-75k, 3.0% for AGIs $75k-100k, 2.4% for AGIs $100k-200k)
Total itemized deductions: $17,072 (20% of AGI, reported on 20.3% of returns)
Here:
$17,072
State:
$23,538
Here:
19.7% of AGI
State:
18.4% of AGI
(% of AGI for various income ranges: 4.6% for AGIs below $25k, 6.1% for AGIs $25k-50k, 6.7% for AGIs $50k-75k, 8.3% for AGIs $75k-100k, 10.3% for AGIs $100k-200k, 10.3% for AGIs over 200k)
Charity contributions: $2,099 (reported on 16.8% of returns)
Here:
$2,099
State:
$4,025
(% of AGI for various income ranges: 0.3% for AGIs below $25k, 0.5% for AGIs $25k-50k, 0.7% for AGIs $50k-75k, 0.9% for AGIs $75k-100k, 1.1% for AGIs $100k-200k, 1.0% for AGIs over 200k)
Taxes paid: $6,354 (reported on 20.0% of returns)
18447:
$6,354
State:
$9,982
(% of AGI for various income ranges: 0.9% for AGIs below $25k, 1.7% for AGIs $25k-50k, 2.2% for AGIs $50k-75k, 3.1% for AGIs $75k-100k, 4.4% for AGIs $100k-200k, 4.9% for AGIs over 200k)
Earned income credit: $1,997 (reported on 13.8% of returns)
Here:
$1,997
State:
$2,106
(% of AGI for various income ranges: 4.3% for AGIs below $25k, 0.7% for AGIs $25k-50k)
Percentage of individuals using paid preparers for their 2012 taxes: 54.5%
Here:
54%
State:
53%
(% for various income ranges: 48.4% for AGIs below $25k, 53.8% for AGIs $25k-50k, 58.0% for AGIs $50k-75k, 62.3% for AGIs $75k-100k, 66.7% for AGIs $100k-200k, 100.0% for AGIs over 200k)
Averages for the 2004 tax year for zip code 18447, filed in 2005:
Average Adjusted Gross Income (AGI) in 2004: $36,485 (Individual Income Tax Returns)
Here:
$36,485
State:
$48,049
Salary/wage: $33,748 (reported on 83.6% of returns)
Here:
$33,748
State:
$42,646
(% of AGI for various income ranges: 82.5% for AGIs below $10k, 71.6% for AGIs $10k-25k, 83.2% for AGIs $25k-50k, 81.9% for AGIs $50k-75k, 81.2% for AGIs $75k-100k, 61.8% for AGIs over 100k)
Taxable interest for individuals: $1,269 (reported on 54.4% of returns)
This zip code:
$1,269
Pennsylvania:
$1,657
(% of AGI for various income ranges: 6.3% for AGIs below $10k, 3.5% for AGIs $10k-25k, 1.5% for AGIs $25k-50k, 1.3% for AGIs $50k-75k, 1.4% for AGIs $75k-100k, 2.0% for AGIs over 100k)
Taxable dividends: $1,614 (reported on 28.5% of returns)
Here:
$1,614
State:
$3,566
(% of AGI for various income ranges: 2.8% for AGIs below $10k, 1.6% for AGIs $10k-25k, 0.9% for AGIs $25k-50k, 0.8% for AGIs $50k-75k, 0.7% for AGIs $75k-100k, 2.6% for AGIs over 100k)
Net capital gain/loss: +$3,467 (reported on 17.3% of returns)
Here:
+$3,467
State:
+$9,716
(% of AGI for various income ranges: -1.6% for AGIs below $10k, -0.1% for AGIs $10k-25k, 0.0% for AGIs $25k-50k, 0.7% for AGIs $50k-75k, 0.1% for AGIs $75k-100k, 8.4% for AGIs over 100k)
Profit/loss from business: +$11,749 (reported on 10.2% of returns)
Here:
+$11,749
State:
+$14,267
(% of AGI for various income ranges: 3.9% for AGIs below $10k, 4.0% for AGIs $10k-25k, 3.2% for AGIs $25k-50k, 2.7% for AGIs $50k-75k, 2.3% for AGIs $75k-100k, 4.8% for AGIs over 100k)
IRA payment deduction: $2,944 (reported on 3.3% of returns)
18447:
$2,944
Pennsylvania:
$2,903
(% of AGI for various income ranges: 0.4% for AGIs $10k-25k, 0.4% for AGIs $25k-50k, 0.2% for AGIs $50k-75k, 0.2% for AGIs $75k-100k, 0.2% for AGIs over 100k)
Self-employed pension: $7,600 (reported on 0.3% of returns)
Here:
$7,600
Pennsylvania:
$14,674
Total itemized deductions: $14,410 (20% of AGI, reported on 19.1% of returns)
Here:
$14,410
State:
$18,804
Here:
20.1% of AGI
State:
19.5% of AGI
(% of AGI for various income ranges: 5.1% for AGIs below $10k, 4.1% for AGIs $10k-25k, 5.8% for AGIs $25k-50k, 8.1% for AGIs $50k-75k, 8.9% for AGIs $75k-100k, 10.4% for AGIs over 100k)
Charity contributions deductions: $1,916 (3% of AGI, reported on 17.0% of returns)
Here:
$1,916
State:
$3,337
Here:
2.6% of AGI
State:
3.3% of AGI
(% of AGI for various income ranges: 0.3% for AGIs $10k-25k, 0.6% for AGIs $25k-50k, 0.9% for AGIs $50k-75k, 1.2% for AGIs $75k-100k, 1.5% for AGIs over 100k)
Total tax: $4,670 (reported on 75.5% of returns)
18447:
$4,670
State:
$8,008
(% of AGI for various income ranges: 2.7% for AGIs below $10k, 4.3% for AGIs $10k-25k, 7.2% for AGIs $25k-50k, 9.3% for AGIs $50k-75k, 11.0% for AGIs $75k-100k, 16.8% for AGIs over 100k)
Earned income credit: $1,546 (reported on 11.7% of returns)
Here:
$1,546
State:
$1,643
Percentage of individuals using paid preparers for their 2004 taxes: 54.4%
Here:
54%
State:
56%
(% for various income ranges: 46.1% for AGIs below $10k, 55.2% for AGIs $10k-25k, 55.0% for AGIs $25k-50k, 58.6% for AGIs $50k-75k, 57.0% for AGIs $75k-100k, 69.1% for AGIs over 100k)
Likely homosexual households (counted as self-reported same-sex unmarried-partner households)
Lesbian couples: 0.1% of all households
Gay men: 0.3% of all households
Household received Food Stamps/SNAP in the past 12 months: 689 Household did not receive Food Stamps/SNAP in the past 12 months: 3,939
Women who had a birth in the past 12 months: 140 (80 now married, 55 unmarried) Women who did not have a birth in the past 12 months: 1,953 (795 now married, 1,157 unmarried)
Housing units in zip code 18447 with a mortgage: 1,634 (134 second mortgage, 13 home equity loan, 100 both second mortgage and home equity loan) Houses without a mortgage: 55
Median monthly owner costs for units with a mortgage: $1,348 Median monthly owner costs for units without a mortgage: $603
Residents with income below the poverty level in 2022:
This zip code:
8.6%
Whole state:
11.8%
Residents with income below 50% of the poverty level in 2022:
This zip code:
5.9%
Whole state:
6.1%
Median number of rooms in houses and condos:
Here:
6.5
State:
6.8
Median number of rooms in apartments:
Here:
4.5
State:
4.3
Notable locations in this zip code not listed on our city pages
Notable locations in zip code 18447: Mid Valley Industrial Park (A), Millars School (B), Olyphant Fire Department - Liberty Hose Company 6 (C), Olyphant Fire Department - Eureka Hose Company 4 (D), Blakely Hose Company 2 (E), Scott Township Hose Company 1 (F), Olyphant Fire Department - Olyphant Hose Company 2 (G), Olyphant Fire Department - Queen City Hose Company 8 (H), Eddy Creek Shaft Breaker (I), Grassy Island Breaker (J), Olyphant Fire Department - Excelsior Hose Company 1 (K). Display/hide their locations on the map
Cemeteries: Assumption Cemetery (1), Weatherby Cemetery (2), Stone Cemetery (3), Holy Ghost Cemetery (4), Saint Nicholas Cemetery (5), Saint Michaels Cemetery (6), Scott Valley Cemetery (7). Display/hide their locations on the map
In group quarters: 11 (-1 institutionalized population)
Size of family households: 1,182 2-persons, 883 3-persons, 382 4-persons, 226 5-persons, 40 6-persons, 14 7-or-more-persons
Size of nonfamily households: 1,700 1-person, 162 2-persons, 24 5-persons
1,080 married couples with children.
809 single-parent households (343 men, 466 women).
95.7% of residents of 18447 zip code speak English at home.
3.2% of residents speak Spanish at home (73% very well, 5% well, 22% not well).
0.5% of residents speak other Indo-European language at home (100% very well).
0.1% of residents speak Asian or Pacific Island language at home (100% not well).
0.2% of residents speak other language at home (52% very well, 48% well).
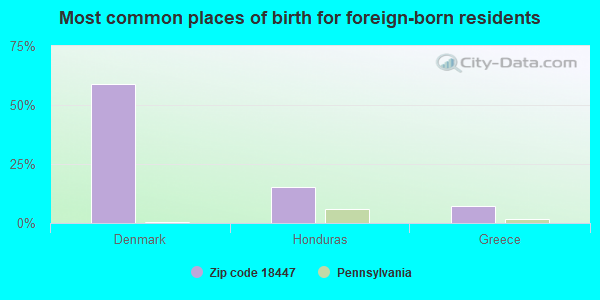
Foreign born population: 96 (0.9%) (20.9% of them are naturalized citizens)
This zip code:
0.9%
Whole state:
7.5%
59%Denmark
15%Honduras
7%Greece
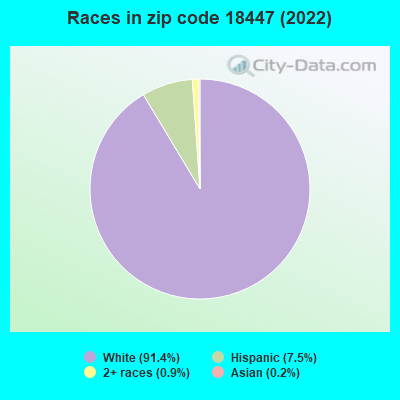
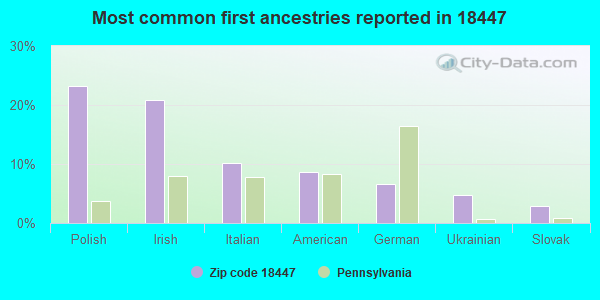
23%Polish
21%Irish
10%Italian
9%American
7%German
5%Ukrainian
3%Slovak
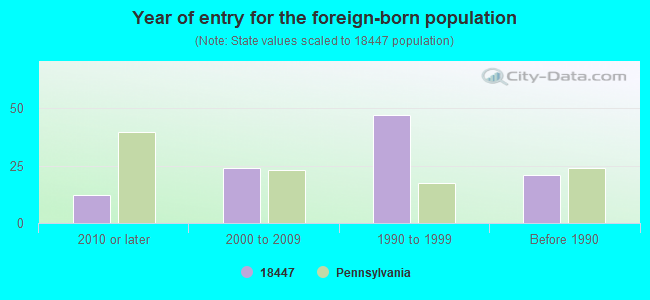
Year of entry for the foreign-born population
122010 or later
242000 to 2009
471990 to 1999
21Before 1990
Facilities with environmental interests located in this zip code:
AMER ELECTROPLATING (1055 EAST LACKAWANNA AVE in OLYPHANT, PA)
STATE MASTER (Pennsylvania database) - RCRIS-PAD982365561, HAZARDOUS WASTE PROGRAM Small Quantity Generators, between 100 kg and 1000 kg of hazardous waste/month (Resource Conservation and Recovery Act (tracking hazardous waste)) - notification Organizations: OPERNAME (CONTACT/OPERATOR)
, MARQUARDT, RICHARD C JR (CONTACT/OWNER)
BIOFOR (ROUTE 632 RR 1 in OLYPHANT, PA)
STATE MASTER (Pennsylvania database) - RCRIS-PAD982569170, HAZARDOUS WASTE PROGRAM Small Quantity Generators, between 100 kg and 1000 kg of hazardous waste/month (Resource Conservation and Recovery Act (tracking hazardous waste)) - notification Organizations: OPERNAME (CONTACT/OPERATOR)
, BIOFOR INC (CONTACT/OWNER)
AMERICAN TECHNICAL INDUSTRIES (MAIN AND LINCOLN STREET in BLAKELY, PA)
Small Quantity Generators, between 100 kg and 1000 kg of hazardous waste/month (Resource Conservation and Recovery Act (tracking hazardous waste)) - notification TRI REPORTER (Tracking of toxic chemicals releasing facilities) Business SIC classification: SPECIAL INDUSTRY MACHINERY Organizations: OPERNAME (CONTACT/OPERATOR)
, PAPERCRAFT CORPORATION (CONTACT/OWNER)
Alternative names: DAWN SPECIAL SYSTEMS CORP
ARIEL CONSOLIDATED INDUSTRIES INC (UNDERWOOD ROAD in OLYPHANT, PA)
Small Quantity Generators, between 100 kg and 1000 kg of hazardous waste/month (Resource Conservation and Recovery Act (tracking hazardous waste)) - notification Organizations: OPERNAME (CONTACT/OPERATOR)
ACTION CENTER REALTY AND CLASSIC PROPER (ROUTE 6 SCRANTON/CARBONDALE HIGHWAY in BLAKELY, PA)
COMPLIANCE ACTIVITY (Tracking inspections of insecticide, fungicide, and rodenticide, and toxic substances)
Housing units lacking complete plumbing facilities: 0.4% Housing units lacking complete kitchen facilities: 2.3%
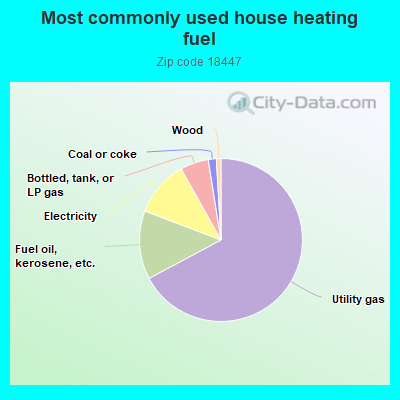
67.2%Utility gas
13.6%Fuel oil, kerosene, etc.
11.1%Electricity
5.6%Bottled, tank, or LP gas
1.6%Coal or coke
0.9%Wood
Population in 1990: 7,421. Population change in the 1990s: +2,382 (+32.1%).
Place of birth for U.S.-born residents:
This state: 8,621
Northeast: 1,057
Midwest: 88
South: 260
West: 65
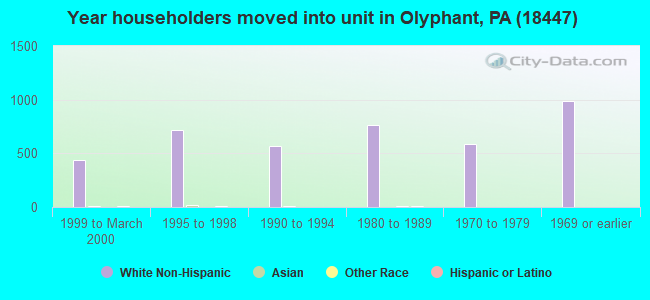
74% of the 18447 zip code residents lived in the same house 5 years ago. Out of people who lived in different houses, 83% lived in this county. Out of people who lived in different counties, 50% lived in Pennsylvania.
95% of the 18447 zip code residents lived in the same house 1 year ago. Out of people who lived in different houses, 72% moved from this county. Out of people who lived in different houses, 4% moved from different county within same state. Out of people who lived in different houses, 23% moved from different state. Out of people who lived in different houses, 4% moved from abroad.
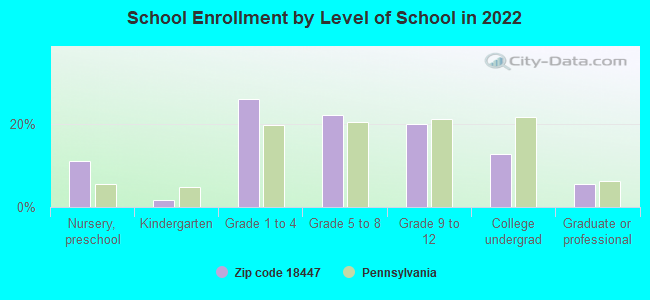
Private vs. public school enrollment:
Students in private schools in grades 1 to 8 (elementary and middle school):
Here:
0.0%
Pennsylvania:
15.7%
Students in private schools in grades 9 to 12 (high school):
Here:
0.0%
Pennsylvania:
13.4%
Students in private undergraduate colleges: 134
Here:
62.8%
Pennsylvania:
39.8%
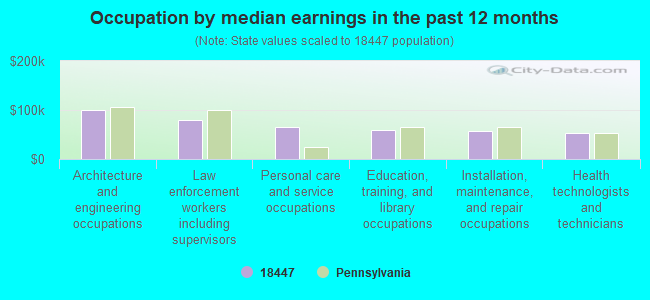
Occupation by median earnings in the past 12 months ($)
100,793Architecture and engineering occupations
78,914Law enforcement workers including supervisors
65,371Personal care and service occupations
59,522Education, training, and library occupations
57,625Installation, maintenance, and repair occupations
52,614Health technologists and technicians
Companies with federal contracts located in this zip code (OLYPHANT, PA):
CECCACCI LIFT TRUCK SERVICE, I (949 UNDERWOOD RD; small business) : $598,188 in 34 contractsfrom 2003 to 2006
Contracts for Warehouse Trucks and Tractors, Self-Propelled, Miscellaneous Items, Material Handling Equipment, Nonself-Propelled, Maintenance, Repair and Rebuilding of Equipment -- Miscellaneous, and moreby Army, Defense Logistics Agency Signed by year:2000: $0; 2001: $0; 2002: $0; 2003: $90,555; 2004: $93,723; 2005: $276,025; 2006: $137,885.
Biggest contracts:
$94,427 with Army for Warehouse Trucks and Tractors, Self-Propelled. Signed on 2006-05-22. Completion date: 2006-10-18.
$47,850, same as above.Signed on 2005-12-22. Completion date: 2006-05-19.
$43,458, same as above.Signed on 2006-04-25. Completion date: 2006-07-28.
$31,980, same as above.Signed on 2005-12-22. Completion date: 2006-02-10.
SCHELLERS FLOOR RUG CLEANING (1 HILLCREST DR; small business) : $38,000 in 5 contractsfrom 2001 to 2003
Contracts for Custodial Janitorial Services by Navy Signed by year:2000: $0; 2001: $19,000; 2002: $7,635; 2003: $11,365; 2004: $0; 2005: $0; 2006: $0.
Biggest contracts:
$19,000 with Navy for Custodial Janitorial Services. Signed on 2001-11-19. Completion date: 2002-09-30.
$9,850, same as above.Signed on 2003-03-31. Completion date: 2002-09-30.
$7,635, same as above.Signed on 2002-11-02. Completion date: 2002-09-30.
$1,515, same as above.Signed on 2003-08-08. Completion date: 2002-09-30.
BRIAN KURILLA (537 E SCOTT ST; small business)
$14,560 with Army for Other Administrative Support Services. Signed on 2004-04-05. Completion date: 2005-04-05.
CANADA DRY BOTTLING COMPANY (1010A UNDERWOOD RD; small business) : $8,148 in 7 contractsfrom 2004 to 2005
Contracts for Food Items For Resale, Non-Food Items For Resale by Defense Commissary Agency Signed by year:2000: $0; 2001: $0; 2002: $0; 2003: $0; 2004: $2,129; 2005: $6,019; 2006: $0.
Biggest contracts:
$2,423 with Defense Commissary Agency for Food Items For Resale. Signed on 2005-04-01. Completion date: 2005-08-31.
$2,129, same as above.Signed on 2004-10-01. Completion date: 2005-02-28.
$1,427 with Defense Commissary Agency for Non-Food Items For Resale. Signed on 2005-10-01. Completion date: 2005-12-31.
$998 with Defense Commissary Agency for Food Items For Resale. Signed on 2005-09-01. Completion date: 2005-09-30.
PINNACLE TRUCK SALES AND SERVI (1006 UNDERWOOD ROAD; small business)
$6,770 with Army for Maintenance, Repair and Rebuilding of Equipment -- Engines, Turbines, and Components. Signed on 2003-06-03. Completion date: 2003-06-30.
Top industries in this zip code by the number of employees in 2005:
Administrative and Support and Waste Management and Remediation Services: Temporary Help Services (100-249 employees: 1 establishment)
Health Care and Social Assistance: Home Health Care Services (50-99: 1, 20-49: 1, 10-19: 1, 1-4: 1)
Wholesale Trade: Women's, Children's, and Infants' Clothing and Accessories Merchant Wholesalers (50-99: 1)
Health Care and Social Assistance: Medical Laboratories (50-99: 1)
Construction: New Single-Family Housing Construction (except Operative Builders) (20-49: 1, 5-9: 3, 1-4: 3)
People in group quarters in 2010:
256 people in nursing facilities/skilled-nursing facilities
People in group quarters in 2000:
3 people in religious group quarters
Fatal accident statistics in 2013:
Fatal accident count: 2
Vehicles involved in fatal accidents: 2
Fatal accidents caused by drunken drivers: 0
Fatalities: 2
Persons involved in fatal accidents: 6
Pedestrians involved in fatal accidents: 0
Fatal accident statistics in 2012:
Fatal accident count: 1
Vehicles involved in fatal accidents: 5
Fatal accidents caused by drunken drivers: 1
Fatalities: 1
Persons involved in fatal accidents: 6
Pedestrians involved in fatal accidents: 0
Home Mortgage Disclosure Act Aggregated Statistics For Year 2009 (Based on 2 full and 8 partial tracts)
A) FHA, FSA/RHS & VA Home Purchase Loans
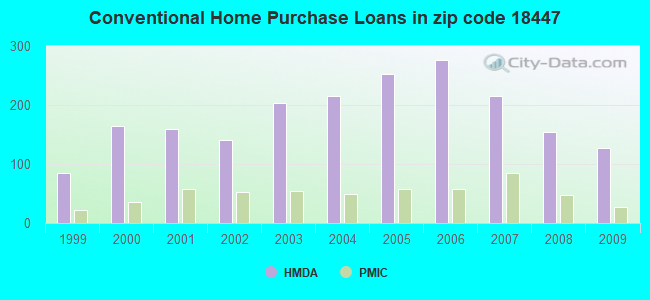
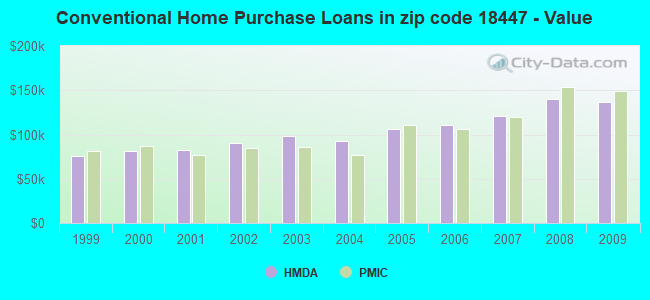
B) Conventional Home Purchase Loans
C) Refinancings
D) Home Improvement Loans
E) Loans on Dwellings For 5+ Families
F) Non-occupant Loans on < 5 Family Dwellings (A B C & D)
G) Loans On Manufactured Home Dwelling (A B C & D)
Number
Average Value
Number
Average Value
Number
Average Value
Number
Average Value
Number
Average Value
Number
Average Value
Number
Average Value
LOANS ORIGINATED
47
$120,691
127
$137,158
434
$132,441
105
$53,988
1
$2,378,530
28
$89,538
1
$47,000
APPLICATIONS APPROVED, NOT ACCEPTED
5
$117,728
10
$166,054
24
$131,284
8
$27,340
0
$0
1
$156,780
0
$0
APPLICATIONS DENIED
10
$136,698
11
$105,354
179
$134,969
41
$37,240
0
$0
10
$102,930
0
$0
APPLICATIONS WITHDRAWN
4
$136,305
10
$92,544
116
$137,489
5
$27,370
1
$364,410
6
$56,340
1
$82,640
FILES CLOSED FOR INCOMPLETENESS
0
$0
0
$0
18
$109,797
4
$59,688
0
$0
1
$35,270
0
$0
Aggregated Statistics For Year 2008 (Based on 2 full and 8 partial tracts)
A) FHA, FSA/RHS & VA Home Purchase Loans
B) Conventional Home Purchase Loans
C) Refinancings
D) Home Improvement Loans
E) Loans on Dwellings For 5+ Families
F) Non-occupant Loans on < 5 Family Dwellings (A B C & D)
G) Loans On Manufactured Home Dwelling (A B C & D)
Number
Average Value
Number
Average Value
Number
Average Value
Number
Average Value
Number
Average Value
Number
Average Value
Number
Average Value
LOANS ORIGINATED
46
$130,038
154
$140,600
285
$113,031
113
$38,020
5
$152,676
44
$107,211
0
$0
APPLICATIONS APPROVED, NOT ACCEPTED
3
$126,870
10
$140,802
36
$107,274
16
$25,309
0
$0
5
$119,200
1
$97,680
APPLICATIONS DENIED
8
$144,721
31
$114,216
185
$140,114
76
$53,350
2
$73,385
8
$83,792
3
$29,690
APPLICATIONS WITHDRAWN
3
$133,267
12
$149,732
78
$117,277
6
$64,800
0
$0
1
$111,020
1
$79,320
FILES CLOSED FOR INCOMPLETENESS
1
$51,080
0
$0
20
$168,796
2
$11,725
0
$0
0
$0
0
$0
Aggregated Statistics For Year 2007 (Based on 2 full and 8 partial tracts)
A) FHA, FSA/RHS & VA Home Purchase Loans
B) Conventional Home Purchase Loans
C) Refinancings
D) Home Improvement Loans
E) Loans on Dwellings For 5+ Families
F) Non-occupant Loans on < 5 Family Dwellings (A B C & D)
G) Loans On Manufactured Home Dwelling (A B C & D)
Number
Average Value
Number
Average Value
Number
Average Value
Number
Average Value
Number
Average Value
Number
Average Value
Number
Average Value
LOANS ORIGINATED
29
$119,366
216
$121,152
301
$103,911
179
$39,200
1
$174,150
59
$83,278
5
$44,302
APPLICATIONS APPROVED, NOT ACCEPTED
4
$153,382
40
$98,741
63
$108,487
14
$38,144
4
$102,695
15
$85,765
0
$0
APPLICATIONS DENIED
8
$195,589
32
$124,248
224
$108,322
54
$59,292
3
$295,957
22
$99,553
1
$12,090
APPLICATIONS WITHDRAWN
1
$29,950
26
$132,148
108
$120,399
11
$85,897
0
$0
9
$161,557
0
$0
FILES CLOSED FOR INCOMPLETENESS
0
$0
4
$114,225
19
$108,181
1
$70,550
0
$0
0
$0
0
$0
Aggregated Statistics For Year 2006 (Based on 2 full and 8 partial tracts)
A) FHA, FSA/RHS & VA Home Purchase Loans
B) Conventional Home Purchase Loans
C) Refinancings
D) Home Improvement Loans
E) Loans on Dwellings For 5+ Families
F) Non-occupant Loans on < 5 Family Dwellings (A B C & D)
G) Loans On Manufactured Home Dwelling (A B C & D)
Number
Average Value
Number
Average Value
Number
Average Value
Number
Average Value
Number
Average Value
Number
Average Value
Number
Average Value
LOANS ORIGINATED
23
$118,423
277
$110,929
387
$87,072
180
$37,397
2
$139,415
46
$82,891
4
$54,415
APPLICATIONS APPROVED, NOT ACCEPTED
4
$137,062
36
$95,689
63
$88,707
22
$26,870
0
$0
7
$68,356
0
$0
APPLICATIONS DENIED
1
$115,900
64
$87,348
328
$101,193
87
$42,149
6
$132,980
20
$80,862
3
$56,643
APPLICATIONS WITHDRAWN
3
$96,297
42
$101,017
212
$104,932
18
$88,483
0
$0
19
$77,016
4
$99,975
FILES CLOSED FOR INCOMPLETENESS
0
$0
11
$69,892
40
$105,053
3
$41,680
0
$0
2
$60,665
0
$0
Aggregated Statistics For Year 2005 (Based on 2 full and 8 partial tracts)
A) FHA, FSA/RHS & VA Home Purchase Loans
B) Conventional Home Purchase Loans
C) Refinancings
D) Home Improvement Loans
E) Loans on Dwellings For 5+ Families
F) Non-occupant Loans on < 5 Family Dwellings (A B C & D)
G) Loans On Manufactured Home Dwelling (A B C & D)
Number
Average Value
Number
Average Value
Number
Average Value
Number
Average Value
Number
Average Value
Number
Average Value
Number
Average Value
LOANS ORIGINATED
13
$99,424
252
$106,185
433
$86,461
138
$43,746
4
$145,238
56
$78,529
3
$27,000
APPLICATIONS APPROVED, NOT ACCEPTED
0
$0
15
$83,005
78
$92,768
18
$43,217
0
$0
9
$41,263
2
$13,700
APPLICATIONS DENIED
1
$125,580
31
$84,189
313
$113,547
54
$27,533
0
$0
32
$69,280
5
$42,246
APPLICATIONS WITHDRAWN
2
$95,215
39
$84,397
190
$100,802
32
$99,327
1
$197,530
5
$93,344
1
$127,050
FILES CLOSED FOR INCOMPLETENESS
0
$0
3
$127,377
25
$106,608
1
$20,160
0
$0
0
$0
0
$0
Aggregated Statistics For Year 2004 (Based on 2 full and 8 partial tracts)
A) FHA, FSA/RHS & VA Home Purchase Loans
B) Conventional Home Purchase Loans
C) Refinancings
D) Home Improvement Loans
E) Loans on Dwellings For 5+ Families
F) Non-occupant Loans on < 5 Family Dwellings (A B C & D)
G) Loans On Manufactured Home Dwelling (A B C & D)
Number
Average Value
Number
Average Value
Number
Average Value
Number
Average Value
Number
Average Value
Number
Average Value
Number
Average Value
LOANS ORIGINATED
20
$88,705
216
$92,960
466
$84,393
172
$37,461
3
$75,550
61
$69,252
5
$70,060
APPLICATIONS APPROVED, NOT ACCEPTED
1
$52,040
26
$71,692
89
$92,807
11
$32,288
0
$0
3
$70,350
0
$0
APPLICATIONS DENIED
3
$93,923
37
$96,386
303
$102,490
65
$42,701
0
$0
15
$99,473
3
$44,293
APPLICATIONS WITHDRAWN
0
$0
18
$90,948
198
$101,656
21
$77,478
2
$136,990
12
$54,647
0
$0
FILES CLOSED FOR INCOMPLETENESS
0
$0
5
$120,328
36
$123,492
5
$43,488
0
$0
1
$45,350
0
$0
Aggregated Statistics For Year 2003 (Based on 2 full and 8 partial tracts)
A) FHA, FSA/RHS & VA Home Purchase Loans
B) Conventional Home Purchase Loans
C) Refinancings
D) Home Improvement Loans
E) Loans on Dwellings For 5+ Families
F) Non-occupant Loans on < 5 Family Dwellings (A B C & D)
Number
Average Value
Number
Average Value
Number
Average Value
Number
Average Value
Number
Average Value
Number
Average Value
LOANS ORIGINATED
17
$81,727
203
$97,955
854
$81,404
115
$30,365
1
$429,060
64
$76,301
APPLICATIONS APPROVED, NOT ACCEPTED
1
$87,680
24
$84,156
128
$86,346
20
$25,648
0
$0
8
$60,499
APPLICATIONS DENIED
1
$122,440
37
$91,755
349
$90,930
52
$47,124
0
$0
16
$85,308
APPLICATIONS WITHDRAWN
0
$0
22
$76,870
180
$104,978
7
$25,277
0
$0
9
$75,353
FILES CLOSED FOR INCOMPLETENESS
0
$0
1
$72,760
34
$102,701
1
$35,980
0
$0
0
$0
Aggregated Statistics For Year 2002 (Based on 2 full and 6 partial tracts)
A) FHA, FSA/RHS & VA Home Purchase Loans
B) Conventional Home Purchase Loans
C) Refinancings
D) Home Improvement Loans
E) Loans on Dwellings For 5+ Families
F) Non-occupant Loans on < 5 Family Dwellings (A B C & D)
Number
Average Value
Number
Average Value
Number
Average Value
Number
Average Value
Number
Average Value
Number
Average Value
LOANS ORIGINATED
20
$73,982
140
$89,892
525
$82,646
111
$26,978
2
$152,185
25
$87,532
APPLICATIONS APPROVED, NOT ACCEPTED
0
$0
22
$62,481
100
$90,695
15
$30,260
1
$40,310
4
$85,542
APPLICATIONS DENIED
7
$96,720
32
$73,441
241
$83,524
43
$35,233
0
$0
12
$54,452
APPLICATIONS WITHDRAWN
1
$35,700
16
$80,009
135
$94,318
13
$27,915
2
$164,390
3
$46,303
FILES CLOSED FOR INCOMPLETENESS
0
$0
5
$59,940
13
$54,247
3
$36,253
0
$0
3
$42,457
Aggregated Statistics For Year 2001 (Based on 2 full and 6 partial tracts)
A) FHA, FSA/RHS & VA Home Purchase Loans
B) Conventional Home Purchase Loans
C) Refinancings
D) Home Improvement Loans
E) Loans on Dwellings For 5+ Families
F) Non-occupant Loans on < 5 Family Dwellings (A B C & D)
Number
Average Value
Number
Average Value
Number
Average Value
Number
Average Value
Number
Average Value
Number
Average Value
LOANS ORIGINATED
46
$67,202
160
$82,395
401
$70,703
114
$26,704
2
$59,690
29
$58,628
APPLICATIONS APPROVED, NOT ACCEPTED
1
$84,660
26
$81,929
70
$65,014
21
$26,364
1
$103,800
1
$85,090
APPLICATIONS DENIED
2
$75,220
33
$61,832
227
$70,618
58
$23,154
0
$0
8
$39,900
APPLICATIONS WITHDRAWN
0
$0
17
$100,791
153
$88,109
17
$23,132
0
$0
4
$75,535
FILES CLOSED FOR INCOMPLETENESS
2
$67,515
0
$0
14
$70,087
7
$37,113
0
$0
2
$29,355
Aggregated Statistics For Year 2000 (Based on 2 full and 6 partial tracts)
A) FHA, FSA/RHS & VA Home Purchase Loans
B) Conventional Home Purchase Loans
C) Refinancings
D) Home Improvement Loans
F) Non-occupant Loans on < 5 Family Dwellings (A B C & D)
Number
Average Value
Number
Average Value
Number
Average Value
Number
Average Value
Number
Average Value
LOANS ORIGINATED
30
$70,962
164
$81,303
185
$62,046
134
$20,531
21
$70,166
APPLICATIONS APPROVED, NOT ACCEPTED
0
$0
23
$74,958
76
$56,079
23
$25,592
3
$34,477
APPLICATIONS DENIED
0
$0
44
$72,994
147
$62,447
55
$22,212
3
$34,700
APPLICATIONS WITHDRAWN
2
$51,400
24
$83,419
122
$72,802
16
$33,742
3
$47,733
FILES CLOSED FOR INCOMPLETENESS
0
$0
0
$0
20
$69,346
0
$0
0
$0
Aggregated Statistics For Year 1999 (Based on 1 full and 4 partial tracts)
A) FHA, FSA/RHS & VA Home Purchase Loans
B) Conventional Home Purchase Loans
C) Refinancings
D) Home Improvement Loans
E) Loans on Dwellings For 5+ Families
F) Non-occupant Loans on < 5 Family Dwellings (A B C & D)
2003 - 2018 National Fire Incident Reporting System (NFIRS) incidents
Based on the data from the years 2003 - 2018 the average number of fire incidents per year is 23. The highest number of reported fires - 97 took place in 2016, and the least - 0 in 2004. The data has a growing trend.
When looking into fire subcategories, the most incidents belonged to: Structure Fires (47.3%), and Outside Fires (32.3%).
Fire incident types reported to NFIRS in Zip Code 18447
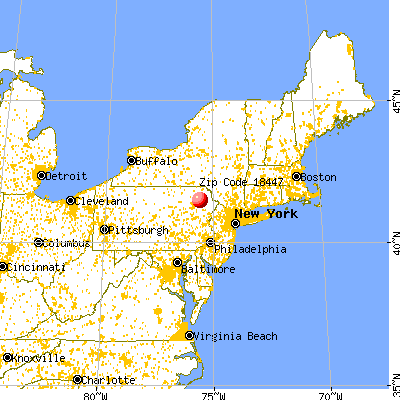


 Nearest zip codes: 18452, 18519, 18433, 18403, 18508, 18471.


 Based on the data from the years 2003 - 2018 the average number of fire incidents per year is 23. The highest number of reported fires - 97 took place in 2016, and the least - 0 in 2004. The data has a growing trend.
 When looking into fire subcategories, the most incidents belonged to: Structure Fires (47.3%), and Outside Fires (32.3%).