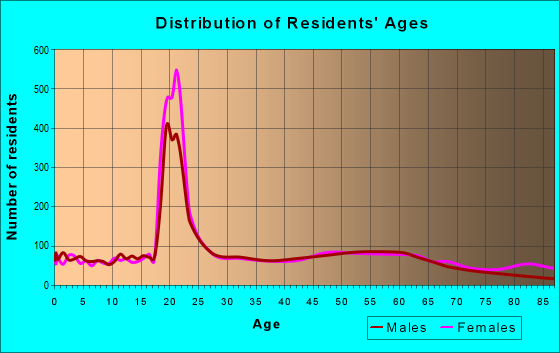
Estimated zip code population in 2022: 14,510 Zip code population in 2010: 14,119 Zip code population in 2000: 13,690
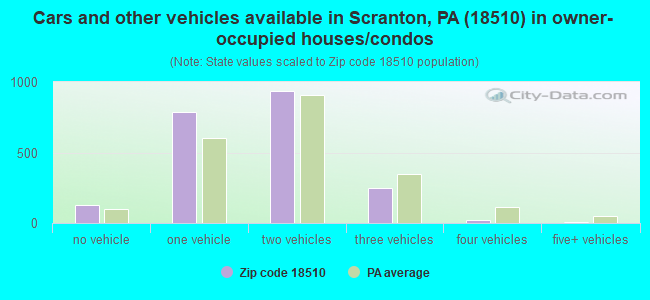
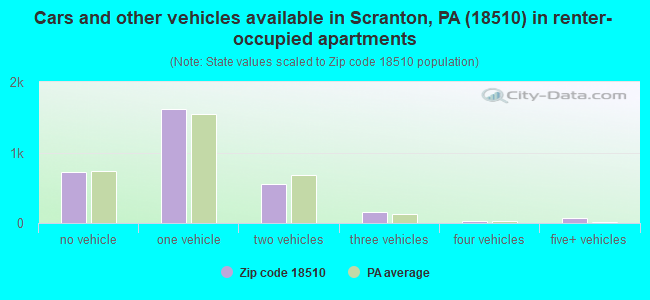
Houses and condos: 5,993 Renter-occupied apartments: 3,129
% of renters here:
60%
State:
31%
March 2022 cost of living index in zip code 18510: 94.8 (less than average, U.S. average is 100)
Land area: 2.1 sq. mi. Water area: 0.0 sq. mi.
Population density: 6,769 people per square mile
(high).
OSM Map
General Map
Google Map
MSN Map
OSM Map
General Map
Google Map
MSN Map
OSM Map
General Map
Google Map
MSN Map
OSM Map
General Map
Google Map
MSN Map
Please wait while loading the map...
Real estate property taxes paid for housing units in 2022:
This zip code:
1.8% ($3,251)
Pennsylvania:
1.3% ($3,094)
Median real estate property taxes paid for housing units with mortgages in 2022: $3,062 (1.6%) Median real estate property taxes paid for housing units with no mortgage in 2022: $3,550 (2.1%)
Averages for the 2020 tax year for zip code 18510, filed in 2021:
Average Adjusted Gross Income (AGI) in 2020: $49,591 (Individual Income Tax Returns)
Here:
$49,591
State:
$75,707
Salary/wage: $40,900 (reported on 84.0% of returns)
Here:
$40,900
State:
$62,806
(% of AGI for various income ranges: 1097.3% for AGIs below $25k, 3548.8% for AGIs $25k-50k, 6827.6% for AGIs $50k-75k, 8828.3% for AGIs $75k-100k, 15469.6% for AGIs $100k-200k)
Taxable interest for individuals: $1,141 (reported on 20.2% of returns)
This zip code:
$1,141
Pennsylvania:
$1,633
(% of AGI for various income ranges: 10.3% for AGIs below $25k, 10.5% for AGIs $25k-50k, 23.1% for AGIs $50k-75k, 56.2% for AGIs $75k-100k, 59.6% for AGIs $100k-200k)
Ordinary dividends: $9,512 (reported on 13.6% of returns)
Here:
$9,512
State:
$7,382
(% of AGI for various income ranges: 25.1% for AGIs below $25k, 27.0% for AGIs $25k-50k, 80.0% for AGIs $50k-75k, 90.0% for AGIs $75k-100k, 265.7% for AGIs $100k-200k)
Net capital gain/loss in AGI: +$19,368 (reported on 10.6% of returns)
Here:
+$19,368
State:
+$23,522
(% of AGI for various income ranges: 9.7% for AGIs below $25k, 18.9% for AGIs $25k-50k, 51.3% for AGIs $50k-75k, 77.9% for AGIs $75k-100k, 364.8% for AGIs $100k-200k)
Profit/loss from business: +$10,034 (reported on 11.2% of returns)
Here:
+$10,034
State:
+$16,274
(% of AGI for various income ranges: 89.8% for AGIs below $25k, 103.8% for AGIs $25k-50k, 110.4% for AGIs $50k-75k, 224.2% for AGIs $75k-100k, 830.0% for AGIs $100k-200k)
Taxable individual retirement arrangement distribution: $12,864 (reported on 6.6% of returns)
18510:
$12,864
Pennsylvania:
$18,583
(% of AGI for various income ranges: 40.3% for AGIs below $25k, 56.0% for AGIs $25k-50k, 103.0% for AGIs $50k-75k, 271.7% for AGIs $75k-100k, 767.8% for AGIs $100k-200k)
Total itemized deductions: $33,517 (reported on 2.4% of returns)
Here:
$33,517
State:
$34,850
(% of AGI for various income ranges: 52.9% for AGIs below $25k, 160.7% for AGIs $50k-75k, 267.8% for AGIs $100k-200k)
Charity contributions: $19,700 (reported on 1.8% of returns)
Here:
$19,700
State:
$12,392
(% of AGI for various income ranges: 32.4% for AGIs $50k-75k, 111.7% for AGIs $100k-200k)
Taxes paid: $7,342 (reported on 2.4% of returns)
18510:
$7,342
State:
$8,200
(% of AGI for various income ranges: 9.3% for AGIs below $25k, 40.6% for AGIs $50k-75k, 105.7% for AGIs $100k-200k)
Earned income credit: $2,220 (reported on 20.4% of returns)
Here:
$2,220
State:
$2,100
(% of AGI for various income ranges: 91.8% for AGIs below $25k, 74.4% for AGIs $25k-50k, 2.6% for AGIs $50k-75k)
Percentage of individuals using paid preparers for their 2020 taxes: 90.0%
Here:
90%
State:
92%
(% for various income ranges: 89.4% for AGIs below $25k, 91.3% for AGIs $25k-50k, 86.5% for AGIs $50k-75k, 87.9% for AGIs $75k-100k, 94.3% for AGIs $100k-200k, 100.0% for AGIs over 200k)
Averages for the 2012 tax year for zip code 18510, filed in 2013:
Average Adjusted Gross Income (AGI) in 2012: $38,995 (Individual Income Tax Returns)
Here:
$38,995
State:
$61,346
Salary/wage: $33,385 (reported on 85.6% of returns)
Here:
$33,385
State:
$51,902
(% of AGI for various income ranges: 79.9% for AGIs below $25k, 83.7% for AGIs $25k-50k, 78.5% for AGIs $50k-75k, 80.1% for AGIs $75k-100k, 70.2% for AGIs $100k-200k, 36.5% for AGIs over 200k)
Taxable interest for individuals: $1,446 (reported on 27.1% of returns)
This zip code:
$1,446
Pennsylvania:
$1,588
(% of AGI for various income ranges: 1.3% for AGIs below $25k, 0.8% for AGIs $25k-50k, 0.9% for AGIs $50k-75k, 0.7% for AGIs $75k-100k, 0.6% for AGIs $100k-200k, 2.0% for AGIs over 200k)
Ordinary dividends: $4,312 (reported on 17.3% of returns)
Here:
$4,312
State:
$5,827
(% of AGI for various income ranges: 1.6% for AGIs below $25k, 1.4% for AGIs $25k-50k, 1.7% for AGIs $50k-75k, 1.8% for AGIs $75k-100k, 2.3% for AGIs $100k-200k, 3.1% for AGIs over 200k)
Net capital gain/loss in AGI: +$5,176 (reported on 10.2% of returns)
Here:
+$5,176
State:
+$14,495
(% of AGI for various income ranges: 0.4% for AGIs $50k-75k, 3.8% for AGIs $100k-200k, 5.0% for AGIs over 200k)
Profit/loss from business: +$12,378 (reported on 9.6% of returns)
Here:
+$12,378
State:
+$16,268
(% of AGI for various income ranges: 4.5% for AGIs below $25k, 1.7% for AGIs $25k-50k, 2.3% for AGIs $50k-75k, 0.6% for AGIs $75k-100k, 8.4% for AGIs $100k-200k)
Taxable individual retirement arrangement distribution: $10,641 (reported on 8.1% of returns)
18510:
$10,641
Pennsylvania:
$14,550
(% of AGI for various income ranges: 2.2% for AGIs below $25k, 1.7% for AGIs $25k-50k, 2.4% for AGIs $50k-75k, 2.1% for AGIs $75k-100k, 4.6% for AGIs $100k-200k)
Total itemized deductions: $20,071 (20% of AGI, reported on 16.0% of returns)
Here:
$20,071
State:
$23,538
Here:
20.3% of AGI
State:
18.4% of AGI
(% of AGI for various income ranges: 4.0% for AGIs below $25k, 5.0% for AGIs $25k-50k, 7.4% for AGIs $50k-75k, 10.3% for AGIs $75k-100k, 14.5% for AGIs $100k-200k, 10.8% for AGIs over 200k)
Charity contributions: $4,366 (reported on 12.3% of returns)
Here:
$4,366
State:
$4,025
(% of AGI for various income ranges: 0.3% for AGIs below $25k, 0.6% for AGIs $25k-50k, 1.0% for AGIs $50k-75k, 1.6% for AGIs $75k-100k, 2.2% for AGIs $100k-200k, 3.3% for AGIs over 200k)
Taxes paid: $8,419 (reported on 16.0% of returns)
18510:
$8,419
State:
$9,982
(% of AGI for various income ranges: 0.8% for AGIs below $25k, 1.5% for AGIs $25k-50k, 2.7% for AGIs $50k-75k, 4.4% for AGIs $75k-100k, 6.5% for AGIs $100k-200k, 6.6% for AGIs over 200k)
Earned income credit: $2,122 (reported on 23.1% of returns)
Here:
$2,122
State:
$2,106
(% of AGI for various income ranges: 6.1% for AGIs below $25k, 1.2% for AGIs $25k-50k)
Percentage of individuals using paid preparers for their 2012 taxes: 47.9%
Here:
48%
State:
53%
(% for various income ranges: 45.2% for AGIs below $25k, 45.8% for AGIs $25k-50k, 52.8% for AGIs $50k-75k, 53.8% for AGIs $75k-100k, 62.5% for AGIs $100k-200k, 80.0% for AGIs over 200k)
Averages for the 2004 tax year for zip code 18510, filed in 2005:
Average Adjusted Gross Income (AGI) in 2004: $34,078 (Individual Income Tax Returns)
Here:
$34,078
State:
$48,049
Salary/wage: $29,834 (reported on 83.7% of returns)
Here:
$29,834
State:
$42,646
(% of AGI for various income ranges: 91.5% for AGIs below $10k, 80.6% for AGIs $10k-25k, 83.1% for AGIs $25k-50k, 77.9% for AGIs $50k-75k, 77.7% for AGIs $75k-100k, 52.2% for AGIs over 100k)
Taxable interest for individuals: $2,257 (reported on 42.2% of returns)
This zip code:
$2,257
Pennsylvania:
$1,657
(% of AGI for various income ranges: 5.8% for AGIs below $10k, 3.4% for AGIs $10k-25k, 1.9% for AGIs $25k-50k, 2.6% for AGIs $50k-75k, 1.9% for AGIs $75k-100k, 3.4% for AGIs over 100k)
Taxable dividends: $4,647 (reported on 25.3% of returns)
Here:
$4,647
State:
$3,566
(% of AGI for various income ranges: 5.1% for AGIs below $10k, 2.2% for AGIs $10k-25k, 1.7% for AGIs $25k-50k, 2.2% for AGIs $50k-75k, 3.6% for AGIs $75k-100k, 6.5% for AGIs over 100k)
Net capital gain/loss: +$6,027 (reported on 17.6% of returns)
Here:
+$6,027
State:
+$9,716
(% of AGI for various income ranges: -2.9% for AGIs below $10k, -0.3% for AGIs $10k-25k, 0.4% for AGIs $25k-50k, 1.4% for AGIs $50k-75k, 1.7% for AGIs $75k-100k, 10.2% for AGIs over 100k)
Profit/loss from business: +$13,637 (reported on 9.4% of returns)
Here:
+$13,637
State:
+$14,267
(% of AGI for various income ranges: 4.5% for AGIs below $10k, 2.7% for AGIs $10k-25k, 2.8% for AGIs $25k-50k, 2.5% for AGIs $50k-75k, 2.7% for AGIs $75k-100k, 6.7% for AGIs over 100k)
IRA payment deduction: $3,208 (reported on 2.1% of returns)
18510:
$3,208
Pennsylvania:
$2,903
Self-employed pension: $17,692 (reported on 0.3% of returns)
Here:
$17,692
Pennsylvania:
$14,674
Total itemized deductions: $19,347 (23% of AGI, reported on 18.6% of returns)
Here:
$19,347
State:
$18,804
Here:
23.0% of AGI
State:
19.5% of AGI
(% of AGI for various income ranges: 6.8% for AGIs below $10k, 6.4% for AGIs $10k-25k, 6.9% for AGIs $25k-50k, 11.0% for AGIs $50k-75k, 12.2% for AGIs $75k-100k, 16.0% for AGIs over 100k)
Charity contributions deductions: $5,025 (6% of AGI, reported on 16.1% of returns)
Here:
$5,025
State:
$3,337
Here:
5.5% of AGI
State:
3.3% of AGI
(% of AGI for various income ranges: 0.3% for AGIs below $10k, 0.5% for AGIs $10k-25k, 1.2% for AGIs $25k-50k, 2.0% for AGIs $50k-75k, 2.2% for AGIs $75k-100k, 5.2% for AGIs over 100k)
Total tax: $5,495 (reported on 67.4% of returns)
18510:
$5,495
State:
$8,008
(% of AGI for various income ranges: 1.9% for AGIs below $10k, 3.9% for AGIs $10k-25k, 7.2% for AGIs $25k-50k, 9.4% for AGIs $50k-75k, 11.0% for AGIs $75k-100k, 20.5% for AGIs over 100k)
Earned income credit: $1,636 (reported on 18.1% of returns)
Here:
$1,636
State:
$1,643
Percentage of individuals using paid preparers for their 2004 taxes: 53.8%
Here:
54%
State:
56%
(% for various income ranges: 47.8% for AGIs below $10k, 56.3% for AGIs $10k-25k, 52.0% for AGIs $25k-50k, 56.1% for AGIs $50k-75k, 54.5% for AGIs $75k-100k, 78.1% for AGIs over 100k)
Likely homosexual households (counted as self-reported same-sex unmarried-partner households)
Lesbian couples: 0.0% of all households
Gay men: 0.3% of all households
Household received Food Stamps/SNAP in the past 12 months: 1,546 Household did not receive Food Stamps/SNAP in the past 12 months: 3,733
Women who had a birth in the past 12 months: 96 (97 now married, 5 unmarried) Women who did not have a birth in the past 12 months: 4,351 (1,008 now married, 3,367 unmarried)
Housing units in zip code 18510 with a mortgage: 1,067 (161 second mortgage, 8 home equity loan, 143 both second mortgage and home equity loan) Houses without a mortgage: 166
Median monthly owner costs for units with a mortgage: $1,353 Median monthly owner costs for units without a mortgage: $795
Residents with income below the poverty level in 2022:
This zip code:
21.6%
Whole state:
11.8%
Residents with income below 50% of the poverty level in 2022:
This zip code:
11.7%
Whole state:
6.1%
Median number of rooms in houses and condos:
Here:
7.5
State:
6.8
Median number of rooms in apartments:
Here:
4.3
State:
4.3
Notable locations in this zip code not listed on our city pages
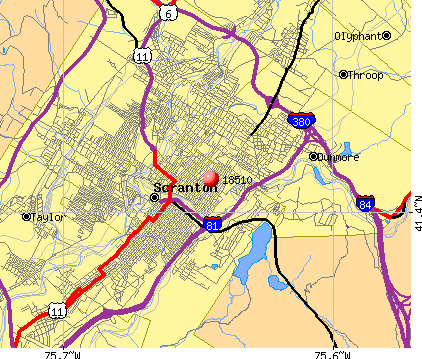
Notable locations in zip code 18510: Plaza 500 (A), Bunker Hill (B), Rock Junction (C), Haines Junction (D), Founder's Green (E), Galvin Terrace (F), Linden Plaza (G), Mullberry Plaza (H), Sheila Jordan Murray Memorial Rock Garden (I), Admissions Visitors Center (J), Brennan Hall (K), Cambria House (L), Ciszek Hall (M), Communcations Wing (N), Denis Edward Hall (O), Dorothy Day House (P), Elizabeth Ann Seton House (Q), Elm Park Annex (R), Fayette House (S), Gallery House (T). Display/hide their locations on the map
Churches in zip code 18510 include: Elm Park Methodist Church (A), Immanual Baptist Church (B), Saint Johns Lutheran Church (C), Madison Avenue Temple (D), Temple Israel (E), Westminster Presbyterian Church (F), Pine Street Baptist Church (G). Display/hide their locations on the map
Parks in zip code 18510 include: DeNaples Fields (1), Christ the Teacher Sculpture (2), Centennial Fountain Saint Ignatius Sculpture (3), Royal Courts at DeNaples Fields (4), Poly-Hi Solidur Park (5), Schautz Memorial Stadium (6), Nay Aug Park (7), Jacob and the Angel Sculpture (8). Display/hide their locations on the map
1,571 married couples with children.
842 single-parent households (49 men, 793 women).
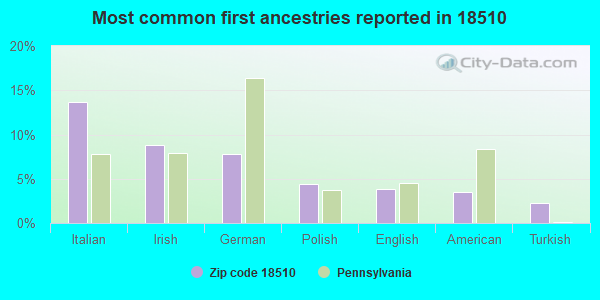
75.3% of residents of 18510 zip code speak English at home.
7.3% of residents speak Spanish at home (69% very well, 14% well, 13% not well, 3% not at all).
12.5% of residents speak other Indo-European language at home (39% very well, 40% well, 15% not well, 6% not at all).
2.1% of residents speak Asian or Pacific Island language at home (59% very well, 23% well, 13% not well, 5% not at all).
3.4% of residents speak other language at home (32% very well, 16% well, 52% not well).
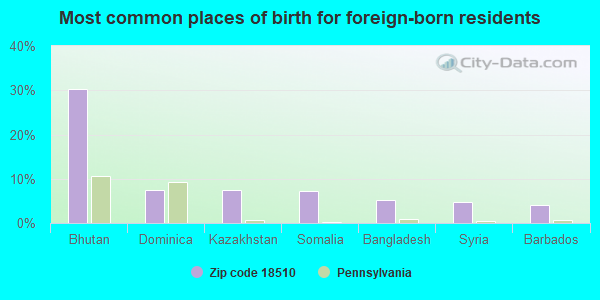
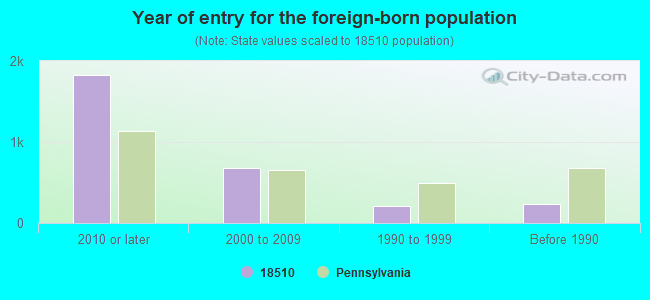
Foreign born population: 2,589 (17.8%) (45.6% of them are naturalized citizens)
Housing units lacking complete plumbing facilities: 2.9% Housing units lacking complete kitchen facilities: 2.2%
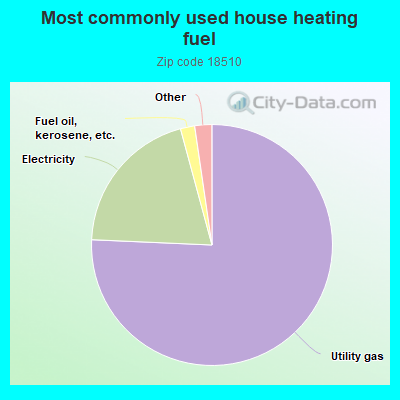
75.7%Utility gas
20.1%Electricity
1.9%Fuel oil, kerosene, etc.
0.9%Bottled, tank, or LP gas
0.6%Other fuel
Population in 1990: 14,306.
Place of birth for U.S.-born residents:
This state: 7,523
Northeast: 3,117
Midwest: 313
South: 649
West: 231
54% of the 18510 zip code residents lived in the same house 5 years ago. Out of people who lived in different houses, 49% lived in this county. Out of people who lived in different counties, 50% lived in Pennsylvania.
84% of the 18510 zip code residents lived in the same house 1 year ago. Out of people who lived in different houses, 58% moved from this county. Out of people who lived in different houses, 10% moved from different county within same state. Out of people who lived in different houses, 29% moved from different state. Out of people who lived in different houses, 1% moved from abroad.
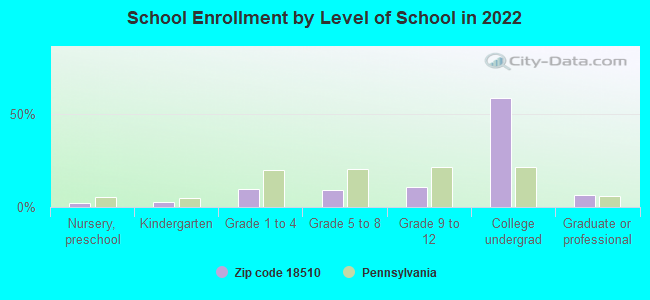
Private vs. public school enrollment:
Students in private schools in grades 1 to 8 (elementary and middle school): 85
Here:
7.7%
Pennsylvania:
15.7%
Students in private schools in grades 9 to 12 (high school): 227
Here:
35.6%
Pennsylvania:
13.4%
Students in private undergraduate colleges: 3,215
Here:
92.4%
Pennsylvania:
39.8%
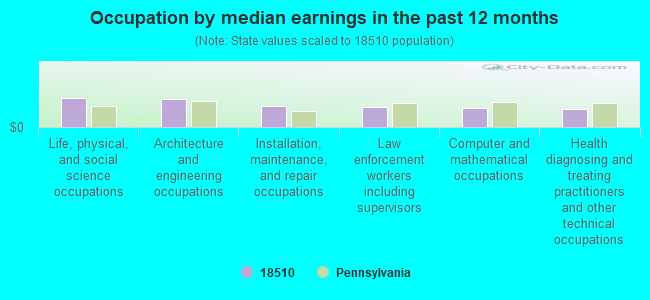
Occupation by median earnings in the past 12 months ($)
100,780Life, physical, and social science occupations
96,762Architecture and engineering occupations
72,061Installation, maintenance, and repair occupations
67,805Law enforcement workers including supervisors
65,267Computer and mathematical occupations
63,454Health diagnosing and treating practitioners and other technical occupations
Companies with federal contracts located in this zip code:
UNIVERSITY OF SCRANTON (LINDEN ST & MONROE AVE in SCRANTON, PA) : $817,036 in 9 contractsfrom 2003 to 2006
Contracts for Weapons -- Applied Research and Exploratory Development (R&D), Education Services, Educational Services, Tuition, Registration, and Membership Fees by Air Force, Navy Signed by year:2000: $0; 2001: $0; 2002: $0; 2003: $150,000; 2004: $113,642; 2005: $353,394; 2006: $200,000.
Biggest contracts:
$200,000 with Air Force for Weapons -- Applied Research and Exploratory Development (R&D). Signed on 2006-01-17. Completion date: 2007-01-01.
$150,000, same as above.Signed on 2005-06-08. Completion date: 2006-03-09.
$150,000, same as above.Signed on 2003-08-01. Completion date: 2004-05-08.
$149,971, same as above.Signed on 2005-11-30. Completion date: 2007-01-01.
DEMPSEY UNIFORM& LINEN SUPPLY, (1310 CLAY AVENUE in SCRANTON, PA; small business) : $164,786 in 39 contractsfrom 2002 to 2006
Contracts for Laundry and DryCleaning Services, Clothing, Special Purpose, Carpet Laying and Cleaning, Maintenance, Repair and Rebuilding of Equipment -- Miscellaneous, and moreby Army Signed by year:2000: $0; 2001: $0; 2002: $63,084; 2003: $16,843; 2004: $7,733; 2005: $77,760; 2006: -$634.
Biggest contracts:
$63,084 with Army for Laundry and DryCleaning Services. Signed on 2002-11-04. Completion date: 2004-12-01.
$30,358, same as above.Signed on 2005-02-10. Completion date: 2004-12-01.
$27,456, same as above.Signed on 2005-11-18. Completion date: 2005-12-01.
$11,271 with Army for Clothing, Special Purpose. Signed on 2004-02-26. Completion date: 2004-09-30.
YOUNGBLOOD, SHERYL (636 N IRVING AVE in SCRANTON, PA; small business)
$480 with Army for Other Administrative Support Services. Signed on 2004-02-26. Completion date: 2004-02-27.
Top industries in this zip code by the number of employees in 2005:
Health Care and Social Assistance: General Medical and Surgical Hospitals (over 1000 employees: 2 establishments)
Educational Services: Colleges, Universities, and Professional Schools (over 1000: 1, 50-99: 1)
Health Care and Social Assistance: Offices of Physicians (except Mental Health Specialists) (50-99: 1, 20-49: 9, 10-19: 7, 5-9: 7, 1-4: 21)
Health Care and Social Assistance: Nursing Care Facilities (250-499: 1, 100-249: 1, 10-19: 1)
Management of Companies and Enterprises: Corporate, Subsidiary, and Regional Managing Offices (100-249: 2)
Accommodation and Food Services: Food Service Contractors (100-249: 1, 5-9: 2, 1-4: 3)
Professional, Scientific, and Technical Services: Payroll Services (100-249: 1)
Health Care and Social Assistance: Child Day Care Services (50-99: 1, 20-49: 1, 5-9: 1, 1-4: 4)
Professional, Scientific, and Technical Services: Offices of Lawyers (50-99: 1, 5-9: 3, 1-4: 12)
Other Services (except Public Administration): Religious Organizations (10-19: 5, 5-9: 3, 1-4: 4)
People in group quarters in 2010:
2,033 people in college/university student housing
452 people in nursing facilities/skilled-nursing facilities
15 people in mental (psychiatric) hospitals and psychiatric units in other hospitals
4 people in group homes intended for adults
3 people in in-patient hospice facilities
2 people in other noninstitutional facilities
People in group quarters in 2000:
1,658 people in college dormitories (includes college quarters off campus)
336 people in nursing homes
57 people in other noninstitutional group quarters
18 people in homes for the mentally retarded
9 people in homes or halfway houses for drug/alcohol abuse
4 people in religious group quarters
3 people in hospitals/wards and hospices for chronically ill
3 people in hospices or homes for chronically ill
Home Mortgage Disclosure Act Aggregated Statistics For Year 2009 (Based on 3 full and 8 partial tracts)
A) FHA, FSA/RHS & VA Home Purchase Loans
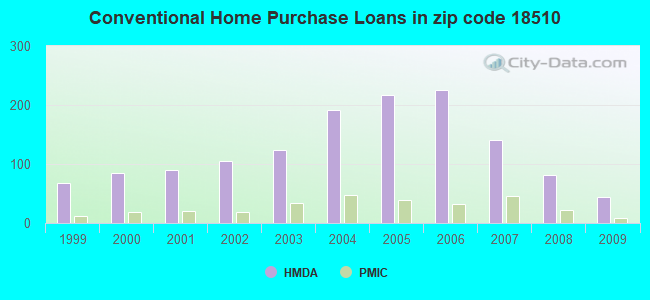
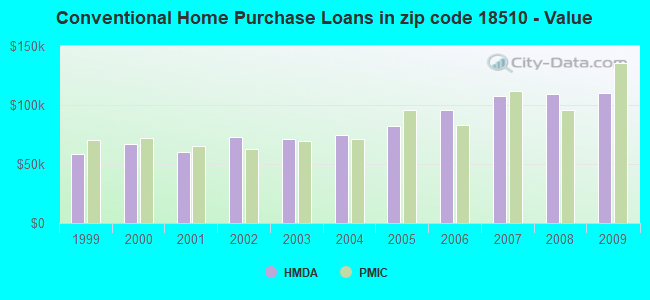
B) Conventional Home Purchase Loans
C) Refinancings
D) Home Improvement Loans
E) Loans on Dwellings For 5+ Families
F) Non-occupant Loans on < 5 Family Dwellings (A B C & D)
Number
Average Value
Number
Average Value
Number
Average Value
Number
Average Value
Number
Average Value
Number
Average Value
LOANS ORIGINATED
26
$102,574
44
$110,119
163
$114,594
41
$47,116
3
$865,603
44
$100,507
APPLICATIONS APPROVED, NOT ACCEPTED
6
$103,720
5
$117,966
15
$107,163
9
$22,468
0
$0
2
$92,090
APPLICATIONS DENIED
4
$105,338
10
$64,345
97
$93,698
23
$58,590
0
$0
15
$71,233
APPLICATIONS WITHDRAWN
10
$148,085
8
$67,316
44
$106,267
7
$41,220
0
$0
8
$81,600
FILES CLOSED FOR INCOMPLETENESS
0
$0
1
$51,920
8
$127,306
2
$23,935
0
$0
0
$0
Aggregated Statistics For Year 2008 (Based on 3 full and 8 partial tracts)
A) FHA, FSA/RHS & VA Home Purchase Loans
B) Conventional Home Purchase Loans
C) Refinancings
D) Home Improvement Loans
E) Loans on Dwellings For 5+ Families
F) Non-occupant Loans on < 5 Family Dwellings (A B C & D)
G) Loans On Manufactured Home Dwelling (A B C & D)
Number
Average Value
Number
Average Value
Number
Average Value
Number
Average Value
Number
Average Value
Number
Average Value
Number
Average Value
LOANS ORIGINATED
24
$128,936
82
$109,285
129
$110,716
58
$29,017
6
$615,638
53
$102,504
1
$22,430
APPLICATIONS APPROVED, NOT ACCEPTED
3
$206,410
9
$92,987
42
$100,502
8
$14,540
0
$0
14
$122,835
0
$0
APPLICATIONS DENIED
4
$111,435
12
$91,237
129
$118,379
41
$44,201
0
$0
28
$107,854
1
$5,680
APPLICATIONS WITHDRAWN
7
$118,116
15
$120,769
40
$124,930
9
$61,620
0
$0
14
$107,251
0
$0
FILES CLOSED FOR INCOMPLETENESS
3
$101,713
0
$0
9
$178,758
5
$34,924
0
$0
0
$0
0
$0
Aggregated Statistics For Year 2007 (Based on 3 full and 8 partial tracts)
A) FHA, FSA/RHS & VA Home Purchase Loans
B) Conventional Home Purchase Loans
C) Refinancings
D) Home Improvement Loans
E) Loans on Dwellings For 5+ Families
F) Non-occupant Loans on < 5 Family Dwellings (A B C & D)
G) Loans On Manufactured Home Dwelling (A B C & D)
Number
Average Value
Number
Average Value
Number
Average Value
Number
Average Value
Number
Average Value
Number
Average Value
Number
Average Value
LOANS ORIGINATED
11
$90,916
140
$107,789
170
$87,829
70
$53,659
4
$202,538
83
$108,008
0
$0
APPLICATIONS APPROVED, NOT ACCEPTED
1
$105,000
19
$75,457
42
$100,470
10
$49,595
0
$0
13
$91,678
0
$0
APPLICATIONS DENIED
1
$124,000
42
$128,049
191
$106,288
57
$51,043
5
$140,310
47
$128,778
3
$51,863
APPLICATIONS WITHDRAWN
0
$0
10
$109,091
52
$126,171
10
$33,000
0
$0
9
$103,750
0
$0
FILES CLOSED FOR INCOMPLETENESS
0
$0
10
$122,832
16
$130,903
1
$8,920
0
$0
2
$100,920
0
$0
Aggregated Statistics For Year 2006 (Based on 3 full and 8 partial tracts)
A) FHA, FSA/RHS & VA Home Purchase Loans
B) Conventional Home Purchase Loans
C) Refinancings
D) Home Improvement Loans
E) Loans on Dwellings For 5+ Families
F) Non-occupant Loans on < 5 Family Dwellings (A B C & D)
Number
Average Value
Number
Average Value
Number
Average Value
Number
Average Value
Number
Average Value
Number
Average Value
LOANS ORIGINATED
16
$103,188
225
$96,181
245
$92,672
78
$39,061
4
$667,880
127
$100,508
APPLICATIONS APPROVED, NOT ACCEPTED
1
$104,000
17
$87,435
39
$104,251
8
$57,048
1
$171,260
14
$100,776
APPLICATIONS DENIED
4
$82,752
62
$102,642
213
$87,821
57
$46,427
1
$421,520
40
$92,156
APPLICATIONS WITHDRAWN
2
$83,765
39
$96,069
107
$90,970
8
$32,034
1
$101,400
23
$97,380
FILES CLOSED FOR INCOMPLETENESS
0
$0
16
$95,554
27
$88,474
4
$44,708
0
$0
3
$76,813
Aggregated Statistics For Year 2005 (Based on 3 full and 8 partial tracts)
A) FHA, FSA/RHS & VA Home Purchase Loans
B) Conventional Home Purchase Loans
C) Refinancings
D) Home Improvement Loans
E) Loans on Dwellings For 5+ Families
F) Non-occupant Loans on < 5 Family Dwellings (A B C & D)
G) Loans On Manufactured Home Dwelling (A B C & D)
Number
Average Value
Number
Average Value
Number
Average Value
Number
Average Value
Number
Average Value
Number
Average Value
Number
Average Value
LOANS ORIGINATED
14
$95,904
217
$81,836
255
$76,808
78
$41,892
9
$164,394
161
$75,484
1
$12,170
APPLICATIONS APPROVED, NOT ACCEPTED
1
$50,970
24
$76,301
54
$90,243
5
$90,460
4
$240,302
20
$95,627
0
$0
APPLICATIONS DENIED
0
$0
74
$76,824
197
$87,151
37
$51,388
2
$120,885
47
$95,996
4
$54,288
APPLICATIONS WITHDRAWN
0
$0
23
$93,893
113
$88,997
14
$86,577
0
$0
21
$81,114
0
$0
FILES CLOSED FOR INCOMPLETENESS
0
$0
5
$91,032
9
$89,660
0
$0
0
$0
2
$64,385
0
$0
Aggregated Statistics For Year 2004 (Based on 3 full and 8 partial tracts)
A) FHA, FSA/RHS & VA Home Purchase Loans
B) Conventional Home Purchase Loans
C) Refinancings
D) Home Improvement Loans
E) Loans on Dwellings For 5+ Families
F) Non-occupant Loans on < 5 Family Dwellings (A B C & D)
G) Loans On Manufactured Home Dwelling (A B C & D)
Number
Average Value
Number
Average Value
Number
Average Value
Number
Average Value
Number
Average Value
Number
Average Value
Number
Average Value
LOANS ORIGINATED
17
$91,689
192
$74,822
233
$74,389
77
$31,708
4
$108,705
87
$82,552
0
$0
APPLICATIONS APPROVED, NOT ACCEPTED
1
$82,570
35
$64,821
48
$87,571
14
$45,204
1
$102,960
9
$87,076
0
$0
APPLICATIONS DENIED
1
$38,740
44
$78,258
185
$74,138
33
$39,766
0
$0
30
$66,076
1
$66,260
APPLICATIONS WITHDRAWN
1
$102,000
35
$71,689
140
$92,611
10
$42,152
0
$0
15
$103,598
0
$0
FILES CLOSED FOR INCOMPLETENESS
1
$78,490
6
$58,847
23
$82,076
1
$40,780
0
$0
6
$57,437
0
$0
Aggregated Statistics For Year 2003 (Based on 3 full and 8 partial tracts)
A) FHA, FSA/RHS & VA Home Purchase Loans
B) Conventional Home Purchase Loans
C) Refinancings
D) Home Improvement Loans
E) Loans on Dwellings For 5+ Families
F) Non-occupant Loans on < 5 Family Dwellings (A B C & D)
Number
Average Value
Number
Average Value
Number
Average Value
Number
Average Value
Number
Average Value
Number
Average Value
LOANS ORIGINATED
12
$74,652
123
$71,431
349
$76,528
59
$27,534
6
$121,738
80
$73,481
APPLICATIONS APPROVED, NOT ACCEPTED
3
$71,550
23
$89,699
79
$77,153
9
$32,268
0
$0
10
$67,550
APPLICATIONS DENIED
1
$78,000
34
$74,662
201
$86,791
24
$24,007
1
$81,000
17
$88,048
APPLICATIONS WITHDRAWN
2
$55,860
21
$90,691
89
$99,299
7
$27,420
2
$45,765
13
$92,018
FILES CLOSED FOR INCOMPLETENESS
0
$0
3
$63,463
12
$92,737
0
$0
0
$0
1
$65,000
Aggregated Statistics For Year 2002 (Based on 3 full and 8 partial tracts)
A) FHA, FSA/RHS & VA Home Purchase Loans
B) Conventional Home Purchase Loans
C) Refinancings
D) Home Improvement Loans
E) Loans on Dwellings For 5+ Families
F) Non-occupant Loans on < 5 Family Dwellings (A B C & D)
Number
Average Value
Number
Average Value
Number
Average Value
Number
Average Value
Number
Average Value
Number
Average Value
LOANS ORIGINATED
22
$76,218
105
$72,891
250
$74,848
38
$24,781
4
$47,428
57
$61,499
APPLICATIONS APPROVED, NOT ACCEPTED
1
$90,850
12
$67,119
64
$76,478
10
$37,979
0
$0
10
$58,661
APPLICATIONS DENIED
0
$0
15
$45,877
165
$75,402
29
$30,931
0
$0
17
$76,973
APPLICATIONS WITHDRAWN
3
$64,787
9
$61,360
58
$87,349
4
$30,995
0
$0
4
$66,452
FILES CLOSED FOR INCOMPLETENESS
0
$0
2
$46,875
15
$101,808
2
$36,225
0
$0
0
$0
Aggregated Statistics For Year 2001 (Based on 3 full and 8 partial tracts)
A) FHA, FSA/RHS & VA Home Purchase Loans
B) Conventional Home Purchase Loans
C) Refinancings
D) Home Improvement Loans
E) Loans on Dwellings For 5+ Families
F) Non-occupant Loans on < 5 Family Dwellings (A B C & D)
Number
Average Value
Number
Average Value
Number
Average Value
Number
Average Value
Number
Average Value
Number
Average Value
LOANS ORIGINATED
26
$67,013
90
$60,296
213
$68,755
65
$22,954
5
$171,440
48
$51,143
APPLICATIONS APPROVED, NOT ACCEPTED
4
$60,338
13
$54,020
46
$79,027
8
$22,926
0
$0
2
$54,850
APPLICATIONS DENIED
3
$67,067
35
$58,127
154
$80,486
27
$25,220
4
$113,688
23
$155,113
APPLICATIONS WITHDRAWN
0
$0
7
$56,959
63
$74,704
8
$18,331
0
$0
7
$61,441
FILES CLOSED FOR INCOMPLETENESS
0
$0
1
$71,000
10
$63,866
0
$0
0
$0
1
$60,140
Aggregated Statistics For Year 2000 (Based on 3 full and 8 partial tracts)
A) FHA, FSA/RHS & VA Home Purchase Loans
B) Conventional Home Purchase Loans
C) Refinancings
D) Home Improvement Loans
E) Loans on Dwellings For 5+ Families
F) Non-occupant Loans on < 5 Family Dwellings (A B C & D)
Number
Average Value
Number
Average Value
Number
Average Value
Number
Average Value
Number
Average Value
Number
Average Value
LOANS ORIGINATED
19
$75,219
84
$66,894
119
$58,878
51
$23,738
2
$139,625
28
$55,231
APPLICATIONS APPROVED, NOT ACCEPTED
1
$53,000
25
$69,718
43
$65,921
17
$27,752
0
$0
10
$34,122
APPLICATIONS DENIED
9
$84,538
36
$68,571
90
$63,893
25
$25,313
0
$0
16
$69,346
APPLICATIONS WITHDRAWN
1
$61,160
14
$66,582
62
$58,929
2
$60,655
0
$0
11
$48,935
FILES CLOSED FOR INCOMPLETENESS
0
$0
4
$38,952
10
$81,649
0
$0
0
$0
0
$0
Aggregated Statistics For Year 1999 (Based on 3 full and 4 partial tracts)
A) FHA, FSA/RHS & VA Home Purchase Loans
B) Conventional Home Purchase Loans
C) Refinancings
D) Home Improvement Loans
E) Loans on Dwellings For 5+ Families
F) Non-occupant Loans on < 5 Family Dwellings (A B C & D)
2006 - 2018 National Fire Incident Reporting System (NFIRS) incidents
Based on the data from the years 2006 - 2018 the average number of fires per year is 21. The highest number of reported fires - 52 took place in 2014, and the least - 0 in 2012. The data has a growing trend.
When looking into fire subcategories, the most reports belonged to: Structure Fires (66.2%), and Outside Fires (26.5%).
Fire incident types reported to NFIRS in Zip Code 18510
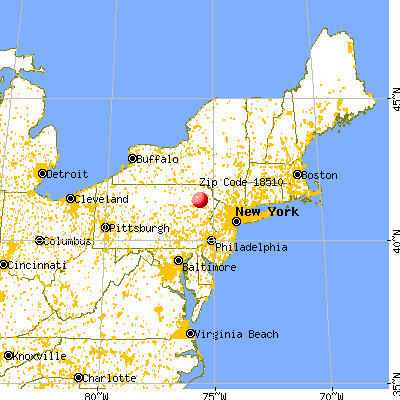


 Nearest zip codes: 18509, 18505, 18503, 18512, 18508, 18519.


 : $817,036 in 9 contracts from 2003 to 2006

 Based on the data from the years 2006 - 2018 the average number of fires per year is 21. The highest number of reported fires - 52 took place in 2014, and the least - 0 in 2012. The data has a growing trend.
 When looking into fire subcategories, the most reports belonged to: Structure Fires (66.2%), and Outside Fires (26.5%).