Estimated zip code population in 2022: 11,065 Zip code population in 2010: 11,985 Zip code population in 2000: 12,422
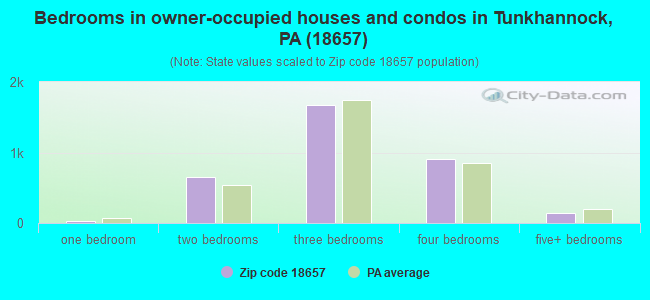
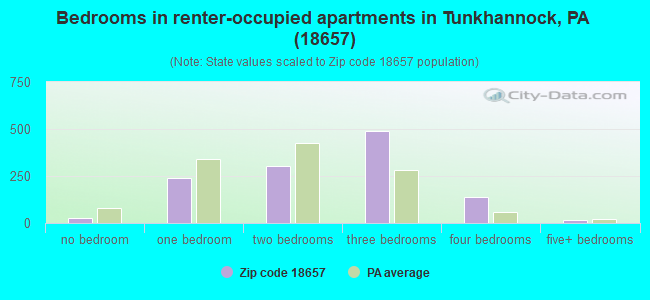
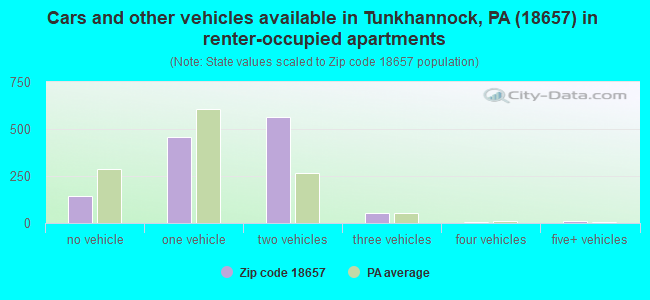
Houses and condos: 5,285 Renter-occupied apartments: 1,233
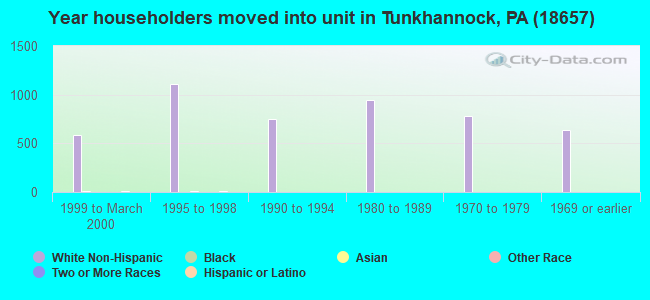
% of renters here:
27%
State:
31%
March 2022 cost of living index in zip code 18657: 92.2 (less than average, U.S. average is 100)
Land area: 123.4 sq. mi. Water area: 3.7 sq. mi.
Population density: 90 people per square mile
(very low).
OSM Map
General Map
Google Map
MSN Map
OSM Map
General Map
Google Map
MSN Map
OSM Map
General Map
Google Map
MSN Map
OSM Map
General Map
Google Map
MSN Map
Please wait while loading the map...
Real estate property taxes paid for housing units in 2022:
This zip code:
1.3% ($2,761)
Pennsylvania:
1.3% ($3,094)
Median real estate property taxes paid for housing units with mortgages in 2022: $2,664 (1.2%) Median real estate property taxes paid for housing units with no mortgage in 2022: $2,934 (1.3%)
Business Search- 14 Million verified businesses
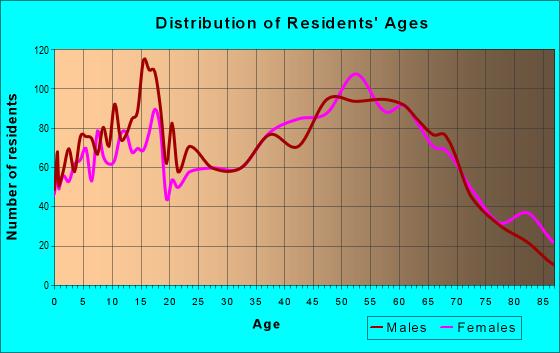
Males: 5,598
(50.6%)
Females: 5,466
(49.4%)
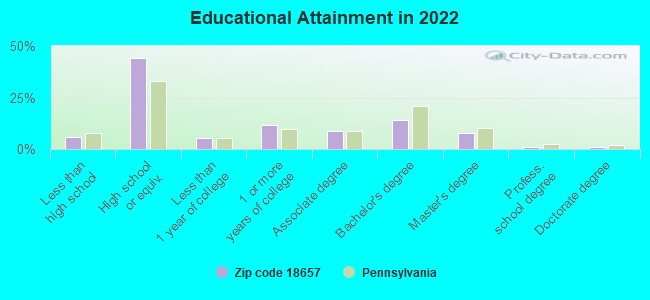
For population 25 years and over in 18657:
High school or higher: 93.6%
Bachelor's degree or higher: 24.1%
Graduate or professional degree: 10.0%
Unemployed: 3.2%
Mean travel time to work (commute): 24.9 minutes
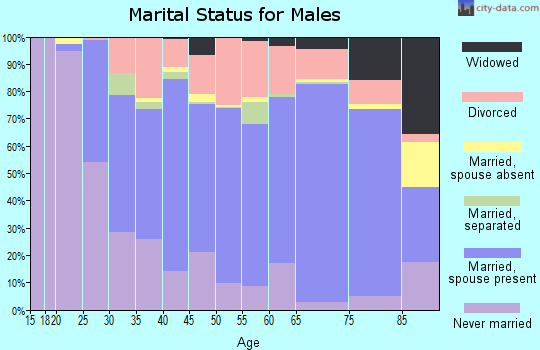
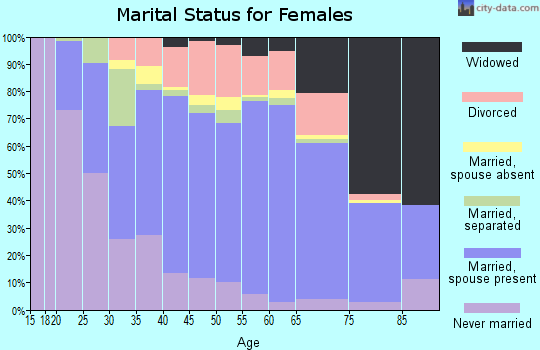
For population 15 years and over in 18657:
Never married: 29.1%
Now married: 53.0%
Separated: 1.1%
Widowed: 6.9%
Divorced: 9.9%
Zip code 18657 compared to state average:
Black race population percentage significantly below state average.
Hispanic race population percentage significantly below state average.
Median age above state average.
Foreign-born population percentage significantly below state average.
Length of stay since moving in significantly above state average.
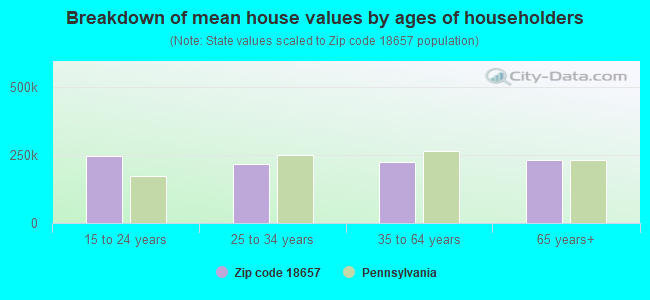
Estimated median house/condo value in 2022: $219,669
18657:
$219,669
Pennsylvania:
$245,500
According to our research of Pennsylvania and other state lists, there were 16 registered sex offenders living in 18657 zip code as of May 20, 2024. The ratio of all residents to sex offenders in zip code 18657 is 757 to 1. The ratio of registered sex offenders to all residents in this zip code is near the state average.
Median resident age:
This zip code:
45.7 years
Pennsylvania median age:
40.9 years
Average household size:
This zip code:
2.3 people
Pennsylvania:
2.4 people
Averages for the 2020 tax year for zip code 18657, filed in 2021:
Average Adjusted Gross Income (AGI) in 2020: $63,558 (Individual Income Tax Returns)
Here:
$63,558
State:
$75,707
Salary/wage: $50,272 (reported on 76.8% of returns)
Here:
$50,272
State:
$62,806
(% of AGI for various income ranges: 1089.9% for AGIs below $25k, 3242.1% for AGIs $25k-50k, 5953.7% for AGIs $50k-75k, 8382.2% for AGIs $75k-100k, 15590.5% for AGIs $100k-200k, 68832.5% for AGIs over 200k)
Taxable interest for individuals: $1,397 (reported on 30.6% of returns)
This zip code:
$1,397
Pennsylvania:
$1,633
(% of AGI for various income ranges: 15.3% for AGIs below $25k, 25.4% for AGIs $25k-50k, 36.3% for AGIs $50k-75k, 41.0% for AGIs $75k-100k, 185.0% for AGIs $100k-200k, 1782.5% for AGIs over 200k)
Ordinary dividends: $5,833 (reported on 25.5% of returns)
Here:
$5,833
State:
$7,382
(% of AGI for various income ranges: 39.9% for AGIs below $25k, 43.4% for AGIs $25k-50k, 115.6% for AGIs $50k-75k, 238.0% for AGIs $75k-100k, 464.8% for AGIs $100k-200k, 8970.0% for AGIs over 200k)
Net capital gain/loss in AGI: +$11,248 (reported on 18.7% of returns)
Here:
+$11,248
State:
+$23,522
(% of AGI for various income ranges: 18.5% for AGIs below $25k, 46.6% for AGIs $25k-50k, 121.3% for AGIs $50k-75k, 251.3% for AGIs $75k-100k, 594.8% for AGIs $100k-200k, 16270.0% for AGIs over 200k)
Profit/loss from business: +$15,337 (reported on 12.7% of returns)
Here:
+$15,337
State:
+$16,274
(% of AGI for various income ranges: 83.6% for AGIs below $25k, 145.0% for AGIs $25k-50k, 231.8% for AGIs $50k-75k, 394.5% for AGIs $75k-100k, 356.4% for AGIs $100k-200k, 9145.0% for AGIs over 200k)
Taxable individual retirement arrangement distribution: $23,547 (reported on 13.6% of returns)
18657:
$23,547
Pennsylvania:
$18,583
(% of AGI for various income ranges: 98.3% for AGIs below $25k, 163.2% for AGIs $25k-50k, 381.9% for AGIs $50k-75k, 824.2% for AGIs $75k-100k, 1333.9% for AGIs $100k-200k, 8172.5% for AGIs over 200k)
Total itemized deductions: $29,896 (reported on 4.2% of returns)
Here:
$29,896
State:
$34,850
(% of AGI for various income ranges: 100.9% for AGIs $25k-50k, 171.9% for AGIs $50k-75k, 223.2% for AGIs $75k-100k, 441.1% for AGIs $100k-200k, 4817.5% for AGIs over 200k)
Charity contributions: $11,124 (reported on 3.1% of returns)
Here:
$11,124
State:
$12,392
(% of AGI for various income ranges: 5.0% for AGIs $25k-50k, 21.3% for AGIs $50k-75k, 35.5% for AGIs $75k-100k, 115.2% for AGIs $100k-200k, 2645.0% for AGIs over 200k)
Taxes paid: $7,445 (reported on 4.0% of returns)
18657:
$7,445
State:
$8,200
(% of AGI for various income ranges: 17.6% for AGIs $25k-50k, 44.4% for AGIs $50k-75k, 59.2% for AGIs $75k-100k, 127.0% for AGIs $100k-200k, 960.0% for AGIs over 200k)
Earned income credit: $2,007 (reported on 12.9% of returns)
Here:
$2,007
State:
$2,100
(% of AGI for various income ranges: 70.9% for AGIs below $25k, 56.5% for AGIs $25k-50k)
Percentage of individuals using paid preparers for their 2020 taxes: 94.0%
Here:
94%
State:
92%
(% for various income ranges: 91.7% for AGIs below $25k, 94.7% for AGIs $25k-50k, 94.3% for AGIs $50k-75k, 95.0% for AGIs $75k-100k, 96.1% for AGIs $100k-200k, 100.0% for AGIs over 200k)
Averages for the 2012 tax year for zip code 18657, filed in 2013:
Average Adjusted Gross Income (AGI) in 2012: $55,887 (Individual Income Tax Returns)
Here:
$55,887
State:
$61,346
Salary/wage: $42,280 (reported on 80.5% of returns)
Here:
$42,280
State:
$51,902
(% of AGI for various income ranges: 70.0% for AGIs below $25k, 74.5% for AGIs $25k-50k, 75.9% for AGIs $50k-75k, 69.1% for AGIs $75k-100k, 63.1% for AGIs $100k-200k, 22.6% for AGIs over 200k)
Taxable interest for individuals: $1,295 (reported on 36.6% of returns)
This zip code:
$1,295
Pennsylvania:
$1,588
(% of AGI for various income ranges: 1.6% for AGIs below $25k, 0.7% for AGIs $25k-50k, 0.5% for AGIs $50k-75k, 0.5% for AGIs $75k-100k, 0.6% for AGIs $100k-200k, 1.5% for AGIs over 200k)
Ordinary dividends: $3,498 (reported on 29.8% of returns)
Here:
$3,498
State:
$5,827
(% of AGI for various income ranges: 2.6% for AGIs below $25k, 1.6% for AGIs $25k-50k, 1.1% for AGIs $50k-75k, 1.3% for AGIs $75k-100k, 2.2% for AGIs $100k-200k, 2.6% for AGIs over 200k)
Net capital gain/loss in AGI: +$7,638 (reported on 18.0% of returns)
Here:
+$7,638
State:
+$14,495
(% of AGI for various income ranges: 0.4% for AGIs $25k-50k, 0.7% for AGIs $50k-75k, 1.0% for AGIs $75k-100k, 2.4% for AGIs $100k-200k, 8.1% for AGIs over 200k)
Profit/loss from business: +$16,661 (reported on 12.3% of returns)
Here:
+$16,661
State:
+$16,268
(% of AGI for various income ranges: 6.1% for AGIs below $25k, 2.9% for AGIs $25k-50k, 2.8% for AGIs $50k-75k, 2.2% for AGIs $75k-100k, 4.7% for AGIs $100k-200k, 4.0% for AGIs over 200k)
Taxable individual retirement arrangement distribution: $22,154 (reported on 14.5% of returns)
18657:
$22,154
Pennsylvania:
$14,550
(% of AGI for various income ranges: 5.7% for AGIs below $25k, 4.8% for AGIs $25k-50k, 4.5% for AGIs $50k-75k, 6.7% for AGIs $75k-100k, 7.5% for AGIs $100k-200k, 4.5% for AGIs over 200k)
Total itemized deductions: $18,979 (17% of AGI, reported on 24.3% of returns)
Here:
$18,979
State:
$23,538
Here:
16.6% of AGI
State:
18.4% of AGI
(% of AGI for various income ranges: 6.3% for AGIs below $25k, 6.8% for AGIs $25k-50k, 7.9% for AGIs $50k-75k, 9.4% for AGIs $75k-100k, 10.7% for AGIs $100k-200k, 6.5% for AGIs over 200k)
Charity contributions: $3,391 (reported on 17.7% of returns)
Here:
$3,391
State:
$4,025
(% of AGI for various income ranges: 0.5% for AGIs below $25k, 0.6% for AGIs $25k-50k, 0.7% for AGIs $50k-75k, 0.9% for AGIs $75k-100k, 1.4% for AGIs $100k-200k, 1.7% for AGIs over 200k)
Taxes paid: $7,347 (reported on 24.3% of returns)
18657:
$7,347
State:
$9,982
(% of AGI for various income ranges: 1.3% for AGIs below $25k, 1.9% for AGIs $25k-50k, 2.7% for AGIs $50k-75k, 3.5% for AGIs $75k-100k, 4.5% for AGIs $100k-200k, 3.5% for AGIs over 200k)
Earned income credit: $1,859 (reported on 13.9% of returns)
Here:
$1,859
State:
$2,106
(% of AGI for various income ranges: 4.4% for AGIs below $25k, 0.8% for AGIs $25k-50k)
Percentage of individuals using paid preparers for their 2012 taxes: 57.7%
Here:
58%
State:
53%
(% for various income ranges: 52.8% for AGIs below $25k, 56.1% for AGIs $25k-50k, 58.9% for AGIs $50k-75k, 64.9% for AGIs $75k-100k, 63.8% for AGIs $100k-200k, 90.9% for AGIs over 200k)
Averages for the 2004 tax year for zip code 18657, filed in 2005:
Average Adjusted Gross Income (AGI) in 2004: $40,863 (Individual Income Tax Returns)
Here:
$40,863
State:
$48,049
Salary/wage: $34,812 (reported on 82.6% of returns)
Here:
$34,812
State:
$42,646
(% of AGI for various income ranges: 91.8% for AGIs below $10k, 73.4% for AGIs $10k-25k, 75.6% for AGIs $25k-50k, 77.8% for AGIs $50k-75k, 74.2% for AGIs $75k-100k, 54.6% for AGIs over 100k)
Taxable interest for individuals: $1,109 (reported on 51.2% of returns)
This zip code:
$1,109
Pennsylvania:
$1,657
(% of AGI for various income ranges: 6.3% for AGIs below $10k, 2.5% for AGIs $10k-25k, 1.3% for AGIs $25k-50k, 1.0% for AGIs $50k-75k, 0.6% for AGIs $75k-100k, 1.5% for AGIs over 100k)
Taxable dividends: $2,678 (reported on 33.9% of returns)
Here:
$2,678
State:
$3,566
(% of AGI for various income ranges: 5.8% for AGIs below $10k, 1.8% for AGIs $10k-25k, 1.5% for AGIs $25k-50k, 1.3% for AGIs $50k-75k, 1.8% for AGIs $75k-100k, 3.8% for AGIs over 100k)
Net capital gain/loss: +$4,083 (reported on 21.3% of returns)
Here:
+$4,083
State:
+$9,716
(% of AGI for various income ranges: -1.8% for AGIs below $10k, 0.8% for AGIs $10k-25k, 0.7% for AGIs $25k-50k, 1.2% for AGIs $50k-75k, 1.5% for AGIs $75k-100k, 5.3% for AGIs over 100k)
Profit/loss from business: +$13,974 (reported on 13.9% of returns)
Here:
+$13,974
State:
+$14,267
(% of AGI for various income ranges: 7.7% for AGIs below $10k, 7.2% for AGIs $10k-25k, 4.4% for AGIs $25k-50k, 1.7% for AGIs $50k-75k, 4.1% for AGIs $75k-100k, 7.0% for AGIs over 100k)
IRA payment deduction: $2,933 (reported on 2.9% of returns)
18657:
$2,933
Pennsylvania:
$2,903
(% of AGI for various income ranges: 0.3% for AGIs $10k-25k, 0.4% for AGIs $25k-50k, 0.2% for AGIs $50k-75k, 0.1% for AGIs $75k-100k, 0.2% for AGIs over 100k)
Self-employed pension: $10,737 (reported on 0.3% of returns)
Here:
$10,737
Pennsylvania:
$14,674
Total itemized deductions: $15,258 (20% of AGI, reported on 27.3% of returns)
Here:
$15,258
State:
$18,804
Here:
19.7% of AGI
State:
19.5% of AGI
(% of AGI for various income ranges: 6.9% for AGIs below $10k, 6.4% for AGIs $10k-25k, 9.0% for AGIs $25k-50k, 11.6% for AGIs $50k-75k, 12.8% for AGIs $75k-100k, 10.0% for AGIs over 100k)
Charity contributions deductions: $2,361 (3% of AGI, reported on 23.2% of returns)
Here:
$2,361
State:
$3,337
Here:
2.9% of AGI
State:
3.3% of AGI
(% of AGI for various income ranges: 0.2% for AGIs below $10k, 0.6% for AGIs $10k-25k, 0.8% for AGIs $25k-50k, 1.1% for AGIs $50k-75k, 1.5% for AGIs $75k-100k, 2.3% for AGIs over 100k)
Total tax: $5,842 (reported on 74.7% of returns)
18657:
$5,842
State:
$8,008
(% of AGI for various income ranges: 2.5% for AGIs below $10k, 4.8% for AGIs $10k-25k, 7.0% for AGIs $25k-50k, 8.6% for AGIs $50k-75k, 10.9% for AGIs $75k-100k, 18.1% for AGIs over 100k)
Earned income credit: $1,552 (reported on 12.0% of returns)
Here:
$1,552
State:
$1,643
Percentage of individuals using paid preparers for their 2004 taxes: 58.6%
Here:
59%
State:
56%
(% for various income ranges: 49.8% for AGIs below $10k, 60.5% for AGIs $10k-25k, 58.7% for AGIs $25k-50k, 63.4% for AGIs $50k-75k, 65.2% for AGIs $75k-100k, 64.0% for AGIs over 100k)
Likely homosexual households (counted as self-reported same-sex unmarried-partner households)
Lesbian couples: 0.1% of all households
Gay men: 0.0% of all households
Household received Food Stamps/SNAP in the past 12 months: 816 Household did not receive Food Stamps/SNAP in the past 12 months: 3,841
Women who had a birth in the past 12 months: 147 (84 now married, 59 unmarried) Women who did not have a birth in the past 12 months: 2,019 (888 now married, 1,127 unmarried)
Housing units in zip code 18657 with a mortgage: 1,749 (200 second mortgage, 134 both second mortgage and home equity loan) Houses without a mortgage: 113
Median monthly owner costs for units with a mortgage: $1,385 Median monthly owner costs for units without a mortgage: $617
Residents with income below the poverty level in 2022:
This zip code:
10.7%
Whole state:
11.8%
Residents with income below 50% of the poverty level in 2022:
This zip code:
6.9%
Whole state:
6.1%
Median number of rooms in houses and condos:
Here:
6.8
State:
6.8
Median number of rooms in apartments:
Here:
5.4
State:
4.3
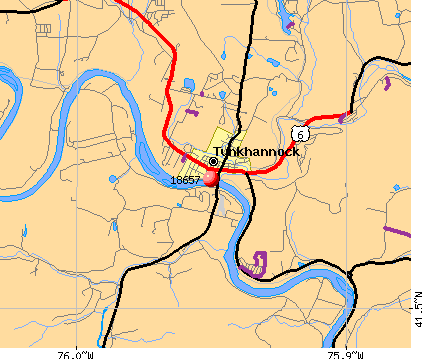
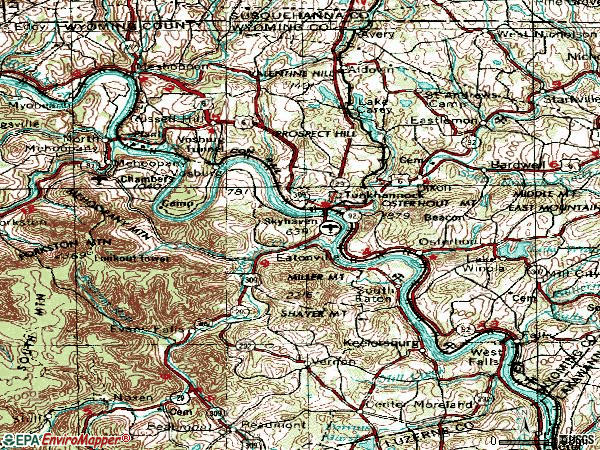
Notable locations in this zip code not listed on our city pages
Notable locations in zip code 18657: Lemon (A), Shadow Brook Golf Course (B), Finchs Corners (C), Thurston (D), Towne Plaza (E), Route 6 Plaza (F), Charles Brothers Plaza (G), Village Center (H), Mehoopany Station (I), Saint Andrews Camp (J), Whites Ferry (K), Dixon (L), Maynard Hill (M), Triton Hose Company (N), Northmoreland Township Volunteer Fire Company (O), Lake Carey Volunteer Fire Company (P). Display/hide their locations on the map
Lakes, reservoirs, and swamps: Lake Carey (A), Jayne Pond (B), Racavitch Pond (C), Dorn Blazer Pond (D), Cruver Pond (E), Places Pond (F), Bartron Pond (G), Creamery Pond (H). Display/hide their locations on the map
Streams, rivers, and creeks: Roaring Run (A), Sugar Hollow Creek (B), Newton Run (C), Moneypenny Creek (D), Tunkhannock Creek (E), Taques Creek (F), Swale Brook (G), Fitch Creek (H), Martin Creek (I). Display/hide their locations on the map
1,214 married couples with children.
559 single-parent households (122 men, 437 women).
96.4% of residents of 18657 zip code speak English at home.
1.7% of residents speak Spanish at home (85% very well, 10% well, 5% not well).
1.1% of residents speak other Indo-European language at home (77% very well, 11% well, 12% not well).
0.4% of residents speak Asian or Pacific Island language at home (100% very well).
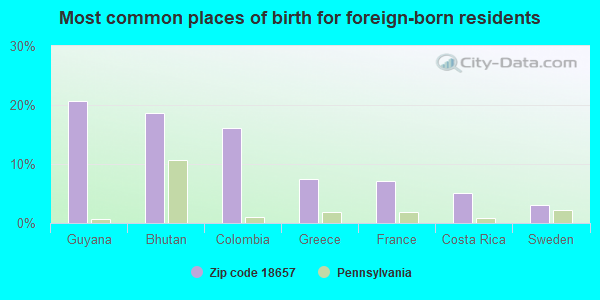
Foreign born population: 198 (1.8%) (42.7% of them are naturalized citizens)
This zip code:
1.8%
Whole state:
7.5%
21%Guyana
19%Bhutan
16%Colombia
8%Greece
7%France
5%Costa Rica
3%Sweden
21%German
14%English
12%American
11%Irish
9%Polish
4%Italian
3%European
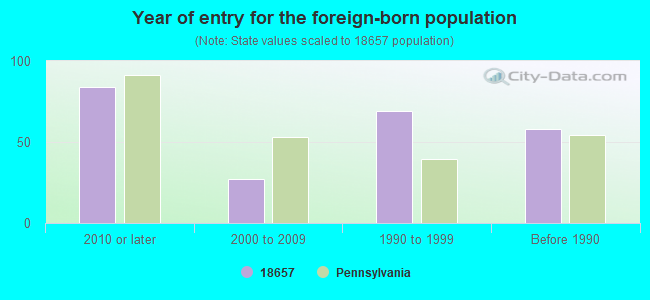
Year of entry for the foreign-born population
842010 or later
272000 to 2009
691990 to 1999
58Before 1990
Facilities with environmental interests located in this zip code:
87 SALES & SERVICE (RD #3 in TUNKHANNOCK, PA)
Small Quantity Generators, between 100 kg and 1000 kg of hazardous waste/month (Resource Conservation and Recovery Act (tracking hazardous waste)) - notification Organizations: OPERNAME (CONTACT/OPERATOR)
, ROARK, MEREDITH (CONTACT/OWNER)
AMERICAN ASPHALT PAVING (RD2 in TUNKHANNOCK, PA)
Small Quantity Generators, between 100 kg and 1000 kg of hazardous waste/month (Resource Conservation and Recovery Act (tracking hazardous waste)) - notification Organizations: OPERNAME (CONTACT/OPERATOR)
, EAST FALLS SAND AND GRAVEL (CONTACT/OWNER)
AT & T (RT 10 in THOMAS HILL-ELVERSON, PA)
Small Quantity Generators, between 100 kg and 1000 kg of hazardous waste/month (Resource Conservation and Recovery Act (tracking hazardous waste)) - notification Organizations: OPERNAME (CONTACT/OPERATOR)
, AT & T COMMUNICATIONS (CONTACT/OWNER)
AT & T-BEAUMONT (LOWER ROAD in TUNKHANNOCK, PA)
Small Quantity Generators, between 100 kg and 1000 kg of hazardous waste/month (Resource Conservation and Recovery Act (tracking hazardous waste)) - notification Organizations: OPERNAME (CONTACT/OPERATOR)
, AT & T OF PENNSYLVANIA (CONTACT/OWNER)
ATLANTIC SERVICE STATION (BRIDGE & TIOGA ST in TUNKHANNOCK, PA)
Conditionally Exempt Small Quantity Generators, less than 100 kg/month of hazardous waste (Resource Conservation and Recovery Act (tracking hazardous waste)) - notification Organizations: OPERNAME (CONTACT/OPERATOR)
, ATLANTIC REFINING & MARKETING (CONTACT/OWNER)
BERNIE S AUTO REPAIR INC (RTE 92 SOUTH in OSTERHOUT, PA)
Small Quantity Generators, between 100 kg and 1000 kg of hazardous waste/month (Resource Conservation and Recovery Act (tracking hazardous waste)) - notification Organizations: OPERNAME (CONTACT/OPERATOR)
, SCRANTA BERNARD C (CONTACT/OWNER)
AMER ASPHALT PAVING /EATON PLT (SAND BANK RD in TUNKHANNOCK, PA)
AIR MAJOR (AIRS/AFS) Business SIC classification: CONSTRUCTION SAND AND GRAVEL
Housing units lacking complete plumbing facilities: 0.7% Housing units lacking complete kitchen facilities: 2.1%
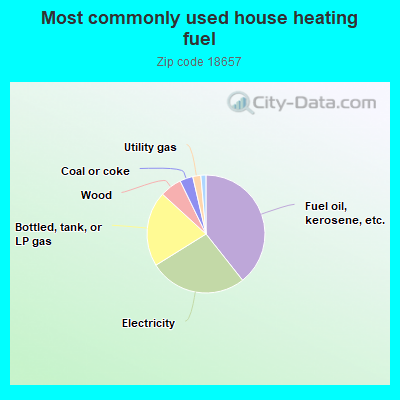
39.4%Fuel oil, kerosene, etc.
26.8%Electricity
20.7%Bottled, tank, or LP gas
6.0%Wood
3.6%Coal or coke
2.2%Utility gas
1.4%Other fuel
Population in 1990: 9,921. Population change in the 1990s: +2,501 (+25.2%).
Place of birth for U.S.-born residents:
This state: 8,537
Northeast: 1,304
Midwest: 266
South: 485
West: 203
65% of the 18657 zip code residents lived in the same house 5 years ago. Out of people who lived in different houses, 56% lived in this county. Out of people who lived in different counties, 50% lived in Pennsylvania.
92% of the 18657 zip code residents lived in the same house 1 year ago. Out of people who lived in different houses, 51% moved from this county. Out of people who lived in different houses, 31% moved from different county within same state. Out of people who lived in different houses, 17% moved from different state. Out of people who lived in different houses, 1% moved from abroad.
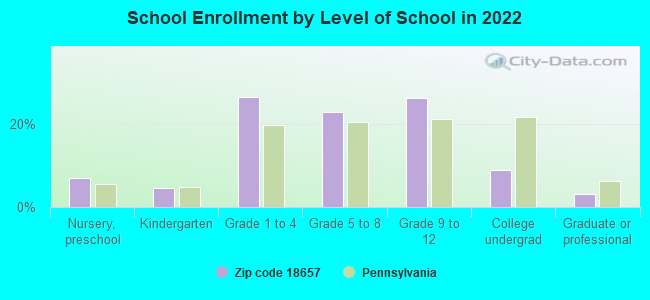
Private vs. public school enrollment:
Students in private schools in grades 1 to 8 (elementary and middle school): 123
Here:
13.1%
Pennsylvania:
15.7%
Students in private schools in grades 9 to 12 (high school): 46
Here:
9.2%
Pennsylvania:
13.4%
Students in private undergraduate colleges: 46
Here:
27.3%
Pennsylvania:
39.8%
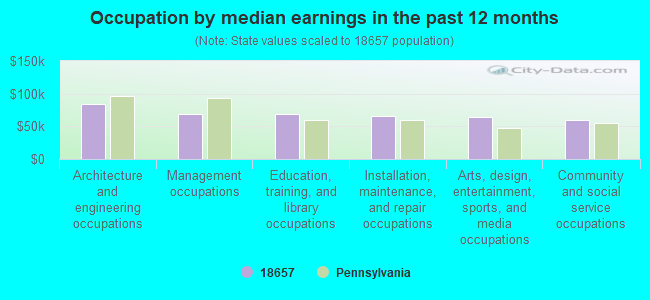
Occupation by median earnings in the past 12 months ($)
84,308Architecture and engineering occupations
68,693Management occupations
68,620Education, training, and library occupations
65,347Installation, maintenance, and repair occupations
65,041Arts, design, entertainment, sports, and media occupations
59,794Community and social service occupations
Companies with federal contracts located in this zip code:
BARTRON SUPPLY INC (ROUTE 92 SOUTH in TUNKHANNOCK, PA; small business)
$14,995 with Army for ADP Systems Development Services. Signed on 2004-07-19. Completion date: 2004-08-19.
LABS, MARK T (2 TIMBER LN in TUNKHANNOCK, PA; small business) : $12,548 in 8 contractsfrom 2004 to 2006
Contracts for Aircraft Air Conditioning, Heating, and Pressurizing Equipment, Miscellaneous Power Transmission Equipment by Army Signed by year:2000: $0; 2001: $0; 2002: $0; 2003: $0; 2004: $6,180; 2005: $1,700; 2006: $4,668.
Biggest contracts:
$3,500 with Army for Aircraft Air Conditioning, Heating, and Pressurizing Equipment. Signed on 2004-04-09. Completion date: 2004-05-14.
$2,680 with Army for Miscellaneous Power Transmission Equipment. Signed on 2004-04-27. Completion date: 2004-05-18.
$1,275, same as above.Signed on 2006-04-10. Completion date: 2006-04-24.
$1,275, same as above.Signed on 2006-02-08. Completion date: 2006-02-28.
MICHAEL S MARKOVITZ (11 SR 309 S STE 2 in TUNKHANNOCK, PA; small business)
$7,320 with Army for Electrical and Electronic Properties Measuring and Testing Instruments. Signed on 2005-03-22. Completion date: 2005-04-16.
Top industries in this zip code by the number of employees in 2005:
Health Care and Social Assistance: General Medical and Surgical Hospitals (250-499 employees: 1 establishment)
Health Care and Social Assistance: Nursing Care Facilities (100-249: 1, 50-99: 1, 10-19: 1)
111 people in nursing facilities/skilled-nursing facilities
58 people in local jails and other municipal confinement facilities
50 people in residential treatment centers for juveniles (non-correctional)
19 people in other noninstitutional facilities
11 people in group homes intended for adults
5 people in group homes for juveniles (non-correctional)
5 people in workers' group living quarters and job corps centers
People in group quarters in 2000:
150 people in nursing homes
92 people in residential treatment centers for emotionally disturbed children
53 people in local jails and other confinement facilities (including police lockups)
40 people in other noninstitutional group quarters
20 people in other nonhousehold living situations
7 people in homes for the mentally retarded
4 people in homes for the physically handicapped
Fatal accident statistics in 2013:
Fatal accident count: 2
Vehicles involved in fatal accidents: 3
Fatal accidents caused by drunken drivers: 0
Fatalities: 2
Persons involved in fatal accidents: 4
Pedestrians involved in fatal accidents: 0
Fatal accident statistics in 2012:
Fatal accident count: 3
Vehicles involved in fatal accidents: 3
Fatal accidents caused by drunken drivers: 3
Fatalities: 3
Persons involved in fatal accidents: 7
Pedestrians involved in fatal accidents: 0
2004 - 2018 National Fire Incident Reporting System (NFIRS) incidents
According to the data from the years 2004 - 2018 the average number of fire incidents per year is 24. The highest number of fires - 83 took place in 2017, and the least - 0 in 2006. The data has a rising trend.
When looking into fire subcategories, the most incidents belonged to: Structure Fires (48.3%), and Outside Fires (37.9%).
Fire incident types reported to NFIRS in Zip Code 18657


 Nearest zip codes: 18625, 18615, 18630, 18844, 18618, 18612.
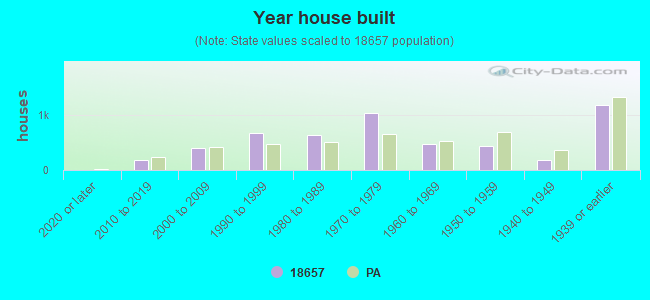


 According to the data from the years 2004 - 2018 the average number of fire incidents per year is 24. The highest number of fires - 83 took place in 2017, and the least - 0 in 2006. The data has a rising trend.
 When looking into fire subcategories, the most incidents belonged to: Structure Fires (48.3%), and Outside Fires (37.9%).