Estimated zip code population in 2022: 2,736 Zip code population in 2010: 3,267 Zip code population in 2000: 3,367
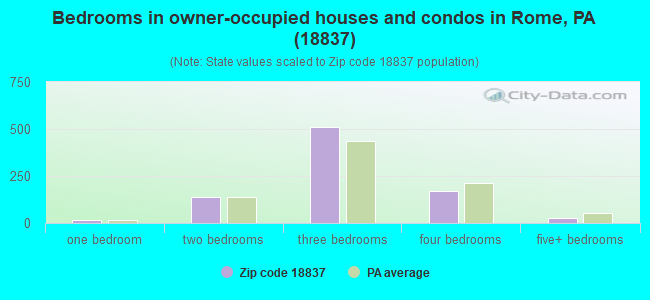
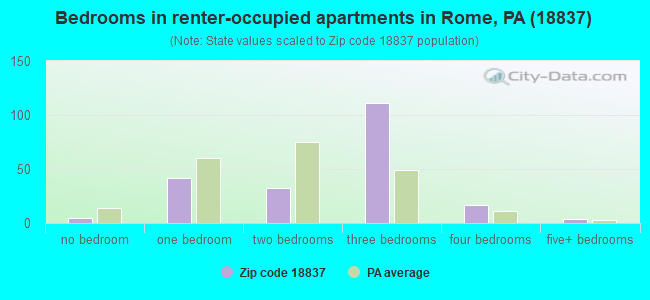
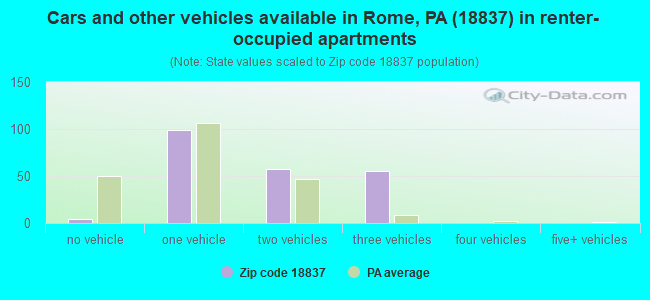
Houses and condos: 1,323 Renter-occupied apartments: 215
% of renters here:
20%
State:
31%
March 2022 cost of living index in zip code 18837: 92.2 (less than average, U.S. average is 100)
Land area: 90.1 sq. mi. Water area: 0.5 sq. mi.
Population density: 30 people per square mile
(very low).
OSM Map
General Map
Google Map
MSN Map
OSM Map
General Map
Google Map
MSN Map
OSM Map
General Map
Google Map
MSN Map
OSM Map
General Map
Google Map
MSN Map
Please wait while loading the map...
Real estate property taxes paid for housing units in 2022:
This zip code:
0.8% ($1,471)
Pennsylvania:
1.3% ($3,094)
Median real estate property taxes paid for housing units with mortgages in 2022: $1,770 (0.9%) Median real estate property taxes paid for housing units with no mortgage in 2022: $1,377 (0.8%)
Business Search- 14 Million verified businesses
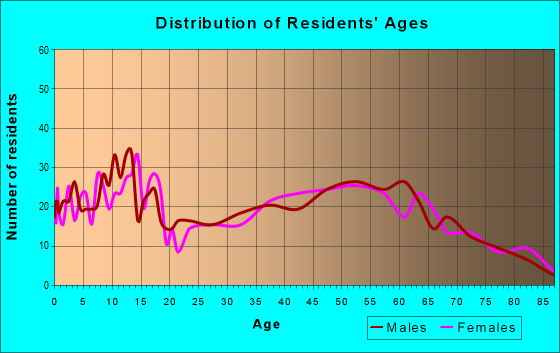
Males: 1,310
(47.9%)
Females: 1,425
(52.1%)
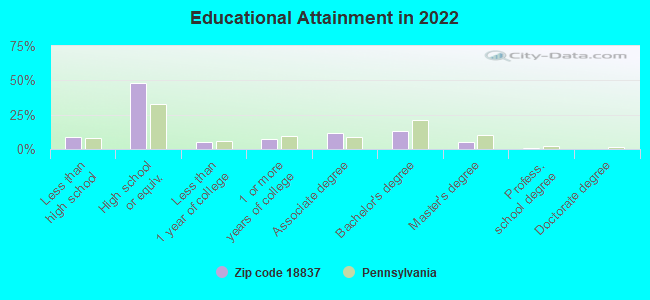
For population 25 years and over in 18837:
High school or higher: 90.5%
Bachelor's degree or higher: 19.6%
Graduate or professional degree: 6.8%
Unemployed: 2.7%
Mean travel time to work (commute): 28.4 minutes
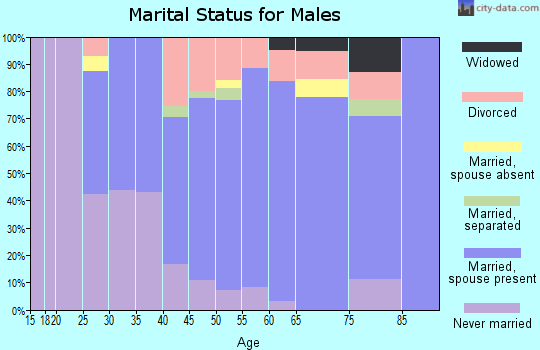
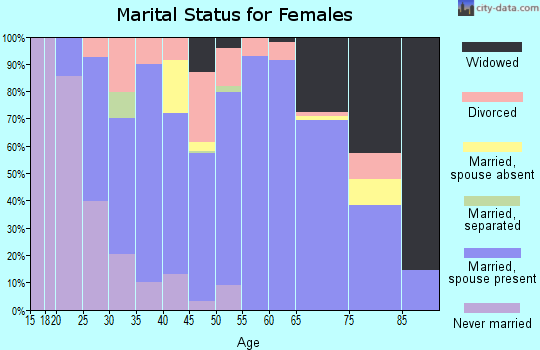
For population 15 years and over in 18837:
Never married: 26.9%
Now married: 53.3%
Separated: 2.3%
Widowed: 5.3%
Divorced: 12.2%
Zip code 18837 compared to state average:
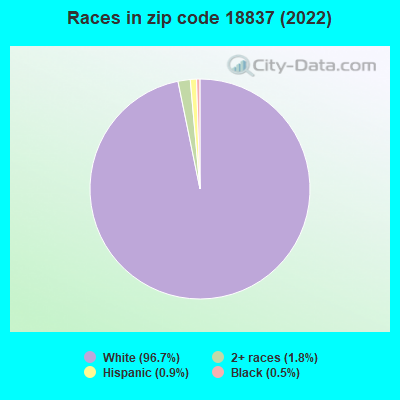
Black race population percentage significantly below state average.
Hispanic race population percentage significantly below state average.
Foreign-born population percentage significantly below state average.
Renting percentage below state average.
Length of stay since moving in significantly above state average.
Number of college students below state average.
Percentage of population with a bachelor's degree or higher below state average.
Averages for the 2020 tax year for zip code 18837, filed in 2021:
Average Adjusted Gross Income (AGI) in 2020: $50,768 (Individual Income Tax Returns)
Here:
$50,768
State:
$75,707
Salary/wage: $45,852 (reported on 75.5% of returns)
Here:
$45,852
State:
$62,806
(% of AGI for various income ranges: 1046.9% for AGIs below $25k, 3451.7% for AGIs $25k-50k, 6238.1% for AGIs $50k-75k, 8947.8% for AGIs $75k-100k, 17065.0% for AGIs $100k-200k)
Taxable interest for individuals: $957 (reported on 33.1% of returns)
This zip code:
$957
Pennsylvania:
$1,633
(% of AGI for various income ranges: 13.1% for AGIs below $25k, 37.6% for AGIs $25k-50k, 63.7% for AGIs $50k-75k, 27.8% for AGIs $75k-100k, 166.0% for AGIs $100k-200k)
Ordinary dividends: $3,704 (reported on 18.7% of returns)
Here:
$3,704
State:
$7,382
(% of AGI for various income ranges: 39.0% for AGIs below $25k, 32.4% for AGIs $25k-50k, 28.7% for AGIs $50k-75k, 115.6% for AGIs $75k-100k, 606.0% for AGIs $100k-200k)
Net capital gain/loss in AGI: +$9,529 (reported on 12.2% of returns)
Here:
+$9,529
State:
+$23,522
(% of AGI for various income ranges: 10.3% for AGIs below $25k, 98.3% for AGIs $25k-50k, 123.8% for AGIs $50k-75k, 386.7% for AGIs $75k-100k, 759.0% for AGIs $100k-200k)
Profit/loss from business: +$13,290 (reported on 14.4% of returns)
Here:
+$13,290
State:
+$16,274
(% of AGI for various income ranges: 130.7% for AGIs below $25k, 61.0% for AGIs $25k-50k, 341.2% for AGIs $50k-75k, 335.6% for AGIs $75k-100k, 1254.0% for AGIs $100k-200k)
Taxable individual retirement arrangement distribution: $12,735 (reported on 12.2% of returns)
18837:
$12,735
Pennsylvania:
$18,583
(% of AGI for various income ranges: 82.8% for AGIs below $25k, 140.7% for AGIs $25k-50k, 440.0% for AGIs $50k-75k, 813.0% for AGIs $100k-200k)
Total itemized deductions: $26,525 (reported on 2.9% of returns)
Here:
$26,525
State:
$34,850
(% of AGI for various income ranges: 1178.9% for AGIs $75k-100k)
Charity contributions: $10,950 (reported on 1.4% of returns)
Here:
$10,950
State:
$12,392
(% of AGI for various income ranges: 136.9% for AGIs $50k-75k)
Taxes paid: $6,050 (reported on 2.9% of returns)
18837:
$6,050
State:
$8,200
(% of AGI for various income ranges: 268.9% for AGIs $75k-100k)
Earned income credit: $2,341 (reported on 15.8% of returns)
Here:
$2,341
State:
$2,100
(% of AGI for various income ranges: 100.0% for AGIs below $25k, 77.6% for AGIs $25k-50k)
Percentage of individuals using paid preparers for their 2020 taxes: 95.0%
Here:
95%
State:
92%
(% for various income ranges: 93.5% for AGIs below $25k, 97.3% for AGIs $25k-50k, 95.7% for AGIs $50k-75k, 92.9% for AGIs $75k-100k, 94.7% for AGIs $100k-200k)
Averages for the 2012 tax year for zip code 18837, filed in 2013:
Average Adjusted Gross Income (AGI) in 2012: $45,359 (Individual Income Tax Returns)
Here:
$45,359
State:
$61,346
Salary/wage: $38,827 (reported on 77.8% of returns)
Here:
$38,827
State:
$51,902
(% of AGI for various income ranges: 61.4% for AGIs below $25k, 76.5% for AGIs $25k-50k, 75.2% for AGIs $50k-75k, 75.9% for AGIs $75k-100k, 49.5% for AGIs $100k-200k)
Taxable interest for individuals: $934 (reported on 39.3% of returns)
This zip code:
$934
Pennsylvania:
$1,588
(% of AGI for various income ranges: 2.7% for AGIs below $25k, 0.6% for AGIs $25k-50k, 0.5% for AGIs $50k-75k, 0.4% for AGIs $75k-100k, 0.7% for AGIs $100k-200k)
Ordinary dividends: $1,939 (reported on 23.0% of returns)
Here:
$1,939
State:
$5,827
(% of AGI for various income ranges: 2.5% for AGIs below $25k, 0.4% for AGIs $25k-50k, 0.8% for AGIs $50k-75k, 0.9% for AGIs $75k-100k, 1.1% for AGIs $100k-200k)
Net capital gain/loss in AGI: +$9,527 (reported on 16.3% of returns)
Here:
+$9,527
State:
+$14,495
(% of AGI for various income ranges: 0.7% for AGIs below $25k, 0.6% for AGIs $25k-50k, 2.4% for AGIs $50k-75k, 0.8% for AGIs $75k-100k, 8.7% for AGIs $100k-200k)
Profit/loss from business: +$11,913 (reported on 17.0% of returns)
Here:
+$11,913
State:
+$16,268
(% of AGI for various income ranges: 6.8% for AGIs below $25k, 4.3% for AGIs $25k-50k, 4.7% for AGIs $50k-75k, 3.4% for AGIs $75k-100k, 4.2% for AGIs $100k-200k)
Taxable individual retirement arrangement distribution: $8,833 (reported on 11.1% of returns)
18837:
$8,833
Pennsylvania:
$14,550
(% of AGI for various income ranges: 4.7% for AGIs below $25k, 1.8% for AGIs $25k-50k, 2.1% for AGIs $50k-75k, 4.9% for AGIs $75k-100k)
Total itemized deductions: $18,418 (24% of AGI, reported on 16.3% of returns)
Here:
$18,418
State:
$23,538
Here:
23.7% of AGI
State:
18.4% of AGI
(% of AGI for various income ranges: 7.0% for AGIs below $25k, 5.6% for AGIs $25k-50k, 5.0% for AGIs $50k-75k, 6.0% for AGIs $75k-100k, 8.8% for AGIs $100k-200k)
Charity contributions: $3,850 (reported on 11.9% of returns)
Here:
$3,850
State:
$4,025
(% of AGI for various income ranges: 0.9% for AGIs $25k-50k, 0.5% for AGIs $50k-75k, 0.4% for AGIs $75k-100k, 2.2% for AGIs $100k-200k)
Taxes paid: $5,614 (reported on 16.3% of returns)
18837:
$5,614
State:
$9,982
(% of AGI for various income ranges: 1.0% for AGIs below $25k, 1.2% for AGIs $25k-50k, 1.6% for AGIs $50k-75k, 1.8% for AGIs $75k-100k, 3.4% for AGIs $100k-200k)
Earned income credit: $2,161 (reported on 17.0% of returns)
Here:
$2,161
State:
$2,106
(% of AGI for various income ranges: 4.7% for AGIs below $25k, 1.5% for AGIs $25k-50k)
Percentage of individuals using paid preparers for their 2012 taxes: 68.1%
Here:
68%
State:
53%
(% for various income ranges: 61.8% for AGIs below $25k, 65.7% for AGIs $25k-50k, 77.3% for AGIs $50k-75k, 75.0% for AGIs $75k-100k, 81.8% for AGIs $100k-200k)
Averages for the 2004 tax year for zip code 18837, filed in 2005:
Average Adjusted Gross Income (AGI) in 2004: $33,742 (Individual Income Tax Returns)
Here:
$33,742
State:
$48,049
Salary/wage: $31,634 (reported on 79.1% of returns)
Here:
$31,634
State:
$42,646
(% of AGI for various income ranges: 97.8% for AGIs below $10k, 68.3% for AGIs $10k-25k, 78.2% for AGIs $25k-50k, 83.8% for AGIs $50k-75k, 82.3% for AGIs $75k-100k, 44.8% for AGIs over 100k)
Taxable interest for individuals: $957 (reported on 46.9% of returns)
This zip code:
$957
Pennsylvania:
$1,657
(% of AGI for various income ranges: 8.1% for AGIs below $10k, 2.6% for AGIs $10k-25k, 1.1% for AGIs $25k-50k, 1.0% for AGIs $50k-75k, 0.2% for AGIs $75k-100k, 1.3% for AGIs over 100k)
Taxable dividends: $1,225 (reported on 24.8% of returns)
Here:
$1,225
State:
$3,566
(% of AGI for various income ranges: 3.4% for AGIs below $10k, 1.6% for AGIs $10k-25k, 0.8% for AGIs $25k-50k, 0.5% for AGIs $50k-75k, 0.6% for AGIs $75k-100k, 1.1% for AGIs over 100k)
Net capital gain/loss: +$3,959 (reported on 18.0% of returns)
Here:
+$3,959
State:
+$9,716
(% of AGI for various income ranges: 4.5% for AGIs below $10k, 1.5% for AGIs $10k-25k, 0.9% for AGIs $25k-50k, 0.2% for AGIs $50k-75k, 0.4% for AGIs $75k-100k, 9.7% for AGIs over 100k)
Profit/loss from business: +$8,734 (reported on 18.5% of returns)
Here:
+$8,734
State:
+$14,267
(% of AGI for various income ranges: 12.5% for AGIs below $10k, 6.5% for AGIs $10k-25k, 4.5% for AGIs $25k-50k, 2.8% for AGIs $50k-75k, 10.9% for AGIs $75k-100k)
IRA payment deduction: $2,474 (reported on 2.8% of returns)
18837:
$2,474
Pennsylvania:
$2,903
Total itemized deductions: $13,208 (19% of AGI, reported on 13.6% of returns)
Here:
$13,208
State:
$18,804
Here:
19.1% of AGI
State:
19.5% of AGI
(% of AGI for various income ranges: 4.0% for AGIs $10k-25k, 3.9% for AGIs $25k-50k, 6.3% for AGIs $50k-75k, 7.6% for AGIs $75k-100k, 6.5% for AGIs over 100k)
Charity contributions deductions: $2,799 (4% of AGI, reported on 10.7% of returns)
Here:
$2,799
State:
$3,337
Here:
4.1% of AGI
State:
3.3% of AGI
(% of AGI for various income ranges: 0.3% for AGIs $10k-25k, 0.6% for AGIs $25k-50k, 1.0% for AGIs $50k-75k, 1.6% for AGIs $75k-100k, 1.2% for AGIs over 100k)
Total tax: $4,220 (reported on 70.3% of returns)
18837:
$4,220
State:
$8,008
(% of AGI for various income ranges: 4.2% for AGIs below $10k, 4.1% for AGIs $10k-25k, 6.4% for AGIs $25k-50k, 8.3% for AGIs $50k-75k, 10.8% for AGIs $75k-100k, 17.6% for AGIs over 100k)
Earned income credit: $1,719 (reported on 17.0% of returns)
Here:
$1,719
State:
$1,643
Percentage of individuals using paid preparers for their 2004 taxes: 70.1%
Here:
70%
State:
56%
(% for various income ranges: 63.5% for AGIs below $10k, 69.9% for AGIs $10k-25k, 74.1% for AGIs $25k-50k, 70.3% for AGIs $50k-75k, 75.3% for AGIs $75k-100k, 72.5% for AGIs over 100k)
Likely homosexual households (counted as self-reported same-sex unmarried-partner households)
Lesbian couples: 0.3% of all households
Gay men: 0.0% of all households
Household received Food Stamps/SNAP in the past 12 months: 80 Household did not receive Food Stamps/SNAP in the past 12 months: 992
Women who had a birth in the past 12 months: 49 (32 now married, 16 unmarried) Women who did not have a birth in the past 12 months: 548 (240 now married, 306 unmarried)
Housing units in zip code 18837 with a mortgage: 399 (33 second mortgage, 8 home equity loan, 18 both second mortgage and home equity loan) Houses without a mortgage: 14
Median monthly owner costs for units with a mortgage: $1,288 Median monthly owner costs for units without a mortgage: $500
Residents with income below the poverty level in 2022:
This zip code:
12.2%
Whole state:
11.8%
Residents with income below 50% of the poverty level in 2022:
This zip code:
4.8%
Whole state:
6.1%
Median number of rooms in houses and condos:
Here:
6.3
State:
6.8
Median number of rooms in apartments:
Here:
5.1
State:
4.3
Notable locations in this zip code not listed on our city pages
Notable locations in zip code 18837: Concklin Corners (A), Windham Township Volunteer Fire Company (B), Vigilante Engine Company 1 (C). Display/hide their locations on the map
Cemeteries: Windham Cemetery (1), North Orwell Cemetery (2), Hughes Cemetery (3), Jillson Cemetery (4), Orwell Valley Cemetery (5), Orwell Cemetery (6), Darling Cemetery (7). Display/hide their locations on the map
Streams, rivers, and creeks: Jerome Creek (A), Trout Stream (B), Trout Brook (C), Hicks Creek (D), Spring Run (E), South Creek (F), Little Falls Creek (G), Taylers Creek (H), Bullard Creek (I). Display/hide their locations on the map
352 married couples with children.
197 single-parent households (60 men, 137 women).
97.6% of residents of 18837 zip code speak English at home.
0.1% of residents speak Spanish at home (100% very well).
1.5% of residents speak other Indo-European language at home (62% very well, 38% well).
0.1% of residents speak Asian or Pacific Island language at home (67% very well, 33% not well).
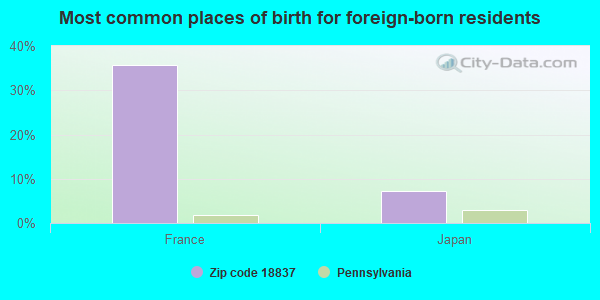
Foreign born population: 14 (0.5%) (93.1% of them are naturalized citizens)
This zip code:
0.5%
Whole state:
7.5%
36%France
7%Japan
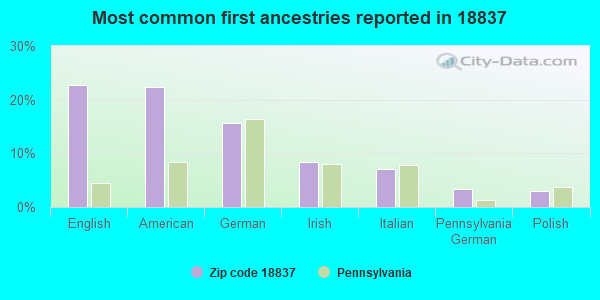
23%English
22%American
16%German
8%Irish
7%Italian
3%Pennsylvania German
3%Polish
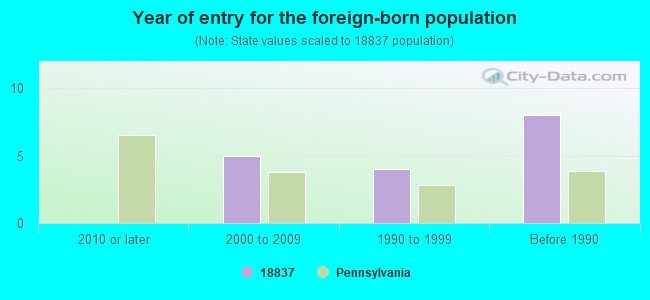
Year of entry for the foreign-born population
02010 or later
52000 to 2009
41990 to 1999
8Before 1990
Facilities with environmental interests located in this zip code:
ALLEGRO OIL & GAS INC (LEON PRINCE INJECTION FACILITY in ROME, PA)
(Integrated Compliance Information System) - ICIS-03-1989-1396, FORMAL ENFORCEMENT ACTION, ICIS-03-1996-0382,
Housing units lacking complete plumbing facilities: 4.0% Housing units lacking complete kitchen facilities: 4.8%
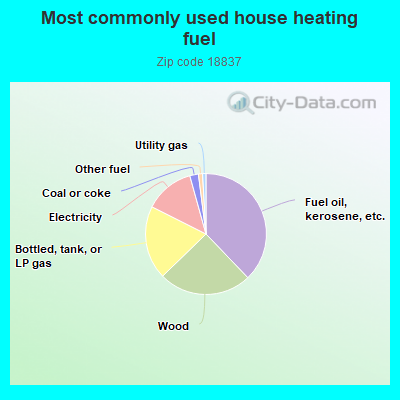
37.9%Fuel oil, kerosene, etc.
24.9%Wood
19.7%Bottled, tank, or LP gas
13.3%Electricity
2.3%Coal or coke
1.1%Other fuel
0.9%Utility gas
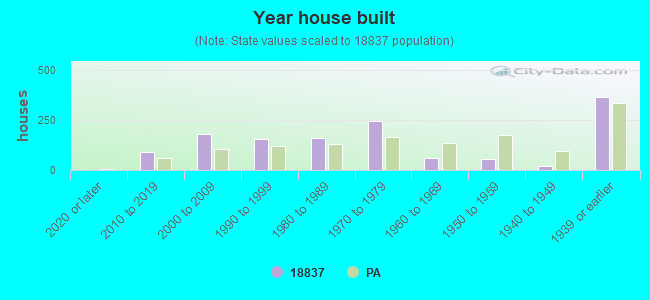
Population in 1990: 2,053. Population change in the 1990s: +1,314 (+64.0%).
Place of birth for U.S.-born residents:
This state: 1,894
Northeast: 604
Midwest: 53
South: 139
West: 25
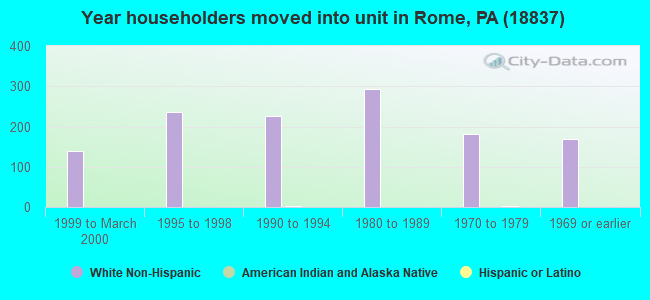
74% of the 18837 zip code residents lived in the same house 5 years ago. Out of people who lived in different houses, 64% lived in this county. Out of people who lived in different counties, 50% lived in Pennsylvania.
97% of the 18837 zip code residents lived in the same house 1 year ago. Out of people who lived in different houses, 76% moved from this county. Out of people who lived in different houses, 13% moved from different county within same state. Out of people who lived in different houses, 17% moved from different state.
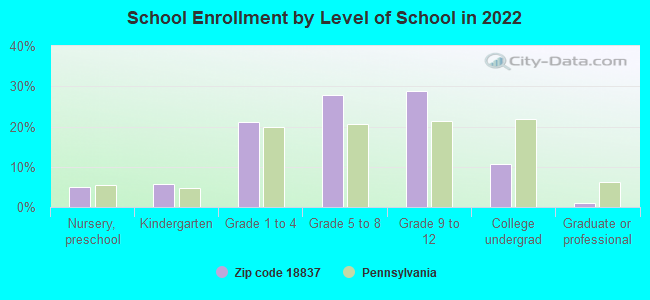
Private vs. public school enrollment:
Students in private schools in grades 1 to 8 (elementary and middle school): 42
Here:
15.3%
Pennsylvania:
15.7%
Students in private schools in grades 9 to 12 (high school): 20
Here:
12.6%
Pennsylvania:
13.4%
Students in private undergraduate colleges: 19
Here:
32.9%
Pennsylvania:
39.8%
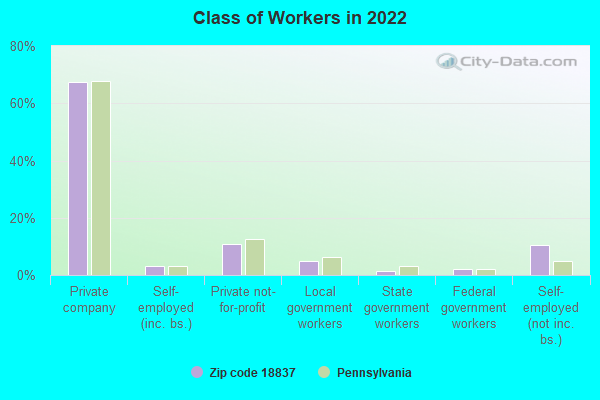
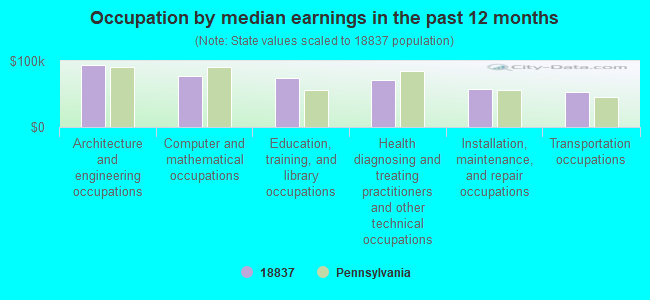
Occupation by median earnings in the past 12 months ($)
93,209Architecture and engineering occupations
76,593Computer and mathematical occupations
74,072Education, training, and library occupations
70,959Health diagnosing and treating practitioners and other technical occupations
57,673Installation, maintenance, and repair occupations
52,607Transportation occupations
Top industries in this zip code by the number of employees in 2005:
Construction: New Single-Family Housing Construction (except Operative Builders) (5-9 employees: 1 establishment, 1-4 employees: 1 establishment)
Professional, Scientific, and Technical Services: Veterinary Services (5-9: 1)
Wholesale Trade: Farm and Garden Machinery and Equipment Merchant Wholesalers (5-9: 1)
Information: Cable and Other Program Distribution (5-9: 1)
Construction: Residential Remodelers (1-4: 2)
People in group quarters in 2000:
6 people in nursing homes
Fatal accident statistics in 2012:
Fatal accident count: 1
Vehicles involved in fatal accidents: 2
Fatal accidents caused by drunken drivers: 0
Fatalities: 2
Persons involved in fatal accidents: 4
Pedestrians involved in fatal accidents: 0
Most common first names in zip code 18837 among deceased individuals
Name
Count
Lived (average)
John
19
72.0 years
Robert
16
67.6 years
William
15
75.3 years
Mary
11
82.4 years
Helen
10
86.0 years
Charles
10
76.0 years
Walter
9
80.7 years
George
9
74.2 years
Ruth
9
86.5 years
Carl
8
78.9 years
Most common last names in zip code 18837 among deceased individuals
Last name
Count
Lived (average)
Brown
15
77.6 years
Moore
13
85.8 years
Russell
8
90.8 years
Parks
6
86.0 years
Cook
5
78.4 years
Horton
5
78.0 years
Ford
5
64.8 years
Daugherty
5
91.8 years
Johnson
5
76.6 years
Wheaton
5
71.8 years
Businesses in zip code 18837
Curves: 1
Discuss Rome, Pennsylvania (PA) on our hugely popular Pennsylvania forum.
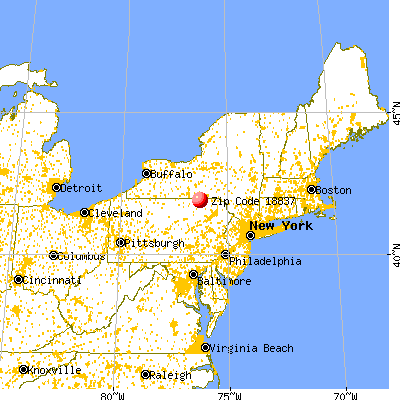


 Nearest zip codes: 13812, 18851, 18854, 13845, 18829, 18850.