Estimated zip code population in 2022: 1,089 Zip code population in 2010: 864 Zip code population in 2000: 54
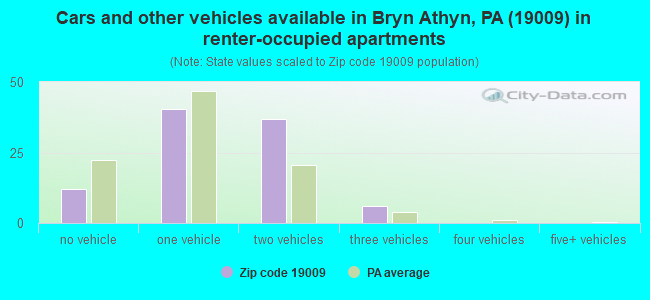
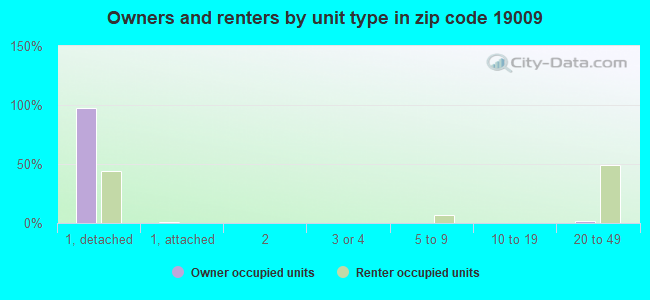
Houses and condos: 386 Renter-occupied apartments: 95
% of renters here:
27%
State:
31%
March 2022 cost of living index in zip code 19009: 106.1 (more than average, U.S. average is 100)
Land area: 1.3 sq. mi. Water area: 0.0 sq. mi.
Population density: 837 people per square mile
(low).
OSM Map
General Map
Google Map
MSN Map
OSM Map
General Map
Google Map
MSN Map
OSM Map
General Map
Google Map
MSN Map
OSM Map
General Map
Google Map
MSN Map
Please wait while loading the map...
Real estate property taxes paid for housing units in 2022:
This zip code:
0.6% ($3,921)
Pennsylvania:
1.3% ($3,094)
Median real estate property taxes paid for housing units with mortgages in 2022: $3,301 (0.5%) Median real estate property taxes paid for housing units with no mortgage in 2022: $5,529 (0.7%)
Business Search- 14 Million verified businesses
Males: 526
(48.3%)
Females: 563
(51.7%)
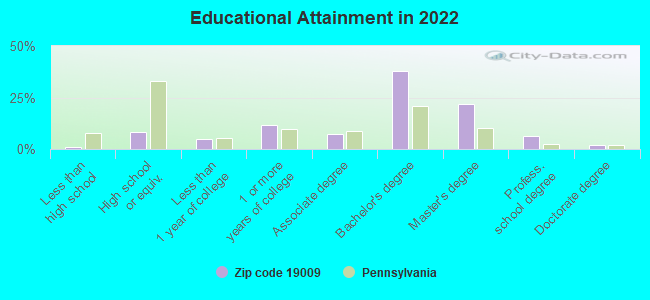
For population 25 years and over in 19009:
High school or higher: 100.5%
Bachelor's degree or higher: 68.3%
Graduate or professional degree: 30.2%
Unemployed: 2.6%
Mean travel time to work (commute): 19.4 minutes
For population 15 years and over in 19009:
Never married: 40.0%
Now married: 50.1%
Separated: 0.6%
Widowed: 4.7%
Divorced: 4.6%
Zip code 19009 compared to state average:
Median household income above state average.
Median house value significantly above state average.
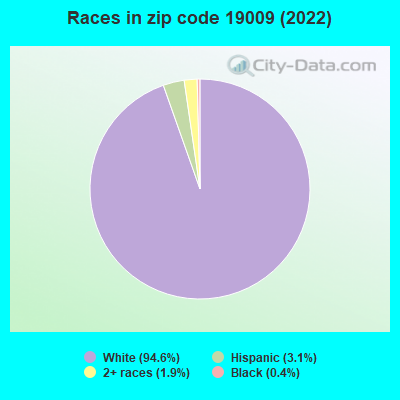
Black race population percentage significantly below state average.
Hispanic race population percentage below state average.
Length of stay since moving in significantly above state average.
Number of rooms per house above state average.
Number of college students above state average.
Percentage of population with a bachelor's degree or higher above state average.
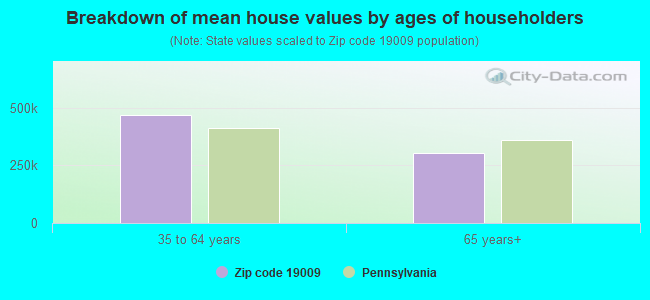
Estimated median house/condo value in 2022: $685,056
19009:
$685,056
Pennsylvania:
$245,500
According to our research of Pennsylvania and other state lists, there was 1 registered sex offender living in 19009 zip code as of May 23, 2024. The ratio of all residents to sex offenders in zip code 19009 is 921 to 1. The ratio of registered sex offenders to all residents in this zip code is lower than the state average.
Median resident age:
This zip code:
44.3 years
Pennsylvania median age:
40.9 years
Average household size:
This zip code:
2.6 people
Pennsylvania:
2.4 people
Averages for the 2004 tax year for zip code 19009, filed in 2005:
Average Adjusted Gross Income (AGI) in 2004: $88,013 (Individual Income Tax Returns)
Here:
$88,013
State:
$48,049
Salary/wage: $45,763 (reported on 74.5% of returns)
Here:
$45,763
State:
$42,646
(% of AGI for various income ranges: 56.7% for AGIs below $10k, 58.8% for AGIs $10k-25k, 62.3% for AGIs $25k-50k, 64.2% for AGIs $50k-75k, 72.8% for AGIs $75k-100k, 28.3% for AGIs over 100k)
Taxable interest for individuals: $2,133 (reported on 58.1% of returns)
This zip code:
$2,133
Pennsylvania:
$1,657
(% of AGI for various income ranges: 2.6% for AGIs below $10k, 4.6% for AGIs $10k-25k, 2.1% for AGIs $25k-50k, 2.7% for AGIs $50k-75k, 1.1% for AGIs $75k-100k, 1.1% for AGIs over 100k)
Taxable dividends: $47,232 (reported on 52.7% of returns)
Here:
$47,232
State:
$3,566
(% of AGI for various income ranges: 31.9% for AGIs below $10k, 21.8% for AGIs $10k-25k, 8.5% for AGIs $25k-50k, 9.9% for AGIs $50k-75k, 2.7% for AGIs $75k-100k, 35.6% for AGIs over 100k)
Net capital gain/loss: +$23,015 (reported on 35.3% of returns)
Here:
+$23,015
State:
+$9,716
(% of AGI for various income ranges: 0.8% for AGIs below $10k, -0.4% for AGIs $10k-25k, 0.4% for AGIs $25k-50k, 2.5% for AGIs $50k-75k, 1.7% for AGIs $75k-100k, 12.3% for AGIs over 100k)
Profit/loss from business: +$28,868 (reported on 16.4% of returns)
Here:
+$28,868
State:
+$14,267
(% of AGI for various income ranges: 5.4% for AGIs $10k-25k, 5.1% for AGIs $25k-50k, 0.4% for AGIs $50k-75k, 3.6% for AGIs $75k-100k, 6.2% for AGIs over 100k)
IRA payment deduction: $3,214 (reported on 2.5% of returns)
19009:
$3,214
Pennsylvania:
$2,903
Total itemized deductions: $37,257 (18% of AGI, reported on 33.6% of returns)
Here:
$37,257
State:
$18,804
Here:
18.0% of AGI
State:
19.5% of AGI
(% of AGI for various income ranges: 12.2% for AGIs $10k-25k, 9.4% for AGIs $25k-50k, 13.1% for AGIs $50k-75k, 13.4% for AGIs $75k-100k, 15.3% for AGIs over 100k)
Charity contributions deductions: $12,491 (7% of AGI, reported on 31.1% of returns)
Here:
$12,491
State:
$3,337
Here:
6.8% of AGI
State:
3.3% of AGI
(% of AGI for various income ranges: 2.1% for AGIs $10k-25k, 1.8% for AGIs $25k-50k, 2.7% for AGIs $50k-75k, 4.1% for AGIs $75k-100k, 5.1% for AGIs over 100k)
Total tax: $15,577 (reported on 79.1% of returns)
19009:
$15,577
State:
$8,008
(% of AGI for various income ranges: 2.4% for AGIs below $10k, 5.7% for AGIs $10k-25k, 7.6% for AGIs $25k-50k, 8.6% for AGIs $50k-75k, 10.6% for AGIs $75k-100k, 16.2% for AGIs over 100k)
Earned income credit: $1,158 (reported on 3.4% of returns)
Here:
$1,158
State:
$1,643
Percentage of individuals using paid preparers for their 2004 taxes: 47.3%
Here:
47%
State:
56%
(% for various income ranges: 37.8% for AGIs below $10k, 41.3% for AGIs $10k-25k, 52.0% for AGIs $25k-50k, 51.6% for AGIs $50k-75k, 45.8% for AGIs $75k-100k, 60.0% for AGIs over 100k)
Household received Food Stamps/SNAP in the past 12 months: 0 Household did not receive Food Stamps/SNAP in the past 12 months: 349
Women who had a birth in the past 12 months: 5 (0 now married, 4 unmarried) Women who did not have a birth in the past 12 months: 228 (54 now married, 175 unmarried)
Housing units in zip code 19009 with a mortgage: 130 (8 second mortgage, 8 both second mortgage and home equity loan) Houses without a mortgage: 17
Median monthly owner costs for units with a mortgage: $2,354 Median monthly owner costs for units without a mortgage: $1,224
Residents with income below the poverty level in 2022:
This zip code:
3.3%
Whole state:
11.8%
Residents with income below 50% of the poverty level in 2022:
This zip code:
1.3%
Whole state:
6.1%
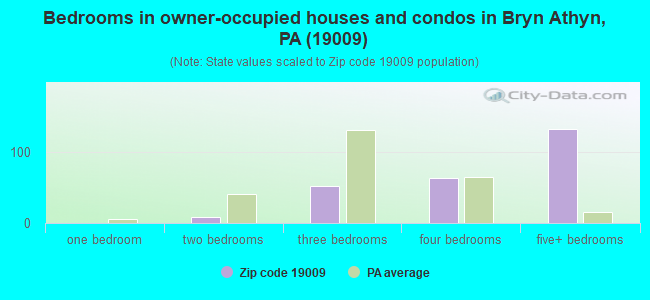
Median number of rooms in houses and condos:
Here:
10.0
State:
6.8
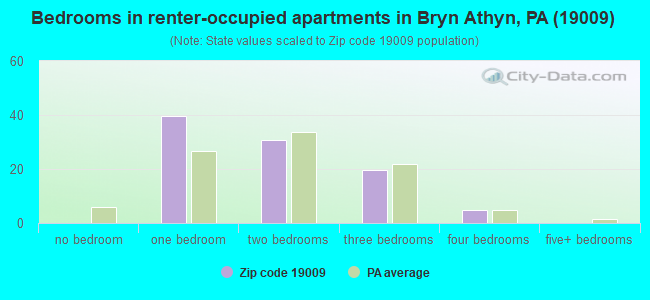
Median number of rooms in apartments:
Here:
3.9
State:
4.3
Notable locations in this zip code not listed on our city pages
Notable locations in zip code 19009: Bryn Athyn Borough Hall (A), Bryn Athyn Police Station (B), Bryn Athyn Rescue Squad 355 (C), Bryn Athyn Station 11 Rescue Squad (D), Glencairn Museum (E), Swedenburg Library (F), Bryn Athyn Fire Company (G). Display/hide their locations on the map
In group quarters: 193 (-1 institutionalized population)
Size of family households: 134 2-persons, 42 3-persons, 53 4-persons, 17 6-persons, 3 7-or-more-persons
Size of nonfamily households: 79 1-person, 14 2-persons, 6 3-persons
126 married couples with children.
9 single-parent households (9 men).
94.3% of residents of 19009 zip code speak English at home.
2.8% of residents speak Spanish at home (63% very well, 17% not well, 20% not at all).
0.8% of residents speak other Indo-European language at home (100% very well).
0.9% of residents speak Asian or Pacific Island language at home (100% well).
0.9% of residents speak other language at home (100% very well).
Foreign born population: 58 (5.4%) (28.9% of them are naturalized citizens)
This zip code:
5.4%
Whole state:
7.5%
22%Denmark
17%Honduras
8%Japan
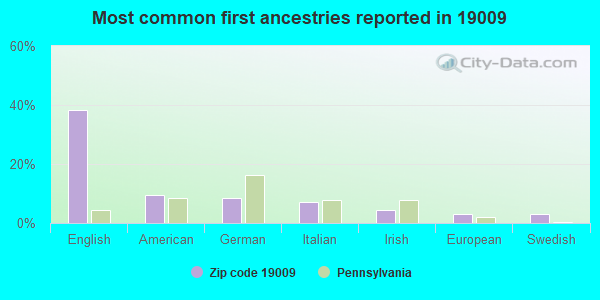
38%English
9%American
9%German
7%Italian
4%Irish
3%European
3%Swedish
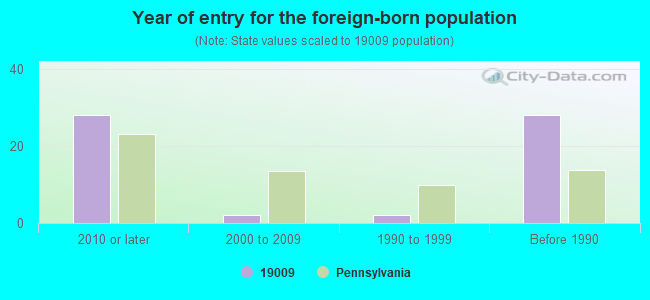
Year of entry for the foreign-born population
282010 or later
22000 to 2009
21990 to 1999
28Before 1990
Facilities with environmental interests located in this zip code:
ACAD OF THE NEW CHURCH (801 TOMLINSON RD in BRYN ATHYN, PA)
STATE MASTER (Pennsylvania database) - RCRIS-PAR000511048, HAZARDOUS WASTE PROGRAM Conditionally Exempt Small Quantity Generators, less than 100 kg/month of hazardous waste (Resource Conservation and Recovery Act (tracking hazardous waste)) Organizations: ACADEMY OF THE NEW CHURCH (CONTACT/OPERATOR)
ACADEMY OF THE NEW CHURCH (2815 HUNTINGDON PIKE in BRYN ATHYN, PA)
(Geographic Names Information System) COMPLIANCE ACTIVITY (Tracking inspections of insecticide, fungicide, and rodenticide, and toxic substances)
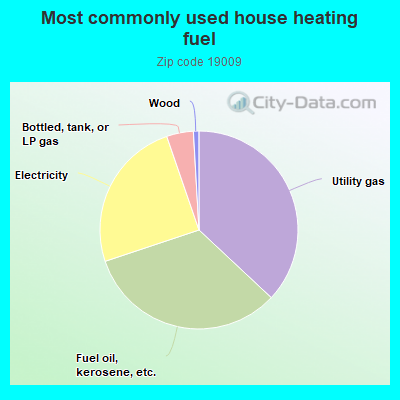
37.2%Utility gas
33.1%Fuel oil, kerosene, etc.
25.0%Electricity
4.4%Bottled, tank, or LP gas
0.9%Wood
Place of birth for U.S.-born residents:
This state: 655
Northeast: 119
Midwest: 131
South: 59
West: 67
86% of the 19009 zip code residents lived in the same house 5 years ago. Out of people who lived in different houses, 75% lived in this county.
97% of the 19009 zip code residents lived in the same house 1 year ago. Out of people who lived in different houses, 17% moved from this county. Out of people who lived in different houses, 39% moved from different county within same state. Out of people who lived in different houses, 39% moved from different state. Out of people who lived in different houses, 13% moved from abroad.
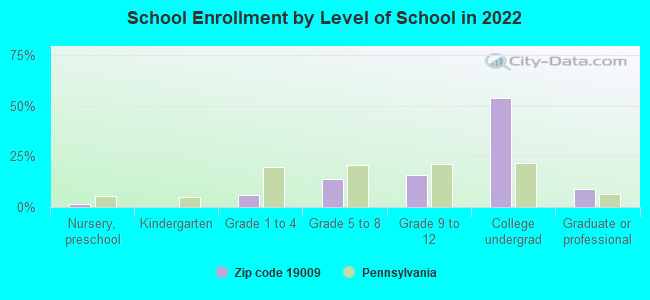
Private vs. public school enrollment:
Students in private schools in grades 1 to 8 (elementary and middle school): 56
Here:
74.6%
Pennsylvania:
15.7%
Students in private schools in grades 9 to 12 (high school): 28
Here:
50.3%
Pennsylvania:
13.4%
Students in private undergraduate colleges: 176
Here:
89.2%
Pennsylvania:
39.8%
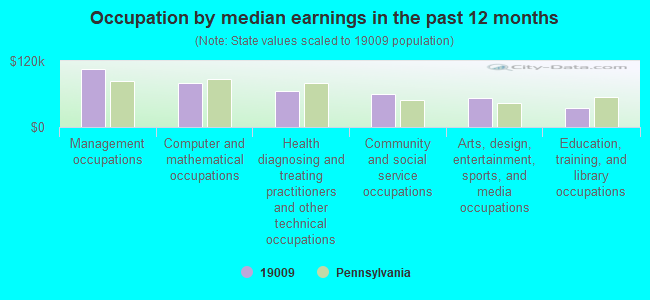
Occupation by median earnings in the past 12 months ($)
104,896Management occupations
80,874Computer and mathematical occupations
65,756Health diagnosing and treating practitioners and other technical occupations
59,433Community and social service occupations
51,953Arts, design, entertainment, sports, and media occupations
34,510Education, training, and library occupations
Top industries in this zip code by the number of employees in 2005:
Other Services (except Public Administration): Religious Organizations (250-499 employees: 1 establishment, 5-9 employees: 1 establishment)
Educational Services: Elementary and Secondary Schools (250-499: 1)
Health Care and Social Assistance: Offices of Physical, Occupational and Speech Therapists, and Audiologists (10-19: 2, 5-9: 2, 1-4: 2)
Wholesale Trade: Computer and Computer Peripheral Equipment and Software Merchant Wholesalers (20-49: 1)
Finance and Insurance: Portfolio Management (20-49: 1)
Accommodation and Food Services: Food Service Contractors (10-19: 1)
Health Care and Social Assistance: Offices of All Other Miscellaneous Health Practitioners (10-19: 1)
Construction: Residential Remodelers (10-19: 1)
Administrative and Support and Waste Management and Remediation Services: Landscaping Services (5-9: 1, 1-4: 1)
Health Care and Social Assistance: Homes for the Elderly (5-9: 1)
People in group quarters in 2010:
138 people in college/university student housing
31 people in workers' group living quarters and job corps centers
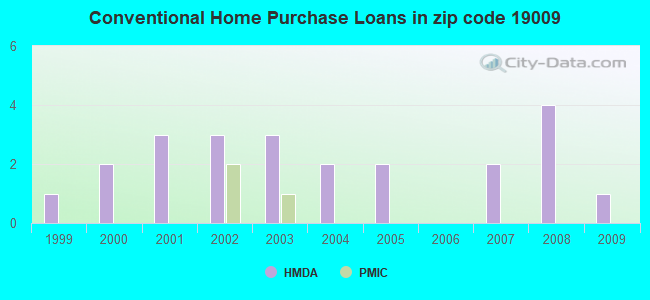
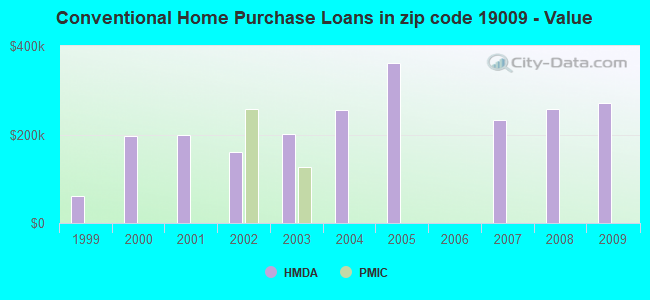
Home Mortgage Disclosure Act Aggregated Statistics For Year 2009 (Based on 2 partial tracts)
B) Conventional Home Purchase Loans
C) Refinancings
Number
Average Value
Number
Average Value
LOANS ORIGINATED
1
$270,250
8
$276,464
APPLICATIONS APPROVED, NOT ACCEPTED
0
$0
0
$0
APPLICATIONS DENIED
0
$0
2
$328,410
APPLICATIONS WITHDRAWN
1
$208,680
2
$260,185
FILES CLOSED FOR INCOMPLETENESS
0
$0
1
$270,840
Aggregated Statistics For Year 2008 (Based on 2 partial tracts)
B) Conventional Home Purchase Loans
C) Refinancings
D) Home Improvement Loans
F) Non-occupant Loans on < 5 Family Dwellings (A B C & D)
Number
Average Value
Number
Average Value
Number
Average Value
Number
Average Value
LOANS ORIGINATED
4
$257,668
3
$199,700
1
$66,010
0
$0
APPLICATIONS APPROVED, NOT ACCEPTED
1
$267,290
0
$0
0
$0
1
$195,360
APPLICATIONS DENIED
0
$0
0
$0
0
$0
0
$0
APPLICATIONS WITHDRAWN
0
$0
1
$207,200
0
$0
0
$0
FILES CLOSED FOR INCOMPLETENESS
0
$0
0
$0
0
$0
0
$0
Aggregated Statistics For Year 2007 (Based on 2 partial tracts)
B) Conventional Home Purchase Loans
C) Refinancings
D) Home Improvement Loans
F) Non-occupant Loans on < 5 Family Dwellings (A B C & D)
Number
Average Value
Number
Average Value
Number
Average Value
Number
Average Value
LOANS ORIGINATED
2
$233,395
2
$218,300
1
$125,800
0
$0
APPLICATIONS APPROVED, NOT ACCEPTED
2
$289,045
0
$0
0
$0
0
$0
APPLICATIONS DENIED
0
$0
1
$301,920
1
$212,530
0
$0
APPLICATIONS WITHDRAWN
1
$146,520
1
$205,420
0
$0
1
$146,520
FILES CLOSED FOR INCOMPLETENESS
0
$0
0
$0
0
$0
0
$0
Aggregated Statistics For Year 2006 (Based on 2 partial tracts)
C) Refinancings
D) Home Improvement Loans
Number
Average Value
Number
Average Value
LOANS ORIGINATED
4
$253,080
1
$34,630
APPLICATIONS APPROVED, NOT ACCEPTED
0
$0
1
$30,190
APPLICATIONS DENIED
1
$154,810
0
$0
APPLICATIONS WITHDRAWN
0
$0
0
$0
FILES CLOSED FOR INCOMPLETENESS
0
$0
0
$0
Aggregated Statistics For Year 2005 (Based on 2 partial tracts)
B) Conventional Home Purchase Loans
C) Refinancings
Number
Average Value
Number
Average Value
LOANS ORIGINATED
2
$362,155
4
$312,575
APPLICATIONS APPROVED, NOT ACCEPTED
0
$0
0
$0
APPLICATIONS DENIED
0
$0
0
$0
APPLICATIONS WITHDRAWN
0
$0
2
$204,390
FILES CLOSED FOR INCOMPLETENESS
0
$0
1
$112,480
Aggregated Statistics For Year 2004 (Based on 2 partial tracts)
B) Conventional Home Purchase Loans
C) Refinancings
D) Home Improvement Loans
F) Non-occupant Loans on < 5 Family Dwellings (A B C & D)
Number
Average Value
Number
Average Value
Number
Average Value
Number
Average Value
LOANS ORIGINATED
2
$256,040
7
$286,190
2
$159,395
1
$173,460
APPLICATIONS APPROVED, NOT ACCEPTED
1
$173,160
1
$373,260
0
$0
1
$180,260
APPLICATIONS DENIED
0
$0
1
$227,330
0
$0
0
$0
APPLICATIONS WITHDRAWN
1
$254,560
0
$0
0
$0
0
$0
FILES CLOSED FOR INCOMPLETENESS
0
$0
0
$0
0
$0
0
$0
Aggregated Statistics For Year 2003 (Based on 2 partial tracts)
B) Conventional Home Purchase Loans
C) Refinancings
D) Home Improvement Loans
Number
Average Value
Number
Average Value
Number
Average Value
LOANS ORIGINATED
3
$200,393
14
$219,653
1
$106,560
APPLICATIONS APPROVED, NOT ACCEPTED
0
$0
1
$155,990
0
$0
APPLICATIONS DENIED
0
$0
4
$276,835
0
$0
APPLICATIONS WITHDRAWN
0
$0
1
$125,210
0
$0
FILES CLOSED FOR INCOMPLETENESS
0
$0
0
$0
0
$0
Aggregated Statistics For Year 2002 (Based on 2 partial tracts)
B) Conventional Home Purchase Loans
C) Refinancings
F) Non-occupant Loans on < 5 Family Dwellings (A B C & D)
Number
Average Value
Number
Average Value
Number
Average Value
LOANS ORIGINATED
3
$161,123
9
$259,198
1
$237,100
APPLICATIONS APPROVED, NOT ACCEPTED
0
$0
1
$51,500
0
$0
APPLICATIONS DENIED
0
$0
1
$222,890
0
$0
APPLICATIONS WITHDRAWN
0
$0
1
$131,130
0
$0
FILES CLOSED FOR INCOMPLETENESS
0
$0
1
$52,690
0
$0
Aggregated Statistics For Year 2001 (Based on 2 partial tracts)
B) Conventional Home Purchase Loans
C) Refinancings
D) Home Improvement Loans
Number
Average Value
Number
Average Value
Number
Average Value
LOANS ORIGINATED
3
$197,927
4
$209,790
1
$13,620
APPLICATIONS APPROVED, NOT ACCEPTED
1
$222,000
0
$0
0
$0
APPLICATIONS DENIED
0
$0
1
$231,770
0
$0
APPLICATIONS WITHDRAWN
0
$0
1
$251,300
0
$0
FILES CLOSED FOR INCOMPLETENESS
0
$0
0
$0
0
$0
Aggregated Statistics For Year 2000 (Based on 2 partial tracts)
B) Conventional Home Purchase Loans
C) Refinancings
Number
Average Value
Number
Average Value
LOANS ORIGINATED
2
$195,950
1
$486,330
APPLICATIONS APPROVED, NOT ACCEPTED
0
$0
0
$0
APPLICATIONS DENIED
0
$0
1
$46,180
APPLICATIONS WITHDRAWN
0
$0
0
$0
FILES CLOSED FOR INCOMPLETENESS
0
$0
0
$0
Aggregated Statistics For Year 1999 (Based on 1 partial tract)

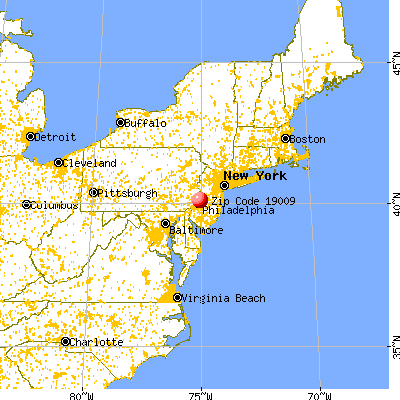


 Nearest zip codes: 19006, 19115, 19046, 19116, 19040, 19001.