Estimated zip code population in 2022: 6,655 Zip code population in 2010: 6,670 Zip code population in 2000: 6,631
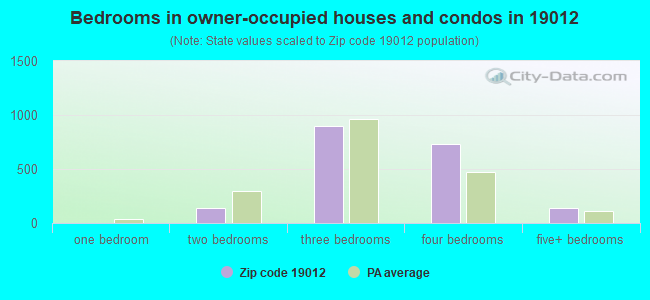
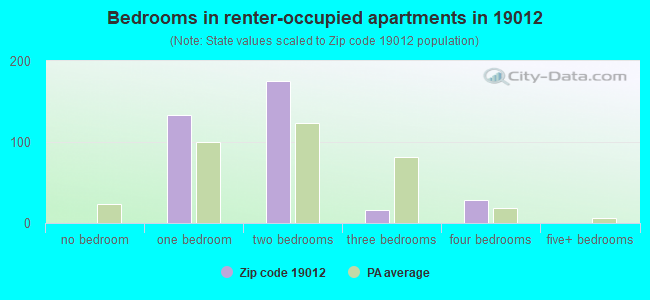
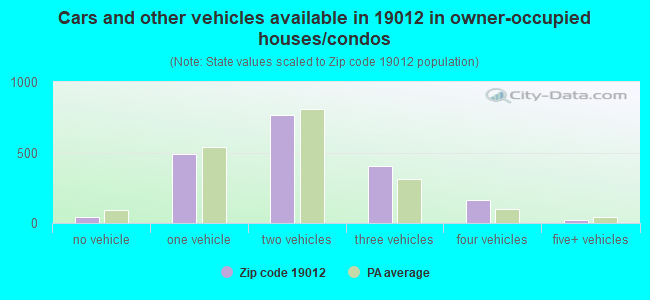
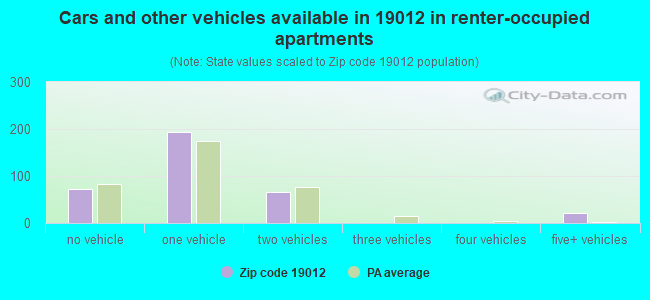
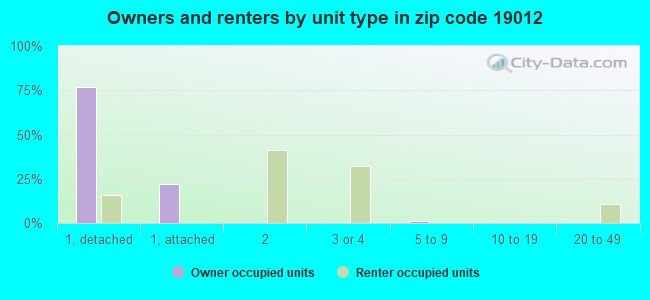
Houses and condos: 2,320 Renter-occupied apartments: 350
% of renters here:
16%
State:
31%
March 2022 cost of living index in zip code 19012: 102.6 (near average, U.S. average is 100)
Land area: 1.8 sq. mi. Water area: 0.0 sq. mi.
Population density: 3,787 people per square mile
(average).
OSM Map
General Map
Google Map
MSN Map
OSM Map
General Map
Google Map
MSN Map
OSM Map
General Map
Google Map
MSN Map
OSM Map
General Map
Google Map
MSN Map
Please wait while loading the map...
Real estate property taxes paid for housing units in 2022:
This zip code:
2.5% ($7,809)
Pennsylvania:
1.3% ($3,094)
Median real estate property taxes paid for housing units with mortgages in 2022: $7,875 (2.5%) Median real estate property taxes paid for housing units with no mortgage in 2022: $7,656 (2.4%)
Business Search- 14 Million verified businesses
Males: 3,001
(45.1%)
Females: 3,653
(54.9%)
For population 25 years and over in 19012:
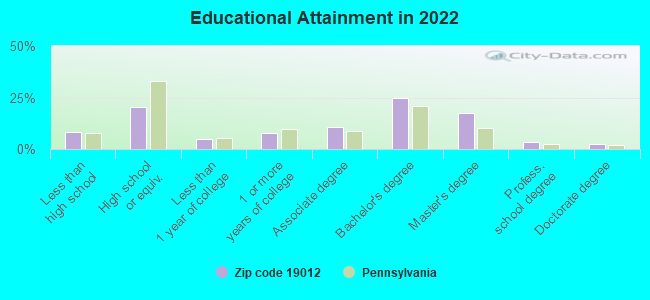
High school or higher: 93.0%
Bachelor's degree or higher: 48.6%
Graduate or professional degree: 23.6%
Unemployed: 4.9%
Mean travel time to work (commute): 28.8 minutes
For population 15 years and over in 19012:
Never married: 33.3%
Now married: 52.6%
Separated: 1.3%
Widowed: 6.1%
Divorced: 6.7%
Zip code 19012 compared to state average:
Median household income above state average.
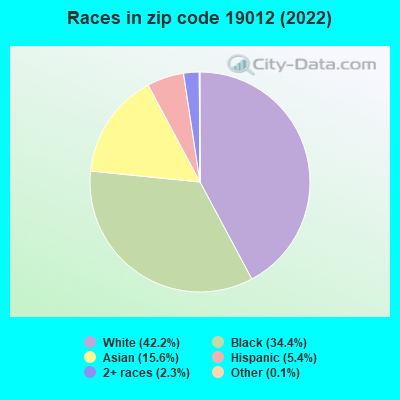
Black race population percentage significantly above state average.
Foreign-born population percentage significantly above state average.
Renting percentage below state average.
Length of stay since moving in significantly above state average.
Estimated median house/condo value in 2022: $310,619
19012:
$310,619
Pennsylvania:
$245,500
According to our research of Pennsylvania and other state lists, there were 5 registered sex offenders living in 19012 zip code as of May 19, 2024. The ratio of all residents to sex offenders in zip code 19012 is 1,321 to 1. The ratio of registered sex offenders to all residents in this zip code is lower than the state average.
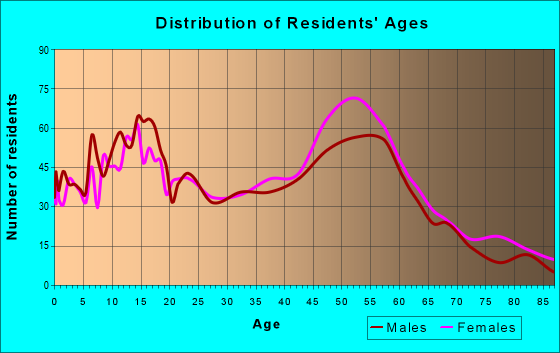
Median resident age:
This zip code:
41.7 years
Pennsylvania median age:
40.9 years
Average household size:
This zip code:
2.9 people
Pennsylvania:
2.4 people
Averages for the 2020 tax year for zip code 19012, filed in 2021:
Average Adjusted Gross Income (AGI) in 2020: $76,429 (Individual Income Tax Returns)
Here:
$76,429
State:
$75,707
Salary/wage: $67,282 (reported on 82.4% of returns)
Here:
$67,282
State:
$62,806
(% of AGI for various income ranges: 1019.0% for AGIs below $25k, 3502.7% for AGIs $25k-50k, 6712.2% for AGIs $50k-75k, 10494.8% for AGIs $75k-100k, 17386.1% for AGIs $100k-200k, 62928.3% for AGIs over 200k)
Taxable interest for individuals: $1,221 (reported on 33.5% of returns)
This zip code:
$1,221
Pennsylvania:
$1,633
(% of AGI for various income ranges: 14.6% for AGIs below $25k, 26.8% for AGIs $25k-50k, 67.8% for AGIs $50k-75k, 74.8% for AGIs $75k-100k, 71.4% for AGIs $100k-200k, 705.0% for AGIs over 200k)
Ordinary dividends: $4,569 (reported on 20.6% of returns)
Here:
$4,569
State:
$7,382
(% of AGI for various income ranges: 40.7% for AGIs below $25k, 48.2% for AGIs $25k-50k, 109.2% for AGIs $50k-75k, 110.0% for AGIs $75k-100k, 195.2% for AGIs $100k-200k, 1958.3% for AGIs over 200k)
Net capital gain/loss in AGI: +$10,128 (reported on 17.6% of returns)
Here:
+$10,128
State:
+$23,522
(% of AGI for various income ranges: 23.4% for AGIs below $25k, 46.8% for AGIs $25k-50k, 248.3% for AGIs $50k-75k, 233.0% for AGIs $75k-100k, 279.1% for AGIs $100k-200k, 5023.3% for AGIs over 200k)
Profit/loss from business: +$12,568 (reported on 17.4% of returns)
Here:
+$12,568
State:
+$16,274
(% of AGI for various income ranges: 112.8% for AGIs below $25k, 110.4% for AGIs $25k-50k, 217.5% for AGIs $50k-75k, 325.2% for AGIs $75k-100k, 437.0% for AGIs $100k-200k, 4425.0% for AGIs over 200k)
Taxable individual retirement arrangement distribution: $17,316 (reported on 9.1% of returns)
19012:
$17,316
Pennsylvania:
$18,583
(% of AGI for various income ranges: 35.6% for AGIs below $25k, 104.3% for AGIs $25k-50k, 234.7% for AGIs $50k-75k, 341.7% for AGIs $75k-100k, 416.8% for AGIs $100k-200k, 1836.7% for AGIs over 200k)
Total itemized deductions: $28,720 (reported on 15.0% of returns)
Here:
$28,720
State:
$34,850
(% of AGI for various income ranges: 366.2% for AGIs $25k-50k, 724.2% for AGIs $50k-75k, 856.5% for AGIs $75k-100k, 1183.0% for AGIs $100k-200k, 4690.0% for AGIs over 200k)
Charity contributions: $8,226 (reported on 12.6% of returns)
Here:
$8,226
State:
$12,392
(% of AGI for various income ranges: 38.4% for AGIs $25k-50k, 99.4% for AGIs $50k-75k, 171.3% for AGIs $75k-100k, 309.3% for AGIs $100k-200k, 2015.0% for AGIs over 200k)
Taxes paid: $8,951 (reported on 15.0% of returns)
19012:
$8,951
State:
$8,200
(% of AGI for various income ranges: 102.9% for AGIs $25k-50k, 261.7% for AGIs $50k-75k, 330.4% for AGIs $75k-100k, 390.9% for AGIs $100k-200k, 945.0% for AGIs over 200k)
Earned income credit: $1,797 (reported on 10.6% of returns)
Here:
$1,797
State:
$2,100
(% of AGI for various income ranges: 61.6% for AGIs below $25k, 48.4% for AGIs $25k-50k)
Percentage of individuals using paid preparers for their 2020 taxes: 90.6%
Here:
91%
State:
92%
(% for various income ranges: 89.8% for AGIs below $25k, 91.5% for AGIs $25k-50k, 92.6% for AGIs $50k-75k, 89.2% for AGIs $75k-100k, 88.9% for AGIs $100k-200k, 94.4% for AGIs over 200k)
Averages for the 2012 tax year for zip code 19012, filed in 2013:
Average Adjusted Gross Income (AGI) in 2012: $67,001 (Individual Income Tax Returns)
Here:
$67,001
State:
$61,346
Salary/wage: $61,149 (reported on 82.7% of returns)
Here:
$61,149
State:
$51,902
(% of AGI for various income ranges: 72.5% for AGIs below $25k, 80.2% for AGIs $25k-50k, 70.5% for AGIs $50k-75k, 76.1% for AGIs $75k-100k, 81.3% for AGIs $100k-200k, 66.0% for AGIs over 200k)
Taxable interest for individuals: $1,345 (reported on 41.4% of returns)
This zip code:
$1,345
Pennsylvania:
$1,588
(% of AGI for various income ranges: 2.0% for AGIs below $25k, 0.8% for AGIs $25k-50k, 1.3% for AGIs $50k-75k, 0.7% for AGIs $75k-100k, 0.5% for AGIs $100k-200k, 1.0% for AGIs over 200k)
Ordinary dividends: $5,056 (reported on 25.0% of returns)
Here:
$5,056
State:
$5,827
(% of AGI for various income ranges: 2.9% for AGIs below $25k, 1.8% for AGIs $25k-50k, 1.6% for AGIs $50k-75k, 1.5% for AGIs $75k-100k, 1.5% for AGIs $100k-200k, 3.0% for AGIs over 200k)
Net capital gain/loss in AGI: +$3,760 (reported on 19.3% of returns)
Here:
+$3,760
State:
+$14,495
(% of AGI for various income ranges: 1.1% for AGIs $50k-75k, 0.8% for AGIs $75k-100k, 0.9% for AGIs $100k-200k, 2.7% for AGIs over 200k)
Profit/loss from business: +$18,178 (reported on 15.2% of returns)
Here:
+$18,178
State:
+$16,268
(% of AGI for various income ranges: 8.0% for AGIs below $25k, 4.9% for AGIs $25k-50k, 4.0% for AGIs $50k-75k, 3.2% for AGIs $75k-100k, 2.3% for AGIs $100k-200k, 6.9% for AGIs over 200k)
Taxable individual retirement arrangement distribution: $18,442 (reported on 11.3% of returns)
19012:
$18,442
Pennsylvania:
$14,550
(% of AGI for various income ranges: 3.0% for AGIs below $25k, 1.9% for AGIs $25k-50k, 3.5% for AGIs $50k-75k, 3.0% for AGIs $75k-100k, 2.8% for AGIs $100k-200k, 4.2% for AGIs over 200k)
Self-employment retirement plans: $15,350 (reported on 1.2% of returns)
19012:
$15,350
Pennsylvania:
$20,922
Total itemized deductions: $23,973 (23% of AGI, reported on 51.2% of returns)
Here:
$23,973
State:
$23,538
Here:
23.0% of AGI
State:
18.4% of AGI
(% of AGI for various income ranges: 20.8% for AGIs below $25k, 15.7% for AGIs $25k-50k, 20.7% for AGIs $50k-75k, 20.8% for AGIs $75k-100k, 19.4% for AGIs $100k-200k, 13.3% for AGIs over 200k)
Charity contributions: $3,364 (reported on 44.0% of returns)
Here:
$3,364
State:
$4,025
(% of AGI for various income ranges: 1.0% for AGIs below $25k, 1.6% for AGIs $25k-50k, 2.3% for AGIs $50k-75k, 2.5% for AGIs $75k-100k, 2.5% for AGIs $100k-200k, 2.1% for AGIs over 200k)
Taxes paid: $11,805 (reported on 51.2% of returns)
19012:
$11,805
State:
$9,982
(% of AGI for various income ranges: 7.3% for AGIs below $25k, 7.0% for AGIs $25k-50k, 9.5% for AGIs $50k-75k, 10.1% for AGIs $75k-100k, 10.0% for AGIs $100k-200k, 7.6% for AGIs over 200k)
Earned income credit: $1,803 (reported on 10.7% of returns)
Here:
$1,803
State:
$2,106
(% of AGI for various income ranges: 4.1% for AGIs below $25k, 0.8% for AGIs $25k-50k)
Percentage of individuals using paid preparers for their 2012 taxes: 53.9%
Here:
54%
State:
53%
(% for various income ranges: 49.5% for AGIs below $25k, 50.7% for AGIs $25k-50k, 54.0% for AGIs $50k-75k, 58.5% for AGIs $75k-100k, 59.3% for AGIs $100k-200k, 64.3% for AGIs over 200k)
Averages for the 2004 tax year for zip code 19012, filed in 2005:
Average Adjusted Gross Income (AGI) in 2004: $64,271 (Individual Income Tax Returns)
Here:
$64,271
State:
$48,049
Salary/wage: $56,103 (reported on 82.3% of returns)
Here:
$56,103
State:
$42,646
(% of AGI for various income ranges: 92.2% for AGIs below $10k, 71.1% for AGIs $10k-25k, 77.6% for AGIs $25k-50k, 79.5% for AGIs $50k-75k, 82.5% for AGIs $75k-100k, 64.4% for AGIs over 100k)
Taxable interest for individuals: $2,349 (reported on 57.8% of returns)
This zip code:
$2,349
Pennsylvania:
$1,657
(% of AGI for various income ranges: 7.9% for AGIs below $10k, 4.6% for AGIs $10k-25k, 2.2% for AGIs $25k-50k, 2.0% for AGIs $50k-75k, 1.6% for AGIs $75k-100k, 2.0% for AGIs over 100k)
Taxable dividends: $4,560 (reported on 33.8% of returns)
Here:
$4,560
State:
$3,566
(% of AGI for various income ranges: 8.4% for AGIs below $10k, 3.5% for AGIs $10k-25k, 1.6% for AGIs $25k-50k, 1.7% for AGIs $50k-75k, 2.0% for AGIs $75k-100k, 2.7% for AGIs over 100k)
Net capital gain/loss: +$4,604 (reported on 26.8% of returns)
Here:
+$4,604
State:
+$9,716
(% of AGI for various income ranges: -4.0% for AGIs below $10k, 0.2% for AGIs $10k-25k, 0.3% for AGIs $25k-50k, 0.9% for AGIs $50k-75k, 0.4% for AGIs $75k-100k, 3.3% for AGIs over 100k)
Profit/loss from business: +$17,637 (reported on 15.8% of returns)
Here:
+$17,637
State:
+$14,267
(% of AGI for various income ranges: -2.7% for AGIs below $10k, 8.5% for AGIs $10k-25k, 5.2% for AGIs $25k-50k, 3.8% for AGIs $50k-75k, 3.0% for AGIs $75k-100k, 4.5% for AGIs over 100k)
IRA payment deduction: $3,298 (reported on 3.7% of returns)
19012:
$3,298
Pennsylvania:
$2,903
(% of AGI for various income ranges: 0.4% for AGIs $10k-25k, 0.4% for AGIs $25k-50k, 0.2% for AGIs $50k-75k, 0.2% for AGIs $75k-100k, 0.1% for AGIs over 100k)
Self-employed pension: $10,236 (reported on 2.1% of returns)
Here:
$10,236
Pennsylvania:
$14,674
(% of AGI for various income ranges: 0.2% for AGIs $25k-50k, 0.4% for AGIs $50k-75k, 0.1% for AGIs $75k-100k, 0.5% for AGIs over 100k)
Total itemized deductions: $20,970 (20% of AGI, reported on 52.1% of returns)
Here:
$20,970
State:
$18,804
Here:
20.5% of AGI
State:
19.5% of AGI
(% of AGI for various income ranges: 20.5% for AGIs below $10k, 16.1% for AGIs $10k-25k, 18.0% for AGIs $25k-50k, 22.1% for AGIs $50k-75k, 21.0% for AGIs $75k-100k, 14.0% for AGIs over 100k)
Charity contributions deductions: $3,860 (4% of AGI, reported on 47.8% of returns)
Here:
$3,860
State:
$3,337
Here:
3.6% of AGI
State:
3.3% of AGI
(% of AGI for various income ranges: 1.6% for AGIs below $10k, 2.0% for AGIs $10k-25k, 2.3% for AGIs $25k-50k, 2.9% for AGIs $50k-75k, 3.0% for AGIs $75k-100k, 3.0% for AGIs over 100k)
Total tax: $11,807 (reported on 78.8% of returns)
19012:
$11,807
State:
$8,008
(% of AGI for various income ranges: 3.1% for AGIs below $10k, 5.1% for AGIs $10k-25k, 7.4% for AGIs $25k-50k, 8.7% for AGIs $50k-75k, 9.3% for AGIs $75k-100k, 20.5% for AGIs over 100k)
Earned income credit: $1,702 (reported on 6.7% of returns)
Here:
$1,702
State:
$1,643
Percentage of individuals using paid preparers for their 2004 taxes: 54.4%
Here:
54%
State:
56%
(% for various income ranges: 47.4% for AGIs below $10k, 52.1% for AGIs $10k-25k, 53.8% for AGIs $25k-50k, 56.2% for AGIs $50k-75k, 59.2% for AGIs $75k-100k, 60.5% for AGIs over 100k)
Likely homosexual households (counted as self-reported same-sex unmarried-partner households)
Lesbian couples: 0.3% of all households
Gay men: 0.0% of all households
Household received Food Stamps/SNAP in the past 12 months: 127 Household did not receive Food Stamps/SNAP in the past 12 months: 2,110
Women who had a birth in the past 12 months: 6 (0 now married, 5 unmarried) Women who did not have a birth in the past 12 months: 1,932 (743 now married, 1,190 unmarried)
Housing units in zip code 19012 with a mortgage: 1,363 (242 second mortgage, 5 home equity loan, 182 both second mortgage and home equity loan) Houses without a mortgage: 37
Median monthly owner costs for units with a mortgage: $2,461 Median monthly owner costs for units without a mortgage: $1,061
Residents with income below the poverty level in 2022:
This zip code:
4.8%
Whole state:
11.8%
Residents with income below 50% of the poverty level in 2022:
This zip code:
0.7%
Whole state:
6.1%
Median number of rooms in houses and condos:
Here:
7.5
State:
6.8
Median number of rooms in apartments:
Here:
3.9
State:
4.3
Notable locations in this zip code not listed on our city pages
Notable locations in zip code 19012: Ashbourne Country Club (A), Melrose Country Club (B), Cheltenham Fire Company (C), East Cheltenham Library (D), Rowland Community Center (E). Display/hide their locations on the map
Churches in zip code 19012 include: Pilgrim Lutheran Church (A), Cheltenham United Methodist Church (B), New Apostolic Church (C), Berachan Church (D), Armenian Church of America (E). Display/hide their locations on the map
In group quarters: 20 (-1 institutionalized population)
Size of family households: 484 2-persons, 354 3-persons, 342 4-persons, 309 5-persons, 33 6-persons, 48 7-or-more-persons
Size of nonfamily households: 580 1-person, 60 2-persons, 17 3-persons
977 married couples with children.
111 single-parent households (8 men, 103 women).
72.5% of residents of 19012 zip code speak English at home.
3.4% of residents speak Spanish at home (76% very well, 24% well).
8.4% of residents speak other Indo-European language at home (81% very well, 2% well, 8% not well, 9% not at all).
13.6% of residents speak Asian or Pacific Island language at home (31% very well, 27% well, 24% not well, 17% not at all).
2.5% of residents speak other language at home (49% very well, 26% well, 26% not well).
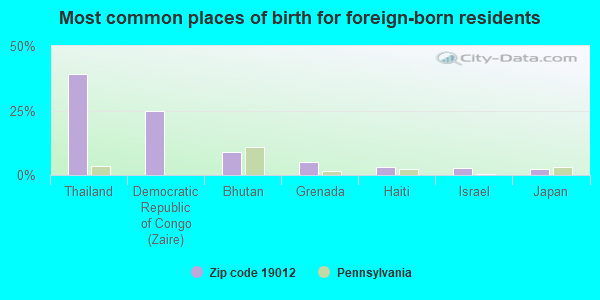
Foreign born population: 1,382 (20.8%) (83.0% of them are naturalized citizens)
This zip code:
20.8%
Whole state:
7.5%
39%Thailand
25%Democratic Republic of Congo (Zaire)
9%Bhutan
5%Grenada
3%Haiti
3%Israel
2%Japan
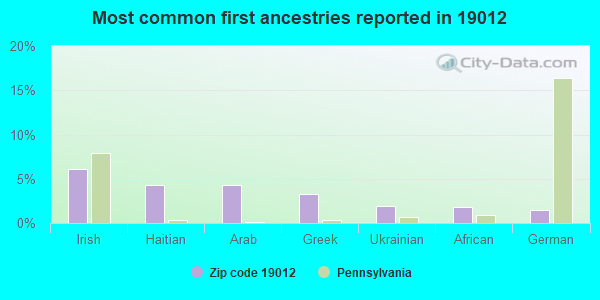
6%Irish
4%Haitian
4%Arab
3%Greek
2%Ukrainian
2%African
1%German
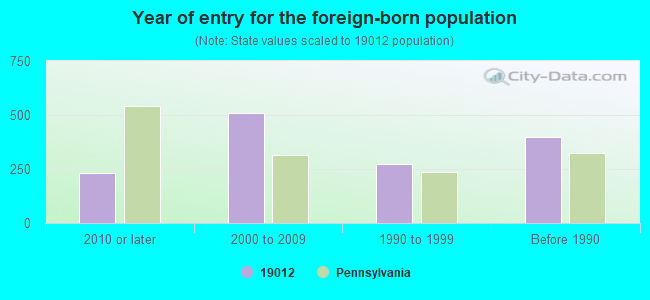
Year of entry for the foreign-born population
2332010 or later
5082000 to 2009
2721990 to 1999
397Before 1990
Public elementary/middle school in in zip code 19012 not listed on the city page:
CHELTENHAM EL SCH(Students: 365, Location: 7853 FRONT STREET, Grades: KG-4)
Private elementary/middle school in in this zip code not listed on the city page:
PRESENTATION BVM SCHOOL (Students: 259, Location: 105 OLD SOLDIERS RD, Grades: PK-8)
Facilities with environmental interests located in this zip code:
AMOCO 1246 TANKS (81 CHELTENHAM AVE TANKS in CHELTENHAM, PA)
Small Quantity Generators, between 100 kg and 1000 kg of hazardous waste/month (Resource Conservation and Recovery Act (tracking hazardous waste)) - notification Organizations: AMOCO OIL COMPANY (CONTACT/OWNER)
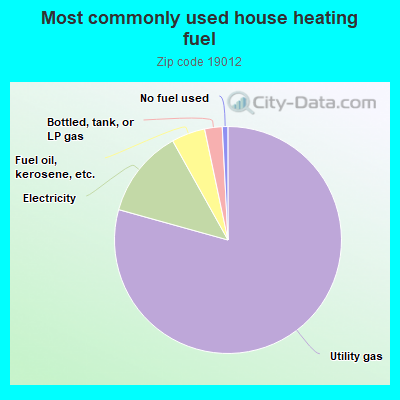
79.4%Utility gas
12.6%Electricity
4.8%Fuel oil, kerosene, etc.
2.5%Bottled, tank, or LP gas
0.8%No fuel used
Population in 1990: 6,912.
Place of birth for U.S.-born residents:
This state: 4,113
Northeast: 440
Midwest: 205
South: 337
West: 94
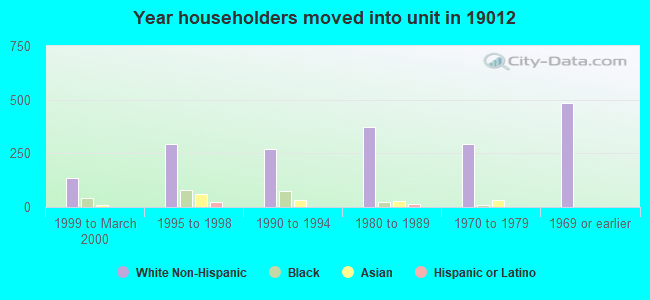
72% of the 19012 zip code residents lived in the same house 5 years ago. Out of people who lived in different houses, 34% lived in this county. Out of people who lived in different counties, 50% lived in Pennsylvania.
93% of the 19012 zip code residents lived in the same house 1 year ago. Out of people who lived in different houses, 32% moved from this county. Out of people who lived in different houses, 57% moved from different county within same state. Out of people who lived in different houses, 12% moved from different state.
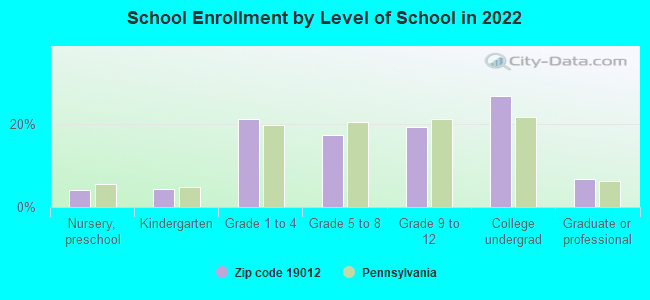
Private vs. public school enrollment:
Students in private schools in grades 1 to 8 (elementary and middle school): 46
Here:
7.5%
Pennsylvania:
15.7%
Students in private schools in grades 9 to 12 (high school):
Here:
0.0%
Pennsylvania:
13.4%
Students in private undergraduate colleges: 51
Here:
11.7%
Pennsylvania:
39.8%
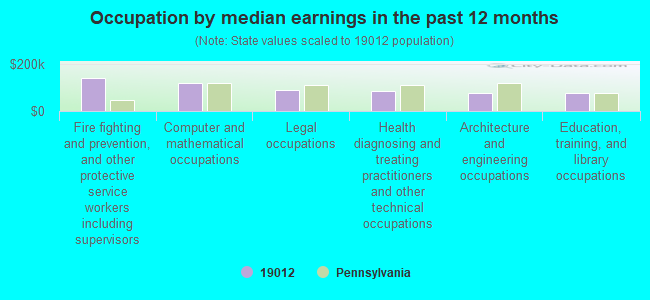
Occupation by median earnings in the past 12 months ($)
140,689Fire fighting and prevention, and other protective service workers including supervisors
116,737Computer and mathematical occupations
88,155Legal occupations
83,348Health diagnosing and treating practitioners and other technical occupations
76,247Architecture and engineering occupations
74,961Education, training, and library occupations
Companies with federal contracts located in this zip code:
TRISTATE CORPORATION (101 E LAUREL AVE in CHELTENHAM, PA; small business) : $126,135 in 5 contractsfrom 2002 to 2005
Contracts for Miscellaneous Machine Tools, Disks and Stones, Abrasive by Navy Signed by year:2000: $0; 2001: $0; 2002: $83,135; 2003: $0; 2004: $27,610; 2005: $15,390; 2006: $0.
Biggest contracts:
$83,135 with Navy for Miscellaneous Machine Tools. Signed on 2002-12-16. Completion date: 2004-01-06.
$17,040 with Navy for Disks and Stones, Abrasive. Signed on 2004-04-14. Completion date: 2004-04-16.
$15,390, same as above.Signed on 2005-07-13. Completion date: 2005-07-26.
$6,290, same as above.Signed on 2004-05-17. Completion date: 2004-05-17.
Top industries in this zip code by the number of employees in 2005:
Professional, Scientific, and Technical Services: Administrative Management and General Management Consulting Services (250-499 employees: 1 establishment, 1-4 employees: 1 establishment)
Arts, Entertainment, and Recreation: Golf Courses and Country Clubs (50-99: 1, 10-19: 1, 1-4: 1)
Finance and Insurance: Commercial Banking (10-19: 4, 5-9: 1)
Other Services (except Public Administration): Religious Organizations (20-49: 1, 5-9: 1, 1-4: 4)
Health Care and Social Assistance: Offices of Dentists (10-19: 2, 1-4: 4)
Construction: Plumbing, Heating, and Air-Conditioning Contractors (20-49: 1, 1-4: 2)
Health Care and Social Assistance: Other Residential Care Facilities (20-49: 1)
People in group quarters in 2010:
23 people in other noninstitutional facilities
People in group quarters in 2000:
18 people in religious group quarters
10 people in other nonhousehold living situations
Fatal accident statistics in 2014:
Fatal accident count: 1
Vehicles involved in fatal accidents: 4
Fatal accidents caused by drunken drivers: 1
Fatalities: 1
Persons involved in fatal accidents: 1
Pedestrians involved in fatal accidents: 0
Fatal accident statistics in 2012:
Fatal accident count: 1
Vehicles involved in fatal accidents: 2
Fatal accidents caused by drunken drivers: 0
Fatalities: 1
Persons involved in fatal accidents: 2
Pedestrians involved in fatal accidents: 1
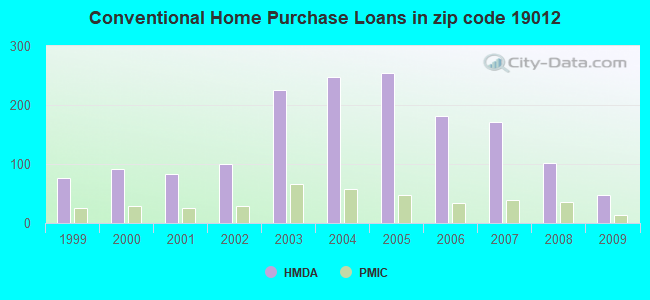
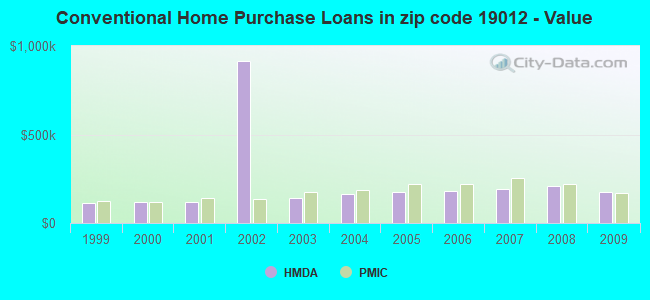
Home Mortgage Disclosure Act Aggregated Statistics For Year 2009 (Based on 2 full and 2 partial tracts)
A) FHA, FSA/RHS & VA Home Purchase Loans
B) Conventional Home Purchase Loans
C) Refinancings
D) Home Improvement Loans
F) Non-occupant Loans on < 5 Family Dwellings (A B C & D)
Number
Average Value
Number
Average Value
Number
Average Value
Number
Average Value
Number
Average Value
LOANS ORIGINATED
51
$210,318
47
$174,522
278
$171,500
23
$37,720
7
$140,029
APPLICATIONS APPROVED, NOT ACCEPTED
5
$194,472
0
$0
32
$174,323
4
$10,398
0
$0
APPLICATIONS DENIED
7
$210,131
2
$47,585
141
$201,094
21
$83,158
0
$0
APPLICATIONS WITHDRAWN
11
$212,105
9
$181,352
99
$208,924
7
$137,709
2
$194,220
FILES CLOSED FOR INCOMPLETENESS
1
$402,000
2
$67,975
13
$192,664
1
$205,160
0
$0
Aggregated Statistics For Year 2008 (Based on 2 full and 2 partial tracts)
A) FHA, FSA/RHS & VA Home Purchase Loans
B) Conventional Home Purchase Loans
C) Refinancings
D) Home Improvement Loans
F) Non-occupant Loans on < 5 Family Dwellings (A B C & D)
Number
Average Value
Number
Average Value
Number
Average Value
Number
Average Value
Number
Average Value
LOANS ORIGINATED
52
$212,318
101
$209,236
148
$161,319
46
$35,269
13
$176,757
APPLICATIONS APPROVED, NOT ACCEPTED
4
$215,098
14
$209,596
44
$188,790
29
$43,692
0
$0
APPLICATIONS DENIED
5
$253,984
15
$248,605
103
$206,134
45
$53,231
6
$172,660
APPLICATIONS WITHDRAWN
5
$255,208
19
$224,585
45
$190,642
5
$72,094
0
$0
FILES CLOSED FOR INCOMPLETENESS
0
$0
5
$208,384
9
$276,339
1
$55,450
0
$0
Aggregated Statistics For Year 2007 (Based on 2 full and 2 partial tracts)
A) FHA, FSA/RHS & VA Home Purchase Loans
B) Conventional Home Purchase Loans
C) Refinancings
D) Home Improvement Loans
F) Non-occupant Loans on < 5 Family Dwellings (A B C & D)
G) Loans On Manufactured Home Dwelling (A B C & D)
Number
Average Value
Number
Average Value
Number
Average Value
Number
Average Value
Number
Average Value
Number
Average Value
LOANS ORIGINATED
13
$248,312
172
$193,045
264
$181,971
79
$68,834
17
$172,604
1
$243,970
APPLICATIONS APPROVED, NOT ACCEPTED
1
$230,110
35
$185,414
55
$191,886
26
$63,247
1
$302,190
0
$0
APPLICATIONS DENIED
0
$0
40
$207,427
159
$204,979
61
$63,596
8
$88,546
0
$0
APPLICATIONS WITHDRAWN
1
$395,070
27
$173,801
103
$202,733
5
$90,716
3
$116,440
0
$0
FILES CLOSED FOR INCOMPLETENESS
0
$0
9
$232,950
31
$193,635
1
$124,760
1
$180,210
0
$0
Aggregated Statistics For Year 2006 (Based on 2 full and 2 partial tracts)
A) FHA, FSA/RHS & VA Home Purchase Loans
B) Conventional Home Purchase Loans
C) Refinancings
D) Home Improvement Loans
E) Loans on Dwellings For 5+ Families
F) Non-occupant Loans on < 5 Family Dwellings (A B C & D)
Number
Average Value
Number
Average Value
Number
Average Value
Number
Average Value
Number
Average Value
Number
Average Value
LOANS ORIGINATED
3
$295,127
182
$181,335
290
$164,993
100
$42,869
1
$2,772,400
23
$134,883
APPLICATIONS APPROVED, NOT ACCEPTED
0
$0
25
$188,540
75
$183,809
16
$48,698
0
$0
1
$210,700
APPLICATIONS DENIED
0
$0
53
$181,156
153
$199,329
99
$59,968
0
$0
19
$159,687
APPLICATIONS WITHDRAWN
2
$231,120
26
$195,488
117
$180,088
7
$108,124
0
$0
3
$235,300
FILES CLOSED FOR INCOMPLETENESS
0
$0
11
$245,252
37
$224,116
3
$92,413
0
$0
3
$135,387
Aggregated Statistics For Year 2005 (Based on 2 full and 2 partial tracts)
A) FHA, FSA/RHS & VA Home Purchase Loans
B) Conventional Home Purchase Loans
C) Refinancings
D) Home Improvement Loans
F) Non-occupant Loans on < 5 Family Dwellings (A B C & D)
G) Loans On Manufactured Home Dwelling (A B C & D)
Number
Average Value
Number
Average Value
Number
Average Value
Number
Average Value
Number
Average Value
Number
Average Value
LOANS ORIGINATED
7
$232,290
254
$176,418
416
$150,123
100
$51,436
20
$105,699
1
$24,950
APPLICATIONS APPROVED, NOT ACCEPTED
0
$0
28
$184,652
88
$141,419
20
$33,404
5
$78,052
0
$0
APPLICATIONS DENIED
0
$0
36
$212,590
164
$165,265
69
$30,866
9
$103,659
0
$0
APPLICATIONS WITHDRAWN
0
$0
36
$243,627
128
$183,694
20
$170,170
5
$270,492
0
$0
FILES CLOSED FOR INCOMPLETENESS
0
$0
5
$194,918
56
$156,696
4
$43,700
0
$0
0
$0
Aggregated Statistics For Year 2004 (Based on 2 full and 2 partial tracts)
A) FHA, FSA/RHS & VA Home Purchase Loans
B) Conventional Home Purchase Loans
C) Refinancings
D) Home Improvement Loans
E) Loans on Dwellings For 5+ Families
F) Non-occupant Loans on < 5 Family Dwellings (A B C & D)
G) Loans On Manufactured Home Dwelling (A B C & D)
Number
Average Value
Number
Average Value
Number
Average Value
Number
Average Value
Number
Average Value
Number
Average Value
Number
Average Value
LOANS ORIGINATED
7
$196,467
247
$161,399
396
$142,598
82
$58,651
0
$0
17
$95,730
0
$0
APPLICATIONS APPROVED, NOT ACCEPTED
0
$0
15
$163,984
85
$174,870
16
$79,456
0
$0
0
$0
0
$0
APPLICATIONS DENIED
0
$0
23
$178,422
212
$145,245
46
$70,117
1
$41,590
21
$74,801
2
$169,940
APPLICATIONS WITHDRAWN
0
$0
12
$219,525
106
$143,808
9
$39,598
0
$0
1
$117,830
0
$0
FILES CLOSED FOR INCOMPLETENESS
0
$0
6
$518,208
75
$166,148
1
$69,310
0
$0
2
$213,640
0
$0
Aggregated Statistics For Year 2003 (Based on 2 full and 2 partial tracts)
A) FHA, FSA/RHS & VA Home Purchase Loans
B) Conventional Home Purchase Loans
C) Refinancings
D) Home Improvement Loans
F) Non-occupant Loans on < 5 Family Dwellings (A B C & D)
Number
Average Value
Number
Average Value
Number
Average Value
Number
Average Value
Number
Average Value
LOANS ORIGINATED
14
$159,887
225
$143,277
844
$125,438
87
$71,243
25
$93,942
APPLICATIONS APPROVED, NOT ACCEPTED
0
$0
19
$125,936
128
$121,362
16
$66,289
1
$97,030
APPLICATIONS DENIED
0
$0
10
$170,280
308
$139,123
60
$46,466
1
$145,550
APPLICATIONS WITHDRAWN
2
$129,155
17
$143,250
138
$117,771
3
$98,420
1
$138,620
FILES CLOSED FOR INCOMPLETENESS
0
$0
2
$63,120
27
$120,420
3
$55,447
0
$0
Aggregated Statistics For Year 2002 (Based on 2 partial tracts)
A) FHA, FSA/RHS & VA Home Purchase Loans
B) Conventional Home Purchase Loans
C) Refinancings
D) Home Improvement Loans
F) Non-occupant Loans on < 5 Family Dwellings (A B C & D)
Number
Average Value
Number
Average Value
Number
Average Value
Number
Average Value
Number
Average Value
LOANS ORIGINATED
19
$134,607
100
$916,084
251
$107,643
32
$50,553
8
$87,678
APPLICATIONS APPROVED, NOT ACCEPTED
0
$0
4
$228,378
40
$103,133
11
$45,871
1
$449,130
APPLICATIONS DENIED
3
$89,180
14
$117,926
82
$107,160
7
$35,249
1
$216,250
APPLICATIONS WITHDRAWN
1
$194,070
14
$142,878
54
$99,909
6
$54,523
3
$54,523
FILES CLOSED FOR INCOMPLETENESS
1
$255,060
6
$117,827
26
$113,722
1
$27,720
3
$59,143
Aggregated Statistics For Year 2001 (Based on 2 partial tracts)
A) FHA, FSA/RHS & VA Home Purchase Loans
B) Conventional Home Purchase Loans
C) Refinancings
D) Home Improvement Loans
F) Non-occupant Loans on < 5 Family Dwellings (A B C & D)
Number
Average Value
Number
Average Value
Number
Average Value
Number
Average Value
Number
Average Value
LOANS ORIGINATED
15
$123,926
83
$119,514
179
$116,123
36
$28,956
3
$62,380
APPLICATIONS APPROVED, NOT ACCEPTED
0
$0
4
$153,175
17
$89,532
7
$39,407
0
$0
APPLICATIONS DENIED
0
$0
8
$109,856
62
$108,370
14
$13,565
3
$83,633
APPLICATIONS WITHDRAWN
1
$194,070
7
$135,847
35
$105,113
1
$18,020
1
$127,530
FILES CLOSED FOR INCOMPLETENESS
0
$0
1
$156,640
14
$93,469
0
$0
0
$0
Aggregated Statistics For Year 2000 (Based on 2 partial tracts)
A) FHA, FSA/RHS & VA Home Purchase Loans
B) Conventional Home Purchase Loans
C) Refinancings
D) Home Improvement Loans
F) Non-occupant Loans on < 5 Family Dwellings (A B C & D)
Number
Average Value
Number
Average Value
Number
Average Value
Number
Average Value
Number
Average Value
LOANS ORIGINATED
22
$104,406
91
$117,492
53
$86,441
39
$31,456
6
$83,172
APPLICATIONS APPROVED, NOT ACCEPTED
0
$0
11
$141,645
11
$75,359
14
$17,229
1
$13,860
APPLICATIONS DENIED
0
$0
15
$133,075
35
$76,003
26
$23,992
3
$82,247
APPLICATIONS WITHDRAWN
1
$120,600
4
$151,790
24
$95,359
6
$52,907
0
$0
FILES CLOSED FOR INCOMPLETENESS
0
$0
1
$243,970
1
$141,390
0
$0
0
$0
Aggregated Statistics For Year 1999 (Based on 3 partial tracts)
A) FHA, FSA/RHS & VA Home Purchase Loans
B) Conventional Home Purchase Loans
C) Refinancings
D) Home Improvement Loans
F) Non-occupant Loans on < 5 Family Dwellings (A B C & D)
Detailed PMIC statistics for the following Tracts:2022.01
, 2022.02
2003 - 2018 National Fire Incident Reporting System (NFIRS) incidents
Based on the data from the years 2003 - 2018 the average number of fires per year is 12. The highest number of fires - 32 took place in 2018, and the least - 0 in 2004. The data has an increasing trend.
When looking into fire subcategories, the most reports belonged to: Structure Fires (83.6%), and Outside Fires (10.3%).
Fire incident types reported to NFIRS in Zip Code 19012


 Nearest zip codes: 19027, 19111, 19120, 19126, 19046, 19124.


 (Students: 365, Location: 7853 FRONT STREET, Grades: KG-4)

 Based on the data from the years 2003 - 2018 the average number of fires per year is 12. The highest number of fires - 32 took place in 2018, and the least - 0 in 2004. The data has an increasing trend.
 When looking into fire subcategories, the most reports belonged to: Structure Fires (83.6%), and Outside Fires (10.3%).