Estimated zip code population in 2022: 4,143 Zip code population in 2010: 3,780 Zip code population in 2000: 4,050
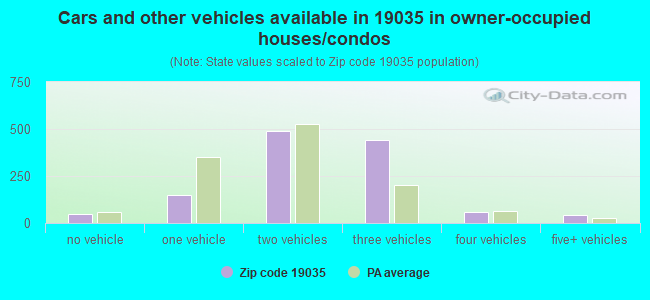
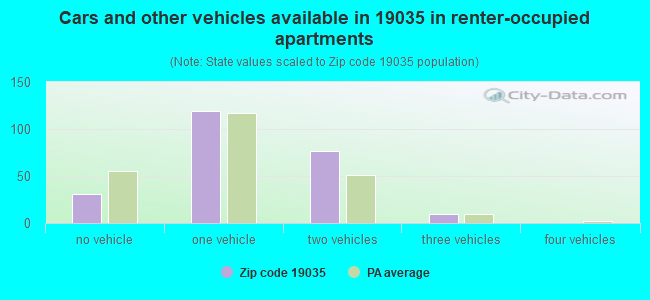
Houses and condos: 1,509 Renter-occupied apartments: 236
% of renters here:
16%
State:
31%
March 2022 cost of living index in zip code 19035: 107.9 (more than average, U.S. average is 100)
Land area: 4.8 sq. mi. Water area: 0.1 sq. mi.
Population density: 870 people per square mile
(low).
OSM Map
General Map
Google Map
MSN Map
OSM Map
General Map
Google Map
MSN Map
OSM Map
General Map
Google Map
MSN Map
OSM Map
General Map
Google Map
MSN Map
Please wait while loading the map...
Real estate property taxes paid for housing units in 2022:
This zip code:
0.7% ($9,709)
Pennsylvania:
1.3% ($3,094)
Median real estate property taxes paid for housing units with mortgages in 2022: $9,729 (0.7%) Median real estate property taxes paid for housing units with no mortgage in 2022: $9,689 (0.7%)
Estimated median house/condo value in 2022: $1,374,778
19035:
$1,374,778
Pennsylvania:
$245,500
Median resident age:
This zip code:
45.1 years
Pennsylvania median age:
40.9 years
Average household size:
This zip code:
2.8 people
Pennsylvania:
2.4 people
Averages for the 2020 tax year for zip code 19035, filed in 2021:
Average Adjusted Gross Income (AGI) in 2020: $628,672 (Individual Income Tax Returns)
Here:
$628,672
State:
$75,707
Salary/wage: $361,559 (reported on 62.4% of returns)
Here:
$361,559
State:
$62,806
(% of AGI for various income ranges: 1597.7% for AGIs below $25k, 4755.0% for AGIs $25k-50k, 6965.7% for AGIs $50k-75k, 8026.0% for AGIs $75k-100k, 19763.3% for AGIs $100k-200k, 253081.2% for AGIs over 200k)
Taxable interest for individuals: $33,555 (reported on 68.8% of returns)
This zip code:
$33,555
Pennsylvania:
$1,633
(% of AGI for various income ranges: 124.6% for AGIs below $25k, 88.8% for AGIs $25k-50k, 282.9% for AGIs $50k-75k, 450.0% for AGIs $75k-100k, 901.1% for AGIs $100k-200k, 26968.2% for AGIs over 200k)
Ordinary dividends: $74,952 (reported on 72.2% of returns)
Here:
$74,952
State:
$7,382
(% of AGI for various income ranges: 679.2% for AGIs below $25k, 913.7% for AGIs $25k-50k, 1384.3% for AGIs $50k-75k, 2280.0% for AGIs $75k-100k, 7423.3% for AGIs $100k-200k, 59132.4% for AGIs over 200k)
Net capital gain/loss in AGI: +$282,173 (reported on 68.3% of returns)
Here:
+$282,173
State:
+$23,522
(% of AGI for various income ranges: 336.2% for AGIs below $25k, 1048.8% for AGIs $25k-50k, 765.7% for AGIs $50k-75k, 1352.0% for AGIs $75k-100k, 4043.3% for AGIs $100k-200k, 228773.5% for AGIs over 200k)
Profit/loss from business: +$69,773 (reported on 25.4% of returns)
Here:
+$69,773
State:
+$16,274
(% of AGI for various income ranges: 336.2% for AGIs below $25k, 621.2% for AGIs $25k-50k, 1131.4% for AGIs $50k-75k, 1342.0% for AGIs $75k-100k, 2422.2% for AGIs $100k-200k, 18650.0% for AGIs over 200k)
Taxable individual retirement arrangement distribution: $55,174 (reported on 16.6% of returns)
19035:
$55,174
Pennsylvania:
$18,583
(% of AGI for various income ranges: 487.5% for AGIs $25k-50k, 554.3% for AGIs $50k-75k, 1612.0% for AGIs $75k-100k, 4770.0% for AGIs $100k-200k, 7577.6% for AGIs over 200k)
Self-employed (Keogh) retirement plans: $52,429 (reported on 6.8% of returns)
19035:
$52,429
Pennsylvania:
$25,407
(% of AGI for various income ranges: 4317.6% for AGIs over 200k)
Total itemized deductions: $152,193 (reported on 44.4% of returns)
Here:
$152,193
State:
$34,850
(% of AGI for various income ranges: 676.9% for AGIs below $25k, 1087.5% for AGIs $25k-50k, 1802.9% for AGIs $50k-75k, 3350.0% for AGIs $75k-100k, 9470.0% for AGIs $100k-200k, 73697.6% for AGIs over 200k)
Charity contributions: $123,185 (reported on 41.0% of returns)
Here:
$123,185
State:
$12,392
(% of AGI for various income ranges: 26.2% for AGIs below $25k, 87.5% for AGIs $25k-50k, 214.3% for AGIs $50k-75k, 448.0% for AGIs $75k-100k, 1231.1% for AGIs $100k-200k, 59934.7% for AGIs over 200k)
Taxes paid: $9,027 (reported on 44.4% of returns)
19035:
$9,027
State:
$8,200
(% of AGI for various income ranges: 130.8% for AGIs below $25k, 320.0% for AGIs $25k-50k, 360.0% for AGIs $50k-75k, 696.0% for AGIs $75k-100k, 1404.4% for AGIs $100k-200k, 3485.3% for AGIs over 200k)
Earned income credit: $1,300 (reported on 2.0% of returns)
Here:
$1,300
State:
$2,100
(% of AGI for various income ranges: 40.0% for AGIs below $25k)
Percentage of individuals using paid preparers for their 2020 taxes: 91.2%
Here:
91%
State:
92%
(% for various income ranges: 88.4% for AGIs below $25k, 88.2% for AGIs $25k-50k, 86.7% for AGIs $50k-75k, 90.9% for AGIs $75k-100k, 93.5% for AGIs $100k-200k, 93.2% for AGIs over 200k)
Averages for the 2012 tax year for zip code 19035, filed in 2013:
Average Adjusted Gross Income (AGI) in 2012: $1,052,019 (Individual Income Tax Returns)
Here:
$1,052,019
State:
$61,346
Salary/wage: $334,113 (reported on 64.7% of returns)
Here:
$334,113
State:
$51,902
(% of AGI for various income ranges: 57.9% for AGIs below $25k, 57.8% for AGIs $25k-50k, 59.2% for AGIs $50k-75k, 32.8% for AGIs $75k-100k, 44.6% for AGIs $100k-200k, 19.6% for AGIs over 200k)
Taxable interest for individuals: $200,695 (reported on 71.6% of returns)
This zip code:
$200,695
Pennsylvania:
$1,588
(% of AGI for various income ranges: 3.9% for AGIs below $25k, 2.6% for AGIs $25k-50k, 4.6% for AGIs $50k-75k, 3.7% for AGIs $75k-100k, 2.0% for AGIs $100k-200k, 14.1% for AGIs over 200k)
Ordinary dividends: $88,604 (reported on 71.6% of returns)
Here:
$88,604
State:
$5,827
(% of AGI for various income ranges: 22.9% for AGIs below $25k, 10.6% for AGIs $25k-50k, 11.4% for AGIs $50k-75k, 15.1% for AGIs $75k-100k, 14.1% for AGIs $100k-200k, 5.7% for AGIs over 200k)
Net capital gain/loss in AGI: +$823,755 (reported on 62.7% of returns)
Here:
+$823,755
State:
+$14,495
(% of AGI for various income ranges: 3.6% for AGIs below $25k, 2.8% for AGIs $25k-50k, 3.1% for AGIs $50k-75k, 3.8% for AGIs $75k-100k, 4.7% for AGIs $100k-200k, 50.9% for AGIs over 200k)
Profit/loss from business: +$76,010 (reported on 24.5% of returns)
Here:
+$76,010
State:
+$16,268
(% of AGI for various income ranges: 11.0% for AGIs below $25k, 8.8% for AGIs $25k-50k, 4.8% for AGIs $50k-75k, 8.7% for AGIs $75k-100k, 5.3% for AGIs $100k-200k, 1.6% for AGIs over 200k)
Taxable individual retirement arrangement distribution: $57,354 (reported on 22.5% of returns)
19035:
$57,354
Pennsylvania:
$14,550
(% of AGI for various income ranges: 4.0% for AGIs below $25k, 6.1% for AGIs $25k-50k, 5.7% for AGIs $50k-75k, 13.1% for AGIs $75k-100k, 8.6% for AGIs $100k-200k, 1.0% for AGIs over 200k)
Self-employment retirement plans: $36,006 (reported on 7.8% of returns)
19035:
$36,006
Pennsylvania:
$20,922
Total itemized deductions: $150,847 (10% of AGI, reported on 70.6% of returns)
Here:
$150,847
State:
$23,538
Here:
10.2% of AGI
State:
18.4% of AGI
(% of AGI for various income ranges: 40.0% for AGIs below $25k, 30.2% for AGIs $25k-50k, 32.4% for AGIs $50k-75k, 35.8% for AGIs $75k-100k, 27.6% for AGIs $100k-200k, 9.4% for AGIs over 200k)
Charity contributions: $59,089 (reported on 63.2% of returns)
Here:
$59,089
State:
$4,025
(% of AGI for various income ranges: 1.6% for AGIs below $25k, 2.0% for AGIs $25k-50k, 4.3% for AGIs $50k-75k, 3.4% for AGIs $75k-100k, 3.3% for AGIs $100k-200k, 3.6% for AGIs over 200k)
Taxes paid: $64,790 (reported on 70.6% of returns)
19035:
$64,790
State:
$9,982
(% of AGI for various income ranges: 14.0% for AGIs below $25k, 10.1% for AGIs $25k-50k, 11.7% for AGIs $50k-75k, 10.6% for AGIs $75k-100k, 9.8% for AGIs $100k-200k, 4.1% for AGIs over 200k)
Earned income credit: $1,180 (reported on 2.5% of returns)
Here:
$1,180
State:
$2,106
(% of AGI for various income ranges: 1.5% for AGIs below $25k)
Percentage of individuals using paid preparers for their 2012 taxes: 78.9%
Here:
79%
State:
53%
(% for various income ranges: 72.9% for AGIs below $25k, 63.2% for AGIs $25k-50k, 69.2% for AGIs $50k-75k, 83.3% for AGIs $75k-100k, 80.0% for AGIs $100k-200k, 87.0% for AGIs over 200k)
Averages for the 2004 tax year for zip code 19035, filed in 2005:
Average Adjusted Gross Income (AGI) in 2004: $395,297 (Individual Income Tax Returns)
Here:
$395,297
State:
$48,049
Salary/wage: $264,788 (reported on 59.7% of returns)
Here:
$264,788
State:
$42,646
(% of AGI for various income ranges: 45.8% for AGIs $10k-25k, 56.0% for AGIs $25k-50k, 43.1% for AGIs $50k-75k, 44.9% for AGIs $75k-100k, 38.5% for AGIs over 100k)
Taxable interest for individuals: $13,359 (reported on 79.8% of returns)
This zip code:
$13,359
Pennsylvania:
$1,657
(% of AGI for various income ranges: 8.3% for AGIs $10k-25k, 6.5% for AGIs $25k-50k, 6.7% for AGIs $50k-75k, 4.4% for AGIs $75k-100k, 2.4% for AGIs over 100k)
Taxable dividends: $33,182 (reported on 79.2% of returns)
Here:
$33,182
State:
$3,566
(% of AGI for various income ranges: 19.8% for AGIs $10k-25k, 12.5% for AGIs $25k-50k, 14.5% for AGIs $50k-75k, 17.3% for AGIs $75k-100k, 6.0% for AGIs over 100k)
Net capital gain/loss: +$146,064 (reported on 73.3% of returns)
Here:
+$146,064
State:
+$9,716
(% of AGI for various income ranges: 2.6% for AGIs $10k-25k, 2.8% for AGIs $25k-50k, 4.3% for AGIs $50k-75k, 8.1% for AGIs $75k-100k, 27.1% for AGIs over 100k)
Profit/loss from business: +$72,326 (reported on 22.3% of returns)
Here:
+$72,326
State:
+$14,267
(% of AGI for various income ranges: 9.6% for AGIs $10k-25k, 5.3% for AGIs $25k-50k, 8.6% for AGIs $50k-75k, 5.3% for AGIs $75k-100k, 3.8% for AGIs over 100k)
IRA payment deduction: $4,388 (reported on 3.2% of returns)
19035:
$4,388
Pennsylvania:
$2,903
Self-employed pension: $26,366 (reported on 7.6% of returns)
Here:
$26,366
Pennsylvania:
$14,674
Total itemized deductions: $95,630 (15% of AGI, reported on 64.3% of returns)
Here:
$95,630
State:
$18,804
Here:
15.5% of AGI
State:
19.5% of AGI
(% of AGI for various income ranges: 53.7% for AGIs $10k-25k, 31.6% for AGIs $25k-50k, 39.0% for AGIs $50k-75k, 34.0% for AGIs $75k-100k, 14.3% for AGIs over 100k)
Charity contributions deductions: $27,087 (4% of AGI, reported on 60.8% of returns)
Here:
$27,087
State:
$3,337
Here:
4.2% of AGI
State:
3.3% of AGI
(% of AGI for various income ranges: 3.5% for AGIs $10k-25k, 3.3% for AGIs $25k-50k, 3.9% for AGIs $50k-75k, 3.7% for AGIs $75k-100k, 4.1% for AGIs over 100k)
Total tax: $113,418 (reported on 79.9% of returns)
19035:
$113,418
State:
$8,008
(% of AGI for various income ranges: 5.6% for AGIs $10k-25k, 7.3% for AGIs $25k-50k, 9.2% for AGIs $50k-75k, 9.4% for AGIs $75k-100k, 23.0% for AGIs over 100k)
Earned income credit: $929 (reported on 1.3% of returns)
Here:
$929
State:
$1,643
Percentage of individuals using paid preparers for their 2004 taxes: 79.5%
Here:
80%
State:
56%
(% for various income ranges: 79.5% for AGIs below $10k, 73.2% for AGIs $10k-25k, 65.2% for AGIs $25k-50k, 70.6% for AGIs $50k-75k, 76.3% for AGIs $75k-100k, 86.0% for AGIs over 100k)
Household received Food Stamps/SNAP in the past 12 months: 0 Household did not receive Food Stamps/SNAP in the past 12 months: 1,464
Women who had a birth in the past 12 months: 9 (9 now married, 0 unmarried) Women who did not have a birth in the past 12 months: 820 (449 now married, 367 unmarried)
Housing units in zip code 19035 with a mortgage: 720 (128 second mortgage, 11 home equity loan, 89 both second mortgage and home equity loan) Median monthly owner costs for units with a mortgage: $3,833 Median monthly owner costs for units without a mortgage: $1,478
Residents with income below the poverty level in 2022:
This zip code:
1.2%
Whole state:
11.8%
Residents with income below 50% of the poverty level in 2022:
This zip code:
0.8%
Whole state:
6.1%
Median number of rooms in houses and condos:
Here:
10.0
State:
6.8
Median number of rooms in apartments:
Here:
4.9
State:
4.3
Notable locations in this zip code not listed on our city pages
Notable locations in zip code 19035: Philadelphia Country Club (A), Gladwyne Branch Lower Merion Township Library (B), Lower Merion Township Fire Department - Gladwyne Fire Company (C). Display/hide their locations on the map
In group quarters: 74 (-1 institutionalized population)
Size of family households: 493 2-persons, 189 3-persons, 352 4-persons, 89 5-persons, 32 6-persons, 15 7-or-more-persons
Size of nonfamily households: 266 1-person, 23 2-persons
992 married couples with children.
116 single-parent households (41 men, 75 women).
91.9% of residents of 19035 zip code speak English at home.
2.8% of residents speak Spanish at home (66% very well, 34% well).
2.3% of residents speak other Indo-European language at home (81% very well, 19% well).
1.8% of residents speak Asian or Pacific Island language at home (46% very well, 54% well).
1.0% of residents speak other language at home (100% very well).
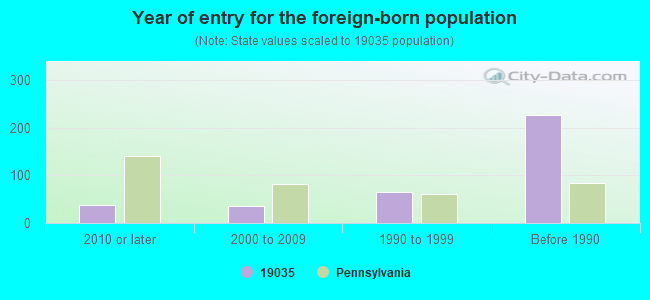
Foreign born population: 375 (9.1%) (87.3% of them are naturalized citizens)
This zip code:
9.1%
Whole state:
7.5%
9%Belgium
8%Iraq
7%United Kingdom, excluding England and Scotland
7%Sweden
7%China, excluding Hong Kong and Taiwan
6%France
6%Taiwan
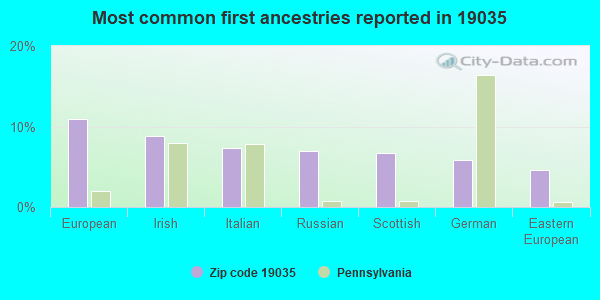
11%European
9%Irish
7%Italian
7%Russian
7%Scottish
6%German
5%Eastern European
Year of entry for the foreign-born population
382010 or later
362000 to 2009
661990 to 1999
227Before 1990
Public elementary/middle school in in zip code 19035 not listed on the city page:
Private elementary/middle school in in this zip code not listed on the city page:
THE GLADWYNE MONTESSORI SCHOOL (Students: 252, Location: 920 YOUNGS FORD RD, Grades: PK-6)
Facilities with environmental interests located in this zip code:
ALAVI SRSTP (531 CONSHOHOCKEN STATE RD in GLADWYNE, PA)
STATE MASTER (Pennsylvania database) - PCS-PAG040045, National Pollutant Discharge Elimination System Permit National Pollutant Discharge Elimination System NON-MAJOR (Tracking pollutant discharge elimination systems) - permit Business SIC classification: PRIVATE HOUSEHOLDS Alternative names: CHARLES COBLER, COBBLER PROP, COBLER, CHARLES
AL WULFF (206 RIVER RD in GLADWYNE, PA)
National Pollutant Discharge Elimination System NON-MAJOR (Tracking pollutant discharge elimination systems) - permit Business SIC classification: SEWERAGE SYSTEMS Alternative names: WULFF, AL
Housing units lacking complete kitchen facilities: 0.5%
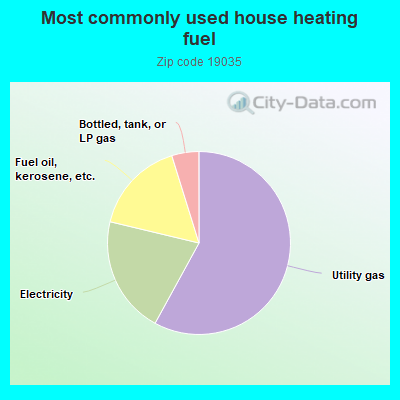
58.1%Utility gas
20.8%Electricity
16.5%Fuel oil, kerosene, etc.
4.8%Bottled, tank, or LP gas
Population in 1990: 3,742. Population change in the 1990s: +308 (+8.2%).
Place of birth for U.S.-born residents:
This state: 2,386
Northeast: 549
Midwest: 176
South: 432
West: 226
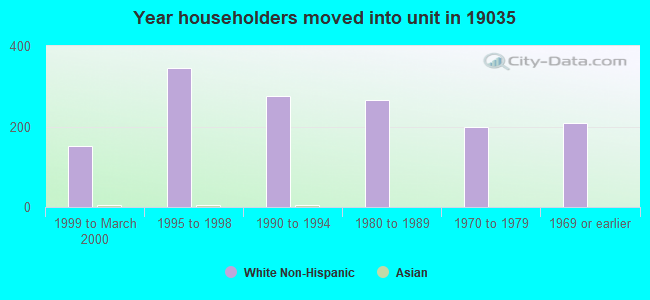
68% of the 19035 zip code residents lived in the same house 5 years ago. Out of people who lived in different houses, 39% lived in this county. Out of people who lived in different counties, 50% lived in Pennsylvania.
78% of the 19035 zip code residents lived in the same house 1 year ago. Out of people who lived in different houses, 35% moved from this county. Out of people who lived in different houses, 15% moved from different county within same state. Out of people who lived in different houses, 41% moved from different state. Out of people who lived in different houses, 8% moved from abroad.
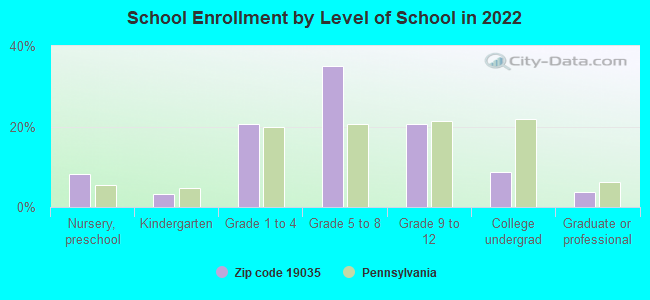
Private vs. public school enrollment:
Students in private schools in grades 1 to 8 (elementary and middle school): 264
Here:
40.9%
Pennsylvania:
15.7%
Students in private schools in grades 9 to 12 (high school): 88
Here:
36.9%
Pennsylvania:
13.4%
Students in private undergraduate colleges: 32
Here:
33.1%
Pennsylvania:
39.8%
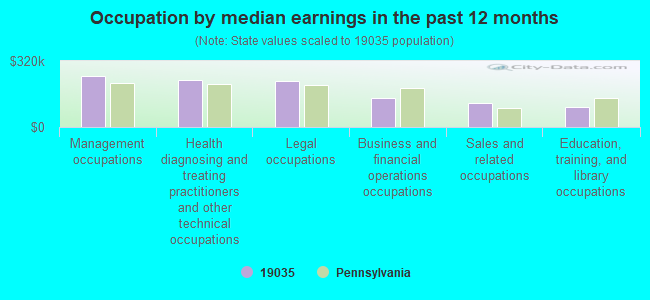
Occupation by median earnings in the past 12 months ($)
247,543Management occupations
226,544Health diagnosing and treating practitioners and other technical occupations
222,038Legal occupations
141,806Business and financial operations occupations
115,346Sales and related occupations
95,348Education, training, and library occupations
Companies with federal contracts located in this zip code:
EVANS HUNT CO (800 MILL CREEK RD in GLADWYNE, PA; small business) : $317,472 in 32 contractsfrom 2000 to 2006
Contracts for Valves, Nonpowered, Packing and Gasket Materials, Hose, Pipe, Tube, Lubrication, and Railing Fittings, Gears, Pulleys, Sprockets, and Transmission Chain, and moreby Defense Logistics Agency Signed by year:2000: $30,820; 2001: $125,465; 2002: $0; 2003: $0; 2004: $48,829; 2005: $76,578; 2006: $35,780.
Biggest contracts:
$51,405 with Defense Logistics Agency for Valves, Nonpowered. Signed on 2001-05-30. Completion date: 2002-02-14.
$43,210, same as above.Signed on 2001-04-06. Completion date: 2002-02-10.
$30,850, same as above.Signed on 2001-09-04. Completion date: 2002-03-09.
$30,820, same as above.Signed on 2000-02-18. Completion date: 2000-12-14.
NANO PLASMONICS LLC (1636 MONK RD in GLADWYNE, PA; small business)
$22,581 with Navy for Other Defense -- Applied Research and Exploratory Development (R&D). Taking place in FL. Signed on 2005-03-21. Completion date: 2004-11-30.
Top industries in this zip code by the number of employees in 2005:
Health Care and Social Assistance: Continuing Care Retirement Communities (250-499 employees: 1 establishment)
Health Care and Social Assistance: Home Health Care Services (100-249: 1)
Arts, Entertainment, and Recreation: Golf Courses and Country Clubs (100-249: 1)
Educational Services: Elementary and Secondary Schools (50-99: 1)
Other Services (except Public Administration): Religious Organizations (20-49: 1, 10-19: 1, 5-9: 1, 1-4: 1)
Administrative and Support and Waste Management and Remediation Services: Landscaping Services (20-49: 1, 1-4: 2)
Accommodation and Food Services: Full-Service Restaurants (20-49: 1, 1-4: 1)
Health Care and Social Assistance: Child Day Care Services (10-19: 1, 5-9: 1)
People in group quarters in 2010:
56 people in nursing facilities/skilled-nursing facilities
19 people in other noninstitutional facilities
People in group quarters in 2000:
285 people in other group homes
24 people in religious group quarters
Fatal accident statistics in 2014:
Fatal accident count: 1
Vehicles involved in fatal accidents: 3
Fatal accidents caused by drunken drivers: 0
Fatalities: 1
Persons involved in fatal accidents: 3
Pedestrians involved in fatal accidents: 0
Fatal accident statistics in 2010:
Fatal accident count: 1
Vehicles involved in fatal accidents: 2
Fatal accidents caused by drunken drivers: 0
Fatalities: 1
Persons involved in fatal accidents: 2
Pedestrians involved in fatal accidents: 0
Home Mortgage Disclosure Act Aggregated Statistics For Year 2009 (Based on 2 partial tracts)
A) FHA, FSA/RHS & VA Home Purchase Loans
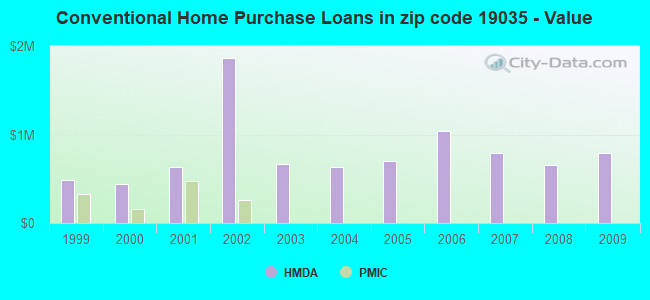
B) Conventional Home Purchase Loans
C) Refinancings
D) Home Improvement Loans
F) Non-occupant Loans on < 5 Family Dwellings (A B C & D)
Number
Average Value
Number
Average Value
Number
Average Value
Number
Average Value
Number
Average Value
LOANS ORIGINATED
2
$266,255
77
$787,892
294
$505,985
5
$269,972
15
$594,432
APPLICATIONS APPROVED, NOT ACCEPTED
0
$0
6
$376,163
23
$544,088
5
$206,812
2
$322,760
APPLICATIONS DENIED
3
$252,840
15
$938,811
87
$791,740
3
$197,113
0
$0
APPLICATIONS WITHDRAWN
0
$0
8
$484,524
57
$401,529
0
$0
3
$421,573
FILES CLOSED FOR INCOMPLETENESS
0
$0
3
$1,426,740
11
$500,426
0
$0
0
$0
Aggregated Statistics For Year 2008 (Based on 2 partial tracts)
B) Conventional Home Purchase Loans
C) Refinancings
D) Home Improvement Loans
F) Non-occupant Loans on < 5 Family Dwellings (A B C & D)
G) Loans On Manufactured Home Dwelling (A B C & D)
Number
Average Value
Number
Average Value
Number
Average Value
Number
Average Value
Number
Average Value
LOANS ORIGINATED
80
$650,141
104
$661,041
11
$369,831
11
$518,439
0
$0
APPLICATIONS APPROVED, NOT ACCEPTED
19
$657,248
28
$580,555
3
$87,203
2
$618,425
0
$0
APPLICATIONS DENIED
9
$1,094,436
25
$503,038
5
$145,202
0
$0
0
$0
APPLICATIONS WITHDRAWN
9
$710,532
31
$830,727
2
$774,000
0
$0
2
$71,210
FILES CLOSED FOR INCOMPLETENESS
3
$882,360
3
$336,947
3
$270,900
0
$0
0
$0
Aggregated Statistics For Year 2007 (Based on 2 partial tracts)
B) Conventional Home Purchase Loans
C) Refinancings
D) Home Improvement Loans
F) Non-occupant Loans on < 5 Family Dwellings (A B C & D)
Number
Average Value
Number
Average Value
Number
Average Value
Number
Average Value
LOANS ORIGINATED
111
$795,379
107
$750,722
22
$324,587
2
$417,960
APPLICATIONS APPROVED, NOT ACCEPTED
29
$957,091
20
$602,327
2
$154,800
0
$0
APPLICATIONS DENIED
15
$771,420
37
$580,040
11
$128,203
3
$514,453
APPLICATIONS WITHDRAWN
8
$816,570
17
$615,375
0
$0
0
$0
FILES CLOSED FOR INCOMPLETENESS
6
$259,807
5
$553,564
0
$0
0
$0
Aggregated Statistics For Year 2006 (Based on 2 partial tracts)
B) Conventional Home Purchase Loans
C) Refinancings
D) Home Improvement Loans
F) Non-occupant Loans on < 5 Family Dwellings (A B C & D)
G) Loans On Manufactured Home Dwelling (A B C & D)
Number
Average Value
Number
Average Value
Number
Average Value
Number
Average Value
Number
Average Value
LOANS ORIGINATED
111
$1,043,840
111
$640,816
26
$222,852
17
$840,564
2
$19,350
APPLICATIONS APPROVED, NOT ACCEPTED
22
$708,984
37
$676,058
19
$277,418
6
$541,542
0
$0
APPLICATIONS DENIED
17
$416,776
53
$687,662
3
$141,900
5
$622,606
0
$0
APPLICATIONS WITHDRAWN
17
$798,768
25
$575,980
0
$0
3
$1,220,340
0
$0
FILES CLOSED FOR INCOMPLETENESS
2
$470,590
9
$663,232
3
$121,260
0
$0
0
$0
Aggregated Statistics For Year 2005 (Based on 2 partial tracts)
B) Conventional Home Purchase Loans
C) Refinancings
D) Home Improvement Loans
F) Non-occupant Loans on < 5 Family Dwellings (A B C & D)
Number
Average Value
Number
Average Value
Number
Average Value
Number
Average Value
LOANS ORIGINATED
158
$705,222
187
$649,349
29
$338,425
15
$814,351
APPLICATIONS APPROVED, NOT ACCEPTED
19
$712,243
28
$524,440
6
$450,468
3
$223,427
APPLICATIONS DENIED
25
$464,524
34
$887,915
6
$363,780
9
$341,248
APPLICATIONS WITHDRAWN
23
$877,447
50
$618,828
3
$262,127
9
$1,029,936
FILES CLOSED FOR INCOMPLETENESS
8
$484,524
12
$627,843
2
$38,700
0
$0
Aggregated Statistics For Year 2004 (Based on 2 partial tracts)
B) Conventional Home Purchase Loans
C) Refinancings
D) Home Improvement Loans
F) Non-occupant Loans on < 5 Family Dwellings (A B C & D)
Number
Average Value
Number
Average Value
Number
Average Value
Number
Average Value
LOANS ORIGINATED
135
$633,705
217
$527,946
26
$240,357
11
$355,195
APPLICATIONS APPROVED, NOT ACCEPTED
17
$824,174
37
$393,276
5
$409,910
2
$367,650
APPLICATIONS DENIED
20
$758,830
46
$446,295
8
$154,412
0
$0
APPLICATIONS WITHDRAWN
29
$701,458
31
$657,301
2
$77,400
3
$812,183
FILES CLOSED FOR INCOMPLETENESS
5
$134,986
12
$812,184
0
$0
2
$25,540
Aggregated Statistics For Year 2003 (Based on 2 partial tracts)
B) Conventional Home Purchase Loans
C) Refinancings
D) Home Improvement Loans
F) Non-occupant Loans on < 5 Family Dwellings (A B C & D)
Number
Average Value
Number
Average Value
Number
Average Value
Number
Average Value
LOANS ORIGINATED
110
$671,522
706
$448,153
14
$422,714
19
$442,239
APPLICATIONS APPROVED, NOT ACCEPTED
15
$549,437
99
$401,026
9
$160,820
2
$51,860
APPLICATIONS DENIED
9
$516,688
104
$493,112
8
$275,738
6
$350,880
APPLICATIONS WITHDRAWN
23
$497,043
45
$573,620
2
$561,925
5
$438,084
FILES CLOSED FOR INCOMPLETENESS
2
$290,250
31
$495,210
3
$309,600
2
$328,175
Aggregated Statistics For Year 2002 (Based on 2 partial tracts)
A) FHA, FSA/RHS & VA Home Purchase Loans
B) Conventional Home Purchase Loans
C) Refinancings
D) Home Improvement Loans
F) Non-occupant Loans on < 5 Family Dwellings (A B C & D)
Number
Average Value
Number
Average Value
Number
Average Value
Number
Average Value
Number
Average Value
LOANS ORIGINATED
2
$18,189,000
105
$1,863,851
553
$2,364,608
8
$390,870
14
$6,242,421
APPLICATIONS APPROVED, NOT ACCEPTED
0
$0
20
$411,923
56
$283,312
3
$541,800
2
$332,820
APPLICATIONS DENIED
0
$0
8
$617,845
50
$567,559
2
$11,610
3
$436,020
APPLICATIONS WITHDRAWN
0
$0
11
$520,269
50
$1,715,091
2
$77,400
2
$615,330
FILES CLOSED FOR INCOMPLETENESS
0
$0
9
$562,784
17
$386,272
2
$77,400
0
$0
Aggregated Statistics For Year 2001 (Based on 2 partial tracts)
B) Conventional Home Purchase Loans
C) Refinancings
D) Home Improvement Loans
F) Non-occupant Loans on < 5 Family Dwellings (A B C & D)
Number
Average Value
Number
Average Value
Number
Average Value
Number
Average Value
LOANS ORIGINATED
122
$637,357
297
$419,690
14
$109,355
5
$3,424,796
APPLICATIONS APPROVED, NOT ACCEPTED
9
$871,180
29
$412,142
11
$81,763
2
$661,770
APPLICATIONS DENIED
22
$584,229
42
$642,125
8
$29,025
5
$171,208
APPLICATIONS WITHDRAWN
19
$326,873
34
$694,050
0
$0
0
$0
FILES CLOSED FOR INCOMPLETENESS
5
$798,768
17
$607,454
3
$98,040
0
$0
Aggregated Statistics For Year 2000 (Based on 2 partial tracts)
B) Conventional Home Purchase Loans
C) Refinancings
D) Home Improvement Loans
F) Non-occupant Loans on < 5 Family Dwellings (A B C & D)
Number
Average Value
Number
Average Value
Number
Average Value
Number
Average Value
LOANS ORIGINATED
111
$445,099
88
$410,326
37
$60,623
0
$0
APPLICATIONS APPROVED, NOT ACCEPTED
15
$455,525
12
$236,457
8
$70,628
0
$0
APPLICATIONS DENIED
25
$421,675
12
$244,197
8
$40,248
2
$23,220
APPLICATIONS WITHDRAWN
9
$779,160
17
$460,394
6
$79,722
0
$0
FILES CLOSED FOR INCOMPLETENESS
3
$515,483
3
$584,113
2
$77,400
0
$0
Aggregated Statistics For Year 1999 (Based on 1 partial tract)
B) Conventional Home Purchase Loans
C) Refinancings
D) Home Improvement Loans
F) Non-occupant Loans on < 5 Family Dwellings (A B C & D)
Detailed PMIC statistics for the following Tracts:2048.00
2005 - 2018 National Fire Incident Reporting System (NFIRS) incidents
Based on the data from the years 2005 - 2018 the average number of fires per year is 9. The highest number of fires - 31 took place in 2005, and the least - 0 in 2009. The data has a decreasing trend.
When looking into fire subcategories, the most reports belonged to: Mobile Property/Vehicle Fires (45.1%), and Structure Fires (27.9%).
Fire incident types reported to NFIRS in Zip Code 19035

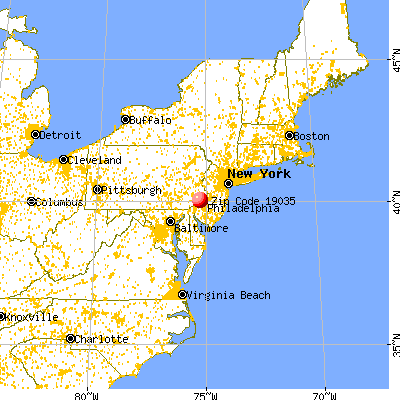


 Nearest zip codes: 19072, 19428, 19444, 19128, 19096, 19003.


 (Students: 557, Location: 230 WEST RIGHTERS MILL RD, Grades: KG-5)


 Based on the data from the years 2005 - 2018 the average number of fires per year is 9. The highest number of fires - 31 took place in 2005, and the least - 0 in 2009. The data has a decreasing trend.
 When looking into fire subcategories, the most reports belonged to: Mobile Property/Vehicle Fires (45.1%), and Structure Fires (27.9%).