Estimated zip code population in 2022: 1,916 Zip code population in 2010: 4,273 Zip code population in 2000: 3,631
March 2022 cost of living index in zip code 19373: 99.8 (near average, U.S. average is 100)
Land area: 4.1 sq. mi. Water area: 0.0 sq. mi.
Population density: 462 people per square mile
(low).
OSM Map
General Map
Google Map
MSN Map
OSM Map
General Map
Google Map
MSN Map
OSM Map
General Map
Google Map
MSN Map
OSM Map
General Map
Google Map
MSN Map
Please wait while loading the map...
Real estate property taxes paid for housing units in 2022:
This zip code:
0.9% ($6,775)
Pennsylvania:
1.3% ($3,094)
Median real estate property taxes paid for housing units with mortgages in 2022: $6,842 (0.9%) Median real estate property taxes paid for housing units with no mortgage in 2022: $6,275 (1.0%)
Business Search- 14 Million verified businesses
Males: 1,086
(56.7%)
Females: 830
(43.3%)
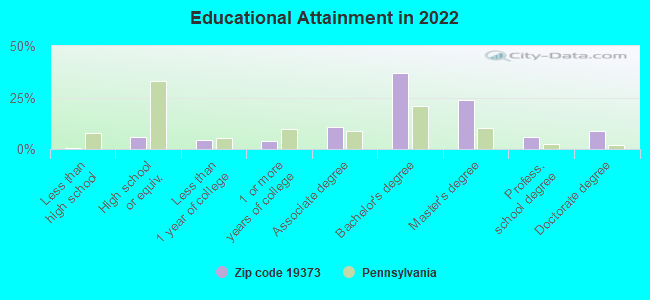
For population 25 years and over in 19373:
High school or higher: 102.1%
Bachelor's degree or higher: 76.8%
Graduate or professional degree: 39.2%
Unemployed: 1.5%
Mean travel time to work (commute): 26.2 minutes
For population 15 years and over in 19373:
Never married: 20.6%
Now married: 76.6%
Separated: 0.0%
Widowed: 2.8%
Divorced: 0.0%
Zip code 19373 compared to state average:
Median household income significantly above state average.
Median house value significantly above state average.
Unemployed percentage below state average.
Black race population percentage significantly below state average.
Median age above state average.
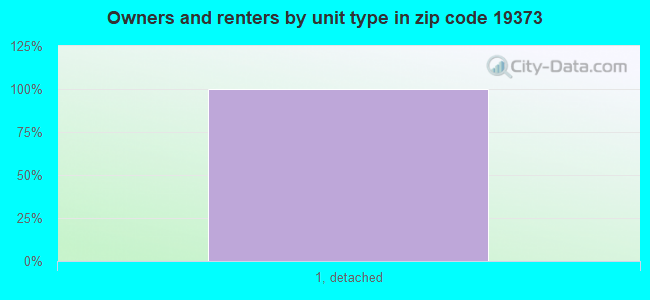
Renting percentage significantly below state average.
Number of rooms per house significantly above state average.
House age below state average.
Number of college students below state average.
Percentage of population with a bachelor's degree or higher above state average.
Averages for the 2020 tax year for zip code 19373, filed in 2021:
Average Adjusted Gross Income (AGI) in 2020: $155,757 (Individual Income Tax Returns)
Here:
$155,757
State:
$75,707
Salary/wage: $128,095 (reported on 83.1% of returns)
Here:
$128,095
State:
$62,806
(% of AGI for various income ranges: 1208.7% for AGIs below $25k, 3792.0% for AGIs $25k-50k, 7664.3% for AGIs $50k-75k, 9204.3% for AGIs $75k-100k, 20090.0% for AGIs $100k-200k, 92804.0% for AGIs over 200k)
Taxable interest for individuals: $1,971 (reported on 55.4% of returns)
This zip code:
$1,971
Pennsylvania:
$1,633
(% of AGI for various income ranges: 13.3% for AGIs below $25k, 34.0% for AGIs $25k-50k, 82.9% for AGIs $50k-75k, 72.9% for AGIs $75k-100k, 268.6% for AGIs $100k-200k, 880.0% for AGIs over 200k)
Ordinary dividends: $7,668 (reported on 47.7% of returns)
Here:
$7,668
State:
$7,382
(% of AGI for various income ranges: 116.7% for AGIs below $25k, 133.0% for AGIs $25k-50k, 235.7% for AGIs $50k-75k, 282.9% for AGIs $75k-100k, 675.0% for AGIs $100k-200k, 3138.0% for AGIs over 200k)
Net capital gain/loss in AGI: +$19,798 (reported on 43.1% of returns)
Here:
+$19,798
State:
+$23,522
(% of AGI for various income ranges: 42.0% for AGIs below $25k, 32.0% for AGIs $25k-50k, 280.0% for AGIs $50k-75k, 422.9% for AGIs $75k-100k, 1045.7% for AGIs $100k-200k, 9036.0% for AGIs over 200k)
Profit/loss from business: +$39,942 (reported on 20.0% of returns)
Here:
+$39,942
State:
+$16,274
(% of AGI for various income ranges: 138.7% for AGIs below $25k, 230.0% for AGIs $25k-50k, 671.4% for AGIs $50k-75k, 321.4% for AGIs $75k-100k, 1630.7% for AGIs $100k-200k, 6969.0% for AGIs over 200k)
Taxable individual retirement arrangement distribution: $29,137 (reported on 14.6% of returns)
19373:
$29,137
Pennsylvania:
$18,583
(% of AGI for various income ranges: 184.7% for AGIs below $25k, 1314.3% for AGIs $50k-75k, 1782.9% for AGIs $100k-200k, 1843.0% for AGIs over 200k)
Self-employed (Keogh) retirement plans: $38,800 (reported on 2.3% of returns)
19373:
$38,800
Pennsylvania:
$25,407
(% of AGI for various income ranges: 1164.0% for AGIs over 200k)
Total itemized deductions: $33,973 (reported on 23.1% of returns)
Here:
$33,973
State:
$34,850
(% of AGI for various income ranges: 2228.6% for AGIs $50k-75k, 1991.4% for AGIs $100k-200k, 5844.0% for AGIs over 200k)
Charity contributions: $6,293 (reported on 20.8% of returns)
Here:
$6,293
State:
$12,392
(% of AGI for various income ranges: 165.7% for AGIs $50k-75k, 292.9% for AGIs $100k-200k, 1173.0% for AGIs over 200k)
Taxes paid: $9,350 (reported on 23.1% of returns)
19373:
$9,350
State:
$8,200
(% of AGI for various income ranges: 520.0% for AGIs $50k-75k, 597.9% for AGIs $100k-200k, 1604.0% for AGIs over 200k)
Earned income credit: $1,225 (reported on 3.1% of returns)
Here:
$1,225
State:
$2,100
(% of AGI for various income ranges: 32.7% for AGIs below $25k)
Percentage of individuals using paid preparers for their 2020 taxes: 90.8%
Here:
91%
State:
92%
(% for various income ranges: 86.7% for AGIs below $25k, 92.9% for AGIs $25k-50k, 91.7% for AGIs $50k-75k, 90.9% for AGIs $75k-100k, 93.1% for AGIs $100k-200k, 91.2% for AGIs over 200k)
Averages for the 2012 tax year for zip code 19373, filed in 2013:
Average Adjusted Gross Income (AGI) in 2012: $132,348 (Individual Income Tax Returns)
Here:
$132,348
State:
$61,346
Salary/wage: $104,665 (reported on 88.1% of returns)
Here:
$104,665
State:
$51,902
(% of AGI for various income ranges: 75.3% for AGIs below $25k, 68.5% for AGIs $25k-50k, 70.1% for AGIs $50k-75k, 70.8% for AGIs $75k-100k, 77.2% for AGIs $100k-200k, 66.4% for AGIs over 200k)
Taxable interest for individuals: $1,472 (reported on 57.8% of returns)
This zip code:
$1,472
Pennsylvania:
$1,588
(% of AGI for various income ranges: 2.1% for AGIs below $25k, 2.0% for AGIs $25k-50k, 1.0% for AGIs $50k-75k, 1.3% for AGIs $75k-100k, 0.6% for AGIs $100k-200k, 0.5% for AGIs over 200k)
Ordinary dividends: $4,611 (reported on 45.9% of returns)
Here:
$4,611
State:
$5,827
(% of AGI for various income ranges: 3.8% for AGIs below $25k, 3.0% for AGIs $25k-50k, 3.7% for AGIs $50k-75k, 2.8% for AGIs $75k-100k, 1.9% for AGIs $100k-200k, 1.1% for AGIs over 200k)
Net capital gain/loss in AGI: +$5,770 (reported on 37.0% of returns)
Here:
+$5,770
State:
+$14,495
(% of AGI for various income ranges: 22.5% for AGIs below $25k, 1.4% for AGIs $25k-50k, 1.7% for AGIs $75k-100k, 0.2% for AGIs $100k-200k, 2.3% for AGIs over 200k)
Profit/loss from business: +$34,542 (reported on 19.3% of returns)
Here:
+$34,542
State:
+$16,268
(% of AGI for various income ranges: 7.4% for AGIs below $25k, 8.9% for AGIs $25k-50k, 5.0% for AGIs $50k-75k, 2.9% for AGIs $75k-100k, 7.3% for AGIs $100k-200k, 4.1% for AGIs over 200k)
Taxable individual retirement arrangement distribution: $24,617 (reported on 13.3% of returns)
19373:
$24,617
Pennsylvania:
$14,550
(% of AGI for various income ranges: 6.0% for AGIs $25k-50k, 4.3% for AGIs $50k-75k, 4.6% for AGIs $75k-100k, 3.6% for AGIs $100k-200k, 1.6% for AGIs over 200k)
Self-employment retirement plans: $20,975 (reported on 3.0% of returns)
19373:
$20,975
Pennsylvania:
$20,922
Total itemized deductions: $34,747 (16% of AGI, reported on 56.3% of returns)
Here:
$34,747
State:
$23,538
Here:
16.4% of AGI
State:
18.4% of AGI
(% of AGI for various income ranges: 17.0% for AGIs below $25k, 19.2% for AGIs $25k-50k, 20.4% for AGIs $50k-75k, 20.7% for AGIs $75k-100k, 17.8% for AGIs $100k-200k, 12.3% for AGIs over 200k)
Charity contributions: $4,121 (reported on 52.6% of returns)
Here:
$4,121
State:
$4,025
(% of AGI for various income ranges: 2.0% for AGIs $25k-50k, 1.3% for AGIs $50k-75k, 2.2% for AGIs $75k-100k, 1.6% for AGIs $100k-200k, 1.6% for AGIs over 200k)
Taxes paid: $16,866 (reported on 56.3% of returns)
19373:
$16,866
State:
$9,982
(% of AGI for various income ranges: 4.5% for AGIs below $25k, 6.4% for AGIs $25k-50k, 8.4% for AGIs $50k-75k, 8.2% for AGIs $75k-100k, 8.3% for AGIs $100k-200k, 6.7% for AGIs over 200k)
Earned income credit: $1,233 (reported on 4.4% of returns)
Here:
$1,233
State:
$2,106
(% of AGI for various income ranges: 2.1% for AGIs below $25k)
Percentage of individuals using paid preparers for their 2012 taxes: 57.8%
Here:
58%
State:
53%
(% for various income ranges: 46.3% for AGIs below $25k, 57.1% for AGIs $25k-50k, 63.6% for AGIs $50k-75k, 76.9% for AGIs $75k-100k, 56.7% for AGIs $100k-200k, 65.4% for AGIs over 200k)
Averages for the 2004 tax year for zip code 19373, filed in 2005:
Average Adjusted Gross Income (AGI) in 2004: $98,817 (Individual Income Tax Returns)
Here:
$98,817
State:
$48,049
Salary/wage: $87,772 (reported on 85.8% of returns)
Here:
$87,772
State:
$42,646
(% of AGI for various income ranges: 104.7% for AGIs below $10k, 73.2% for AGIs $10k-25k, 71.7% for AGIs $25k-50k, 67.3% for AGIs $50k-75k, 66.4% for AGIs $75k-100k, 78.2% for AGIs over 100k)
Taxable interest for individuals: $1,644 (reported on 66.7% of returns)
This zip code:
$1,644
Pennsylvania:
$1,657
(% of AGI for various income ranges: 5.3% for AGIs below $10k, 4.4% for AGIs $10k-25k, 2.3% for AGIs $25k-50k, 1.4% for AGIs $50k-75k, 1.8% for AGIs $75k-100k, 0.8% for AGIs over 100k)
Taxable dividends: $2,950 (reported on 51.0% of returns)
Here:
$2,950
State:
$3,566
(% of AGI for various income ranges: 7.5% for AGIs below $10k, 4.1% for AGIs $10k-25k, 3.2% for AGIs $25k-50k, 2.4% for AGIs $50k-75k, 3.1% for AGIs $75k-100k, 1.1% for AGIs over 100k)
Net capital gain/loss: +$8,204 (reported on 41.0% of returns)
Here:
+$8,204
State:
+$9,716
(% of AGI for various income ranges: -1.5% for AGIs below $10k, -0.3% for AGIs $10k-25k, 0.4% for AGIs $25k-50k, 0.6% for AGIs $50k-75k, 1.3% for AGIs $75k-100k, 4.2% for AGIs over 100k)
Profit/loss from business: +$35,939 (reported on 17.6% of returns)
Here:
+$35,939
State:
+$14,267
(% of AGI for various income ranges: 2.3% for AGIs below $10k, 6.3% for AGIs $10k-25k, 4.9% for AGIs $25k-50k, 8.3% for AGIs $50k-75k, 12.0% for AGIs $75k-100k, 5.7% for AGIs over 100k)
IRA payment deduction: $3,702 (reported on 3.9% of returns)
19373:
$3,702
Pennsylvania:
$2,903
(% of AGI for various income ranges: 0.7% for AGIs $50k-75k, 0.3% for AGIs $75k-100k, 0.1% for AGIs over 100k)
Self-employed pension: $16,757 (reported on 3.1% of returns)
Here:
$16,757
Pennsylvania:
$14,674
Total itemized deductions: $26,782 (17% of AGI, reported on 58.7% of returns)
Here:
$26,782
State:
$18,804
Here:
17.4% of AGI
State:
19.5% of AGI
(% of AGI for various income ranges: 20.5% for AGIs $10k-25k, 22.2% for AGIs $25k-50k, 23.3% for AGIs $50k-75k, 23.2% for AGIs $75k-100k, 14.1% for AGIs over 100k)
Charity contributions deductions: $3,607 (2% of AGI, reported on 56.4% of returns)
Here:
$3,607
State:
$3,337
Here:
2.3% of AGI
State:
3.3% of AGI
(% of AGI for various income ranges: 2.2% for AGIs $10k-25k, 2.2% for AGIs $25k-50k, 2.9% for AGIs $50k-75k, 2.8% for AGIs $75k-100k, 1.9% for AGIs over 100k)
Total tax: $20,686 (reported on 83.9% of returns)
19373:
$20,686
State:
$8,008
(% of AGI for various income ranges: 2.5% for AGIs below $10k, 5.8% for AGIs $10k-25k, 7.3% for AGIs $25k-50k, 9.1% for AGIs $50k-75k, 10.0% for AGIs $75k-100k, 20.1% for AGIs over 100k)
Earned income credit: $1,231 (reported on 3.2% of returns)
Here:
$1,231
State:
$1,643
Percentage of individuals using paid preparers for their 2004 taxes: 55.0%
Here:
55%
State:
56%
(% for various income ranges: 46.7% for AGIs below $10k, 52.5% for AGIs $10k-25k, 53.0% for AGIs $25k-50k, 59.9% for AGIs $50k-75k, 59.0% for AGIs $75k-100k, 58.8% for AGIs over 100k)
Household received Food Stamps/SNAP in the past 12 months: 0 Household did not receive Food Stamps/SNAP in the past 12 months: 671
Women who had a birth in the past 12 months: 16 (17 now married, 0 unmarried) Women who did not have a birth in the past 12 months: 277 (199 now married, 74 unmarried)
Housing units in zip code 19373 with a mortgage: 583 (73 second mortgage, 72 both second mortgage and home equity loan) Houses without a mortgage: 29
Median monthly owner costs for units with a mortgage: $3,078 Median monthly owner costs for units without a mortgage: $1,013
Residents with income below the poverty level in 2022:
This zip code:
0.2%
Whole state:
11.8%
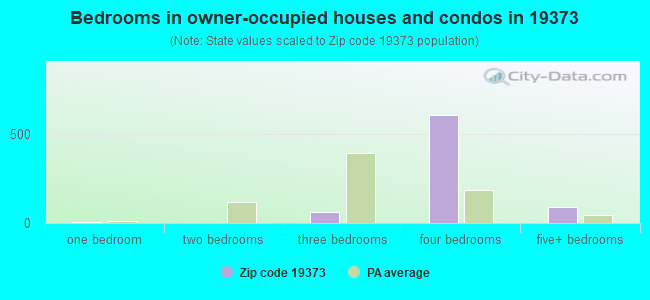
Median number of rooms in houses and condos:
Here:
10.0
State:
6.8
Notable locations in this zip code not listed on our city pages
Notable locations in zip code 19373: Brintons Mill (A), Brinton Lake Corporate Center (B), Concordville Industrial Park (C), Penn Oaks Country Club (D), Camp Sunshine (E). Display/hide their locations on the map
In group quarters: 9 (-1 institutionalized population)
Size of family households: 307 2-persons, 209 3-persons, 88 4-persons, 36 5-persons, 2 7-or-more-persons
Size of nonfamily households: 24 1-person
381 married couples with children.
0 single-parent households ().
94.7% of residents of 19373 zip code speak English at home.
0.8% of residents speak Spanish at home (100% very well).
3.2% of residents speak other Indo-European language at home (43% very well, 57% well).
0.3% of residents speak Asian or Pacific Island language at home (100% well).
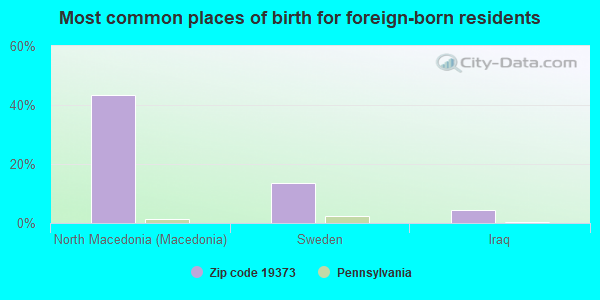
Foreign born population: 113 (5.9%) (100.0% of them are naturalized citizens)
This zip code:
5.9%
Whole state:
7.5%
43%North Macedonia (Macedonia)
14%Sweden
5%Iraq
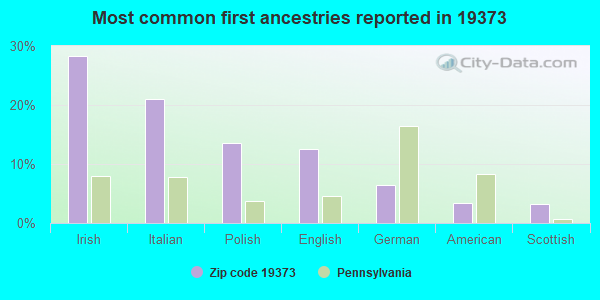
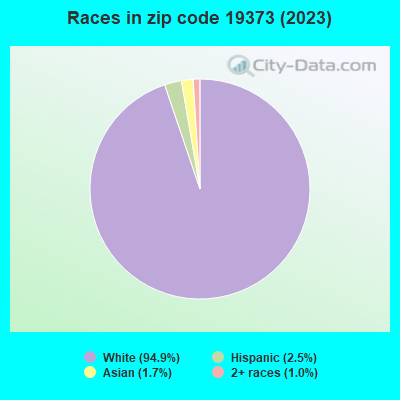
28%Irish
21%Italian
14%Polish
13%English
6%German
3%American
3%Scottish
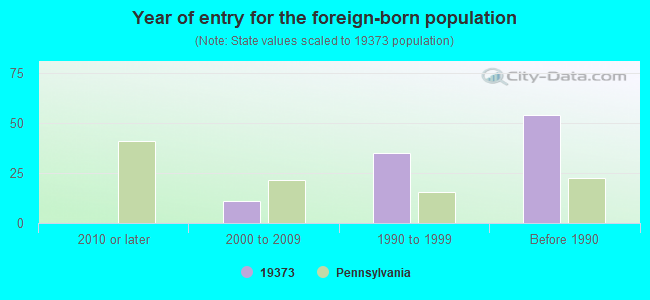
Year of entry for the foreign-born population
02010 or later
42000 to 2009
371990 to 1999
70Before 1990
Facilities with environmental interests located in this zip code:
ALI SRSTP (25 LONGVIEW DR in THORNTON, PA)
STATE MASTER (Pennsylvania database) - PCS-PA0058432, National Pollutant Discharge Elimination System Permit National Pollutant Discharge Elimination System NON-MAJOR (Tracking pollutant discharge elimination systems) - permit Business SIC classification: PRIVATE HOUSEHOLDS Alternative names: DR SAID ALI, SAID, DR ALI
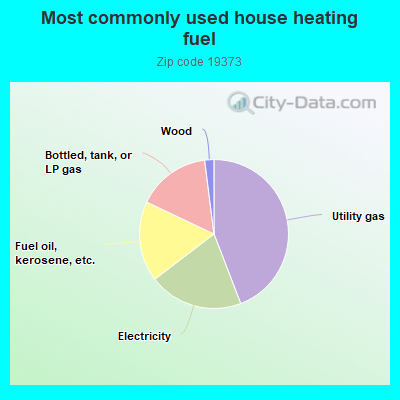
44.3%Utility gas
20.5%Electricity
17.5%Fuel oil, kerosene, etc.
16.0%Bottled, tank, or LP gas
2.0%Wood
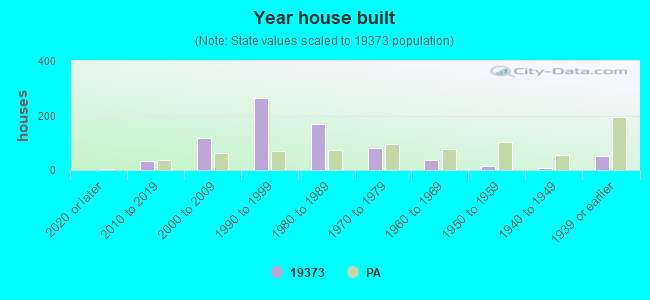
Population in 1990: 2,305. Population change in the 1990s: +1,326 (+57.5%).
Place of birth for U.S.-born residents:
This state: 1,290
Northeast: 124
Midwest: 93
South: 277
West: 6
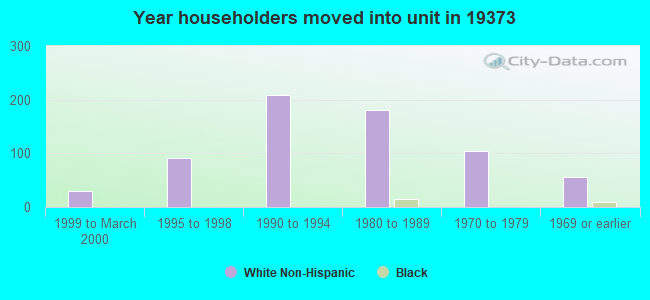
51% of the 19373 zip code residents lived in the same house 5 years ago. Out of people who lived in different houses, 16% lived in this county. Out of people who lived in different counties, 50% lived in Pennsylvania.
96% of the 19373 zip code residents lived in the same house 1 year ago. Out of people who lived in different houses, 10% moved from this county. Out of people who lived in different houses, 69% moved from different county within same state. Out of people who lived in different houses, 24% moved from different state.
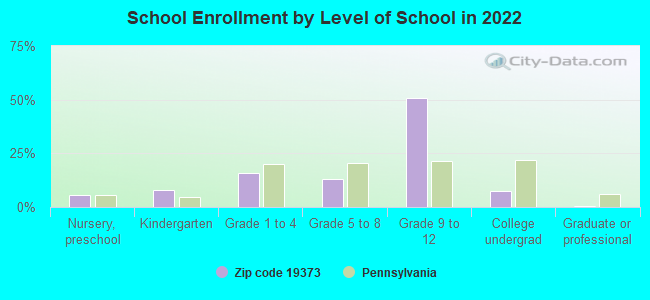
Private vs. public school enrollment:
Students in private schools in grades 1 to 8 (elementary and middle school): 38
Here:
31.0%
Pennsylvania:
15.7%
Students in private schools in grades 9 to 12 (high school): 12
Here:
5.7%
Pennsylvania:
13.4%
Students in private undergraduate colleges: 31
Here:
100.0%
Pennsylvania:
39.8%
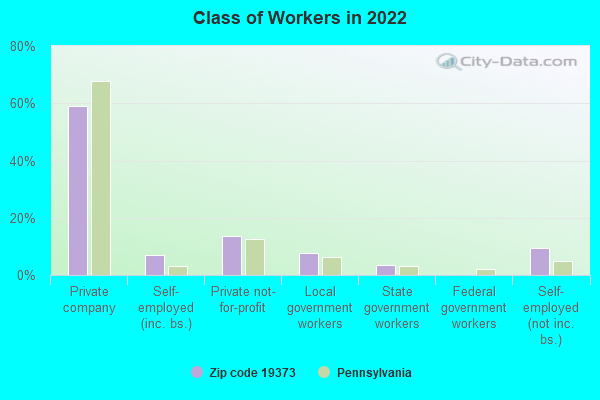
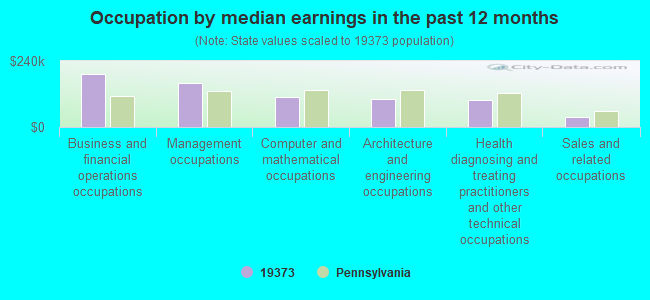
Occupation by median earnings in the past 12 months ($)
191,328Business and financial operations occupations
161,212Management occupations
110,206Computer and mathematical occupations
101,986Architecture and engineering occupations
96,647Health diagnosing and treating practitioners and other technical occupations
35,916Sales and related occupations
Top industries in this zip code by the number of employees in 2005:
Administrative and Support and Waste Management and Remediation Services: Security Guards and Patrol Services (250-499 employees: 1 establishment)
Accommodation and Food Services: Full-Service Restaurants (20-49: 1)
Administrative and Support and Waste Management and Remediation Services: Landscaping Services (10-19: 1, 5-9: 1, 1-4: 2)
Health Care and Social Assistance: Residential Mental Retardation Facilities (10-19: 1, 1-4: 1)
Other Services (except Public Administration): Religious Organizations (10-19: 1)
Professional, Scientific, and Technical Services: Computer Systems Design Services (10-19: 1)
Professional, Scientific, and Technical Services: Other Computer Related Services (10-19: 1)
Health Care and Social Assistance: Other Individual and Family Services (5-9: 1, 1-4: 1)
Construction: Plumbing, Heating, and Air-Conditioning Contractors (5-9: 1, 1-4: 1)
Construction: New Single-Family Housing Construction (except Operative Builders) (5-9: 1, 1-4: 1)
People in group quarters in 2010:
1,589 people in local jails and other municipal confinement facilities
6 people in group homes intended for adults
People in group quarters in 2000:
1,306 people in local jails and other confinement facilities (including police lockups)
14 people in other types of correctional institutions
14 people in homes for the mentally retarded
Home Mortgage Disclosure Act Aggregated Statistics For Year 2009 (Based on 4 partial tracts)
A) FHA, FSA/RHS & VA Home Purchase Loans
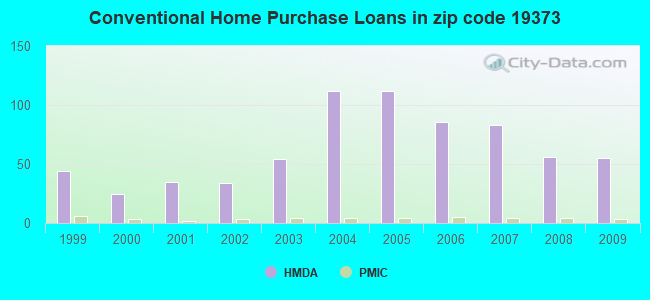
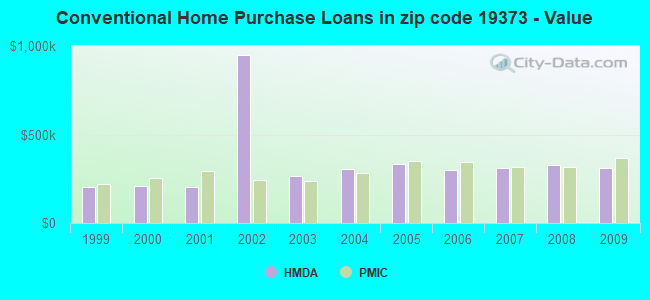
B) Conventional Home Purchase Loans
C) Refinancings
D) Home Improvement Loans
F) Non-occupant Loans on < 5 Family Dwellings (A B C & D)
G) Loans On Manufactured Home Dwelling (A B C & D)
Number
Average Value
Number
Average Value
Number
Average Value
Number
Average Value
Number
Average Value
Number
Average Value
LOANS ORIGINATED
7
$324,651
55
$313,501
228
$300,421
15
$130,022
4
$283,540
0
$0
APPLICATIONS APPROVED, NOT ACCEPTED
1
$516,620
5
$345,904
16
$347,218
2
$35,460
0
$0
1
$17,180
APPLICATIONS DENIED
1
$157,980
3
$257,703
55
$336,188
7
$91,694
1
$200,110
0
$0
APPLICATIONS WITHDRAWN
2
$215,510
4
$264,552
47
$317,534
3
$121,133
1
$240,890
0
$0
FILES CLOSED FOR INCOMPLETENESS
0
$0
0
$0
10
$363,713
1
$41,680
0
$0
0
$0
Aggregated Statistics For Year 2008 (Based on 4 partial tracts)
A) FHA, FSA/RHS & VA Home Purchase Loans
B) Conventional Home Purchase Loans
C) Refinancings
D) Home Improvement Loans
F) Non-occupant Loans on < 5 Family Dwellings (A B C & D)
G) Loans On Manufactured Home Dwelling (A B C & D)
Number
Average Value
Number
Average Value
Number
Average Value
Number
Average Value
Number
Average Value
Number
Average Value
LOANS ORIGINATED
0
$0
56
$330,398
106
$280,592
19
$92,218
5
$314,444
0
$0
APPLICATIONS APPROVED, NOT ACCEPTED
1
$50,150
5
$278,946
19
$224,414
4
$77,885
1
$96,740
0
$0
APPLICATIONS DENIED
0
$0
6
$231,727
31
$376,412
10
$105,615
2
$141,290
1
$55,650
APPLICATIONS WITHDRAWN
0
$0
6
$282,073
16
$532,235
3
$182,323
1
$286,480
0
$0
FILES CLOSED FOR INCOMPLETENESS
0
$0
2
$291,920
7
$429,291
0
$0
0
$0
0
$0
Aggregated Statistics For Year 2007 (Based on 4 partial tracts)
B) Conventional Home Purchase Loans
C) Refinancings
D) Home Improvement Loans
F) Non-occupant Loans on < 5 Family Dwellings (A B C & D)
Number
Average Value
Number
Average Value
Number
Average Value
Number
Average Value
LOANS ORIGINATED
83
$311,184
85
$272,171
29
$100,708
7
$281,760
APPLICATIONS APPROVED, NOT ACCEPTED
7
$259,747
19
$257,924
4
$59,885
0
$0
APPLICATIONS DENIED
7
$376,074
40
$274,594
12
$165,962
3
$238,643
APPLICATIONS WITHDRAWN
6
$376,922
17
$361,844
2
$323,670
1
$240,450
FILES CLOSED FOR INCOMPLETENESS
3
$306,080
10
$410,290
0
$0
0
$0
Aggregated Statistics For Year 2006 (Based on 4 partial tracts)
B) Conventional Home Purchase Loans
C) Refinancings
D) Home Improvement Loans
F) Non-occupant Loans on < 5 Family Dwellings (A B C & D)
Number
Average Value
Number
Average Value
Number
Average Value
Number
Average Value
LOANS ORIGINATED
86
$298,266
111
$250,898
40
$93,928
6
$187,300
APPLICATIONS APPROVED, NOT ACCEPTED
8
$322,146
21
$224,719
9
$91,916
1
$138,310
APPLICATIONS DENIED
4
$345,185
56
$368,059
21
$211,223
0
$0
APPLICATIONS WITHDRAWN
5
$194,262
22
$309,756
2
$113,530
1
$296,470
FILES CLOSED FOR INCOMPLETENESS
2
$194,615
5
$335,372
2
$119,780
0
$0
Aggregated Statistics For Year 2005 (Based on 4 partial tracts)
B) Conventional Home Purchase Loans
C) Refinancings
D) Home Improvement Loans
F) Non-occupant Loans on < 5 Family Dwellings (A B C & D)
Number
Average Value
Number
Average Value
Number
Average Value
Number
Average Value
LOANS ORIGINATED
112
$334,274
128
$260,647
26
$127,868
5
$280,624
APPLICATIONS APPROVED, NOT ACCEPTED
16
$309,826
20
$259,844
3
$56,397
1
$173,780
APPLICATIONS DENIED
10
$379,654
39
$308,763
9
$171,524
2
$257,285
APPLICATIONS WITHDRAWN
13
$332,124
39
$294,169
5
$113,254
0
$0
FILES CLOSED FOR INCOMPLETENESS
2
$418,675
14
$329,106
2
$183,085
0
$0
Aggregated Statistics For Year 2004 (Based on 4 partial tracts)
B) Conventional Home Purchase Loans
C) Refinancings
D) Home Improvement Loans
F) Non-occupant Loans on < 5 Family Dwellings (A B C & D)
Number
Average Value
Number
Average Value
Number
Average Value
Number
Average Value
LOANS ORIGINATED
112
$306,912
142
$248,050
24
$96,817
1
$193,470
APPLICATIONS APPROVED, NOT ACCEPTED
15
$347,681
29
$268,744
8
$75,610
0
$0
APPLICATIONS DENIED
8
$323,186
49
$265,903
10
$140,553
3
$133,107
APPLICATIONS WITHDRAWN
8
$327,704
26
$251,276
5
$202,046
0
$0
FILES CLOSED FOR INCOMPLETENESS
3
$248,713
23
$296,659
3
$128,817
0
$0
Aggregated Statistics For Year 2003 (Based on 4 partial tracts)
B) Conventional Home Purchase Loans
C) Refinancings
D) Home Improvement Loans
E) Loans on Dwellings For 5+ Families
F) Non-occupant Loans on < 5 Family Dwellings (A B C & D)
Number
Average Value
Number
Average Value
Number
Average Value
Number
Average Value
Number
Average Value
LOANS ORIGINATED
54
$268,310
419
$219,607
22
$90,573
1
$210,910
4
$224,332
APPLICATIONS APPROVED, NOT ACCEPTED
8
$296,462
50
$224,244
7
$45,433
0
$0
1
$154,580
APPLICATIONS DENIED
3
$226,570
59
$253,992
8
$55,251
0
$0
1
$140,020
APPLICATIONS WITHDRAWN
8
$268,856
44
$237,278
2
$63,920
0
$0
0
$0
FILES CLOSED FOR INCOMPLETENESS
2
$253,430
13
$225,368
3
$62,503
0
$0
0
$0
Aggregated Statistics For Year 2002 (Based on 2 partial tracts)
B) Conventional Home Purchase Loans
C) Refinancings
D) Home Improvement Loans
F) Non-occupant Loans on < 5 Family Dwellings (A B C & D)
Number
Average Value
Number
Average Value
Number
Average Value
Number
Average Value
LOANS ORIGINATED
34
$948,048
69
$371,127
7
$63,679
1
$166,090
APPLICATIONS APPROVED, NOT ACCEPTED
5
$243,806
10
$193,309
3
$39,680
0
$0
APPLICATIONS DENIED
1
$234,030
10
$182,723
2
$108,600
0
$0
APPLICATIONS WITHDRAWN
4
$1,850,092
9
$190,632
1
$39,140
0
$0
FILES CLOSED FOR INCOMPLETENESS
1
$111,130
4
$200,062
0
$0
0
$0
Aggregated Statistics For Year 2001 (Based on 2 partial tracts)
B) Conventional Home Purchase Loans
C) Refinancings
D) Home Improvement Loans
F) Non-occupant Loans on < 5 Family Dwellings (A B C & D)
Number
Average Value
Number
Average Value
Number
Average Value
Number
Average Value
LOANS ORIGINATED
35
$202,783
39
$190,518
7
$54,177
1
$33,460
APPLICATIONS APPROVED, NOT ACCEPTED
3
$206,450
6
$148,247
2
$28,595
0
$0
APPLICATIONS DENIED
2
$215,270
10
$174,185
2
$51,510
0
$0
APPLICATIONS WITHDRAWN
4
$270,080
6
$144,630
1
$42,390
0
$0
FILES CLOSED FOR INCOMPLETENESS
2
$199,960
1
$258,370
1
$31,430
0
$0
Aggregated Statistics For Year 2000 (Based on 2 partial tracts)
B) Conventional Home Purchase Loans
C) Refinancings
D) Home Improvement Loans
F) Non-occupant Loans on < 5 Family Dwellings (A B C & D)
Number
Average Value
Number
Average Value
Number
Average Value
Number
Average Value
LOANS ORIGINATED
25
$210,652
9
$113,568
5
$41,330
0
$0
APPLICATIONS APPROVED, NOT ACCEPTED
4
$191,645
3
$179,750
4
$36,250
0
$0
APPLICATIONS DENIED
2
$106,165
4
$145,712
2
$40,865
1
$98,360
APPLICATIONS WITHDRAWN
2
$140,945
3
$106,943
2
$37,925
0
$0
FILES CLOSED FOR INCOMPLETENESS
0
$0
1
$113,970
1
$41,570
0
$0
Aggregated Statistics For Year 1999 (Based on 2 partial tracts)
B) Conventional Home Purchase Loans
C) Refinancings
D) Home Improvement Loans
F) Non-occupant Loans on < 5 Family Dwellings (A B C & D)

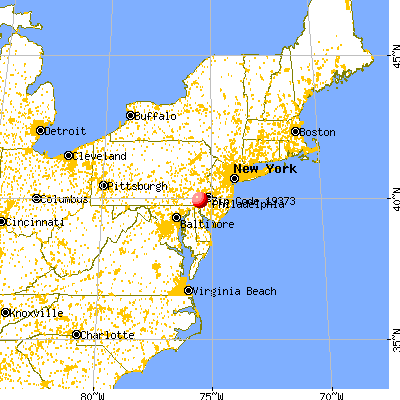


 Nearest zip codes: 19319, 19342, 19060, 19017, 19317, 19382.