Estimated zip code population in 2022: 17,361 Zip code population in 2010: 13,922 Zip code population in 2000: 7,520
Houses and condos: 5,933 Renter-occupied apartments: 573
% of renters here:
10%
State:
31%
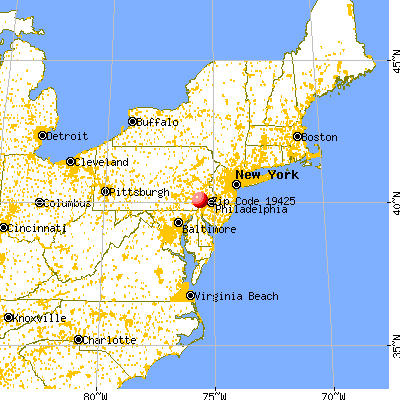
March 2022 cost of living index in zip code 19425: 107.5 (more than average, U.S. average is 100)
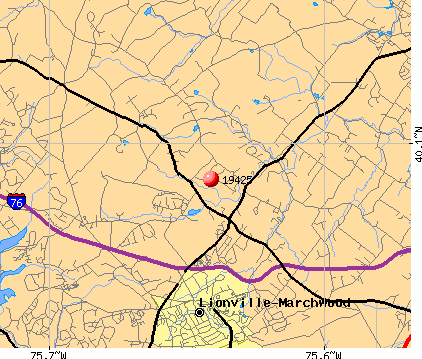
Land area: 26.9 sq. mi. Water area: 0.2 sq. mi.
Population density: 644 people per square mile
(low).
OSM Map
General Map
Google Map
MSN Map
OSM Map
General Map
Google Map
MSN Map
OSM Map
General Map
Google Map
MSN Map
OSM Map
General Map
Google Map
MSN Map
Please wait while loading the map...
Real estate property taxes paid for housing units in 2022:
This zip code:
1.3% ($8,614)
Pennsylvania:
1.3% ($3,094)
Median real estate property taxes paid for housing units with mortgages in 2022: $8,847 (1.3%) Median real estate property taxes paid for housing units with no mortgage in 2022: $7,842 (1.3%)
Estimated median house/condo value in 2022: $652,713
19425:
$652,713
Pennsylvania:
$245,500
According to our research of Pennsylvania and other state lists, there were 5 registered sex offenders living in 19425 zip code as of June 02, 2024. The ratio of all residents to sex offenders in zip code 19425 is 3,031 to 1. The ratio of registered sex offenders to all residents in this zip code is much lower than the state average.
Median resident age:
This zip code:
41.3 years
Pennsylvania median age:
40.9 years
Average household size:
This zip code:
3.0 people
Pennsylvania:
2.4 people
Averages for the 2020 tax year for zip code 19425, filed in 2021:
Average Adjusted Gross Income (AGI) in 2020: $222,561 (Individual Income Tax Returns)
Here:
$222,561
State:
$75,707
Salary/wage: $156,885 (reported on 84.3% of returns)
Here:
$156,885
State:
$62,806
(% of AGI for various income ranges: 1161.9% for AGIs below $25k, 3786.8% for AGIs $25k-50k, 6811.6% for AGIs $50k-75k, 10132.2% for AGIs $75k-100k, 20663.6% for AGIs $100k-200k, 111659.5% for AGIs over 200k)
Taxable interest for individuals: $3,229 (reported on 53.4% of returns)
This zip code:
$3,229
Pennsylvania:
$1,633
(% of AGI for various income ranges: 48.9% for AGIs below $25k, 57.7% for AGIs $25k-50k, 105.6% for AGIs $50k-75k, 109.4% for AGIs $75k-100k, 166.8% for AGIs $100k-200k, 1568.0% for AGIs over 200k)
Ordinary dividends: $13,709 (reported on 50.1% of returns)
Here:
$13,709
State:
$7,382
(% of AGI for various income ranges: 100.0% for AGIs below $25k, 163.8% for AGIs $25k-50k, 281.8% for AGIs $50k-75k, 314.7% for AGIs $75k-100k, 582.8% for AGIs $100k-200k, 6685.8% for AGIs over 200k)
Net capital gain/loss in AGI: +$48,618 (reported on 45.7% of returns)
Here:
+$48,618
State:
+$23,522
(% of AGI for various income ranges: 70.3% for AGIs below $25k, 137.2% for AGIs $25k-50k, 273.3% for AGIs $50k-75k, 334.2% for AGIs $75k-100k, 854.4% for AGIs $100k-200k, 24618.0% for AGIs over 200k)
Profit/loss from business: +$36,227 (reported on 17.5% of returns)
Here:
+$36,227
State:
+$16,274
(% of AGI for various income ranges: 149.4% for AGIs below $25k, 321.9% for AGIs $25k-50k, 418.7% for AGIs $50k-75k, 738.6% for AGIs $75k-100k, 824.4% for AGIs $100k-200k, 5210.9% for AGIs over 200k)
Taxable individual retirement arrangement distribution: $33,462 (reported on 11.1% of returns)
19425:
$33,462
Pennsylvania:
$18,583
(% of AGI for various income ranges: 104.2% for AGIs below $25k, 225.1% for AGIs $25k-50k, 342.2% for AGIs $50k-75k, 664.7% for AGIs $75k-100k, 946.5% for AGIs $100k-200k, 2091.2% for AGIs over 200k)
Self-employed (Keogh) retirement plans: $28,056 (reported on 2.3% of returns)
19425:
$28,056
Pennsylvania:
$25,407
(% of AGI for various income ranges: 104.2% for AGIs $100k-200k, 618.2% for AGIs over 200k)
Total itemized deductions: $37,614 (reported on 24.3% of returns)
Here:
$37,614
State:
$34,850
(% of AGI for various income ranges: 169.7% for AGIs below $25k, 309.1% for AGIs $25k-50k, 537.8% for AGIs $50k-75k, 873.9% for AGIs $75k-100k, 1490.6% for AGIs $100k-200k, 7322.8% for AGIs over 200k)
Charity contributions: $11,187 (reported on 20.9% of returns)
Here:
$11,187
State:
$12,392
(% of AGI for various income ranges: 4.4% for AGIs below $25k, 30.2% for AGIs $25k-50k, 45.8% for AGIs $50k-75k, 87.2% for AGIs $75k-100k, 195.5% for AGIs $100k-200k, 2383.2% for AGIs over 200k)
Taxes paid: $9,478 (reported on 24.3% of returns)
19425:
$9,478
State:
$8,200
(% of AGI for various income ranges: 30.5% for AGIs below $25k, 95.7% for AGIs $25k-50k, 173.1% for AGIs $50k-75k, 292.5% for AGIs $75k-100k, 494.9% for AGIs $100k-200k, 1599.2% for AGIs over 200k)
Earned income credit: $1,326 (reported on 3.0% of returns)
Here:
$1,326
State:
$2,100
(% of AGI for various income ranges: 20.6% for AGIs below $25k, 30.2% for AGIs $25k-50k)
Percentage of individuals using paid preparers for their 2020 taxes: 92.0%
Here:
92%
State:
92%
(% for various income ranges: 89.7% for AGIs below $25k, 90.1% for AGIs $25k-50k, 89.9% for AGIs $50k-75k, 93.0% for AGIs $75k-100k, 92.9% for AGIs $100k-200k, 93.9% for AGIs over 200k)
Averages for the 2012 tax year for zip code 19425, filed in 2013:
Average Adjusted Gross Income (AGI) in 2012: $181,928 (Individual Income Tax Returns)
Here:
$181,928
State:
$61,346
Salary/wage: $139,012 (reported on 86.6% of returns)
Here:
$139,012
State:
$51,902
(% of AGI for various income ranges: 71.4% for AGIs below $25k, 73.1% for AGIs $25k-50k, 73.6% for AGIs $50k-75k, 76.7% for AGIs $75k-100k, 83.8% for AGIs $100k-200k, 59.5% for AGIs over 200k)
Taxable interest for individuals: $1,970 (reported on 59.2% of returns)
This zip code:
$1,970
Pennsylvania:
$1,588
(% of AGI for various income ranges: 2.0% for AGIs below $25k, 1.3% for AGIs $25k-50k, 1.1% for AGIs $50k-75k, 0.9% for AGIs $75k-100k, 0.5% for AGIs $100k-200k, 0.6% for AGIs over 200k)
Ordinary dividends: $12,255 (reported on 48.8% of returns)
Here:
$12,255
State:
$5,827
(% of AGI for various income ranges: 6.3% for AGIs below $25k, 3.6% for AGIs $25k-50k, 3.4% for AGIs $50k-75k, 2.2% for AGIs $75k-100k, 1.6% for AGIs $100k-200k, 3.8% for AGIs over 200k)
Net capital gain/loss in AGI: +$31,954 (reported on 41.9% of returns)
Here:
+$31,954
State:
+$14,495
(% of AGI for various income ranges: 0.1% for AGIs below $25k, 0.5% for AGIs $50k-75k, 1.1% for AGIs $75k-100k, 1.2% for AGIs $100k-200k, 10.3% for AGIs over 200k)
Profit/loss from business: +$35,175 (reported on 18.9% of returns)
Here:
+$35,175
State:
+$16,268
(% of AGI for various income ranges: 9.5% for AGIs below $25k, 7.3% for AGIs $25k-50k, 5.9% for AGIs $50k-75k, 4.4% for AGIs $75k-100k, 3.5% for AGIs $100k-200k, 3.4% for AGIs over 200k)
Taxable individual retirement arrangement distribution: $27,438 (reported on 12.0% of returns)
19425:
$27,438
Pennsylvania:
$14,550
(% of AGI for various income ranges: 4.8% for AGIs below $25k, 3.5% for AGIs $25k-50k, 3.5% for AGIs $50k-75k, 3.3% for AGIs $75k-100k, 2.6% for AGIs $100k-200k, 1.3% for AGIs over 200k)
Self-employment retirement plans: $22,865 (reported on 3.1% of returns)
19425:
$22,865
Pennsylvania:
$20,922
(% of AGI for various income ranges: 0.8% for AGIs $50k-75k, 0.4% for AGIs $100k-200k, 0.4% for AGIs over 200k)
Total itemized deductions: $39,280 (15% of AGI, reported on 65.3% of returns)
Here:
$39,280
State:
$23,538
Here:
15.0% of AGI
State:
18.4% of AGI
(% of AGI for various income ranges: 21.0% for AGIs below $25k, 20.0% for AGIs $25k-50k, 20.6% for AGIs $50k-75k, 21.0% for AGIs $75k-100k, 19.2% for AGIs $100k-200k, 11.6% for AGIs over 200k)
Charity contributions: $6,122 (reported on 56.9% of returns)
Here:
$6,122
State:
$4,025
(% of AGI for various income ranges: 0.9% for AGIs below $25k, 1.3% for AGIs $25k-50k, 1.7% for AGIs $50k-75k, 1.8% for AGIs $75k-100k, 1.6% for AGIs $100k-200k, 2.0% for AGIs over 200k)
Taxes paid: $19,016 (reported on 65.3% of returns)
19425:
$19,016
State:
$9,982
(% of AGI for various income ranges: 5.9% for AGIs below $25k, 6.8% for AGIs $25k-50k, 8.0% for AGIs $50k-75k, 8.5% for AGIs $75k-100k, 9.0% for AGIs $100k-200k, 6.0% for AGIs over 200k)
Earned income credit: $1,520 (reported on 3.1% of returns)
Here:
$1,520
State:
$2,106
(% of AGI for various income ranges: 1.8% for AGIs below $25k, 0.3% for AGIs $25k-50k)
Percentage of individuals using paid preparers for their 2012 taxes: 55.2%
Here:
55%
State:
53%
(% for various income ranges: 47.3% for AGIs below $25k, 48.4% for AGIs $25k-50k, 54.5% for AGIs $50k-75k, 51.9% for AGIs $75k-100k, 55.4% for AGIs $100k-200k, 67.1% for AGIs over 200k)
Averages for the 2004 tax year for zip code 19425, filed in 2005:
Average Adjusted Gross Income (AGI) in 2004: $139,394 (Individual Income Tax Returns)
Here:
$139,394
State:
$48,049
Salary/wage: $115,338 (reported on 83.5% of returns)
Here:
$115,338
State:
$42,646
(% of AGI for various income ranges: 270.1% for AGIs below $10k, 66.6% for AGIs $10k-25k, 74.6% for AGIs $25k-50k, 73.1% for AGIs $50k-75k, 81.1% for AGIs $75k-100k, 67.5% for AGIs over 100k)
Taxable interest for individuals: $3,082 (reported on 71.1% of returns)
This zip code:
$3,082
Pennsylvania:
$1,657
(% of AGI for various income ranges: 32.1% for AGIs below $10k, 3.9% for AGIs $10k-25k, 2.5% for AGIs $25k-50k, 1.7% for AGIs $50k-75k, 1.3% for AGIs $75k-100k, 1.5% for AGIs over 100k)
Taxable dividends: $8,982 (reported on 57.8% of returns)
Here:
$8,982
State:
$3,566
(% of AGI for various income ranges: 52.5% for AGIs below $10k, 5.9% for AGIs $10k-25k, 3.7% for AGIs $25k-50k, 4.0% for AGIs $50k-75k, 2.5% for AGIs $75k-100k, 3.7% for AGIs over 100k)
Net capital gain/loss: +$29,860 (reported on 50.1% of returns)
Here:
+$29,860
State:
+$9,716
(% of AGI for various income ranges: 51.2% for AGIs below $10k, 2.5% for AGIs $10k-25k, 1.1% for AGIs $25k-50k, 1.0% for AGIs $50k-75k, 1.3% for AGIs $75k-100k, 12.3% for AGIs over 100k)
Profit/loss from business: +$31,986 (reported on 18.9% of returns)
Here:
+$31,986
State:
+$14,267
(% of AGI for various income ranges: 24.8% for AGIs below $10k, 12.9% for AGIs $10k-25k, 7.1% for AGIs $25k-50k, 6.2% for AGIs $50k-75k, 5.3% for AGIs $75k-100k, 3.9% for AGIs over 100k)
IRA payment deduction: $3,867 (reported on 3.8% of returns)
19425:
$3,867
Pennsylvania:
$2,903
(% of AGI for various income ranges: 1.7% for AGIs below $10k, 0.8% for AGIs $10k-25k, 0.4% for AGIs $25k-50k, 0.3% for AGIs $50k-75k, 0.2% for AGIs $75k-100k, 0.1% for AGIs over 100k)
Self-employed pension: $16,034 (reported on 3.3% of returns)
Here:
$16,034
Pennsylvania:
$14,674
Total itemized deductions: $33,213 (16% of AGI, reported on 63.8% of returns)
Here:
$33,213
State:
$18,804
Here:
16.1% of AGI
State:
19.5% of AGI
(% of AGI for various income ranges: 77.4% for AGIs below $10k, 20.1% for AGIs $10k-25k, 20.3% for AGIs $25k-50k, 25.4% for AGIs $50k-75k, 22.5% for AGIs $75k-100k, 13.8% for AGIs over 100k)
Charity contributions deductions: $6,118 (3% of AGI, reported on 58.9% of returns)
Here:
$6,118
State:
$3,337
Here:
2.9% of AGI
State:
3.3% of AGI
(% of AGI for various income ranges: 3.0% for AGIs below $10k, 1.7% for AGIs $10k-25k, 1.6% for AGIs $25k-50k, 2.5% for AGIs $50k-75k, 2.0% for AGIs $75k-100k, 2.7% for AGIs over 100k)
Total tax: $30,931 (reported on 84.5% of returns)
19425:
$30,931
State:
$8,008
(% of AGI for various income ranges: 12.7% for AGIs below $10k, 5.9% for AGIs $10k-25k, 8.7% for AGIs $25k-50k, 9.5% for AGIs $50k-75k, 10.2% for AGIs $75k-100k, 20.4% for AGIs over 100k)
Earned income credit: $1,149 (reported on 2.6% of returns)
Here:
$1,149
State:
$1,643
Percentage of individuals using paid preparers for their 2004 taxes: 56.4%
Here:
56%
State:
56%
(% for various income ranges: 51.8% for AGIs below $10k, 49.0% for AGIs $10k-25k, 52.2% for AGIs $25k-50k, 58.2% for AGIs $50k-75k, 52.6% for AGIs $75k-100k, 62.0% for AGIs over 100k)
Likely homosexual households (counted as self-reported same-sex unmarried-partner households)
Lesbian couples: 0.0% of all households
Gay men: 0.2% of all households
Household received Food Stamps/SNAP in the past 12 months: 121 Household did not receive Food Stamps/SNAP in the past 12 months: 5,653
Women who had a birth in the past 12 months: 195 (194 now married, 12 unmarried) Women who did not have a birth in the past 12 months: 3,800 (2,522 now married, 1,242 unmarried)
Housing units in zip code 19425 with a mortgage: 4,194 (782 second mortgage, 761 both second mortgage and home equity loan) Houses without a mortgage: 206
Median monthly owner costs for units with a mortgage: $3,190 Median monthly owner costs for units without a mortgage: $1,134
Residents with income below the poverty level in 2022:
This zip code:
1.7%
Whole state:
11.8%
Residents with income below 50% of the poverty level in 2022:
This zip code:
0.6%
Whole state:
6.1%
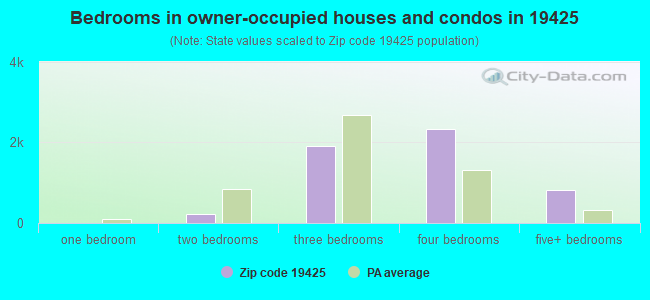
Median number of rooms in houses and condos:
Here:
10.0
State:
6.8
Median number of rooms in apartments:
Here:
7.1
State:
4.3
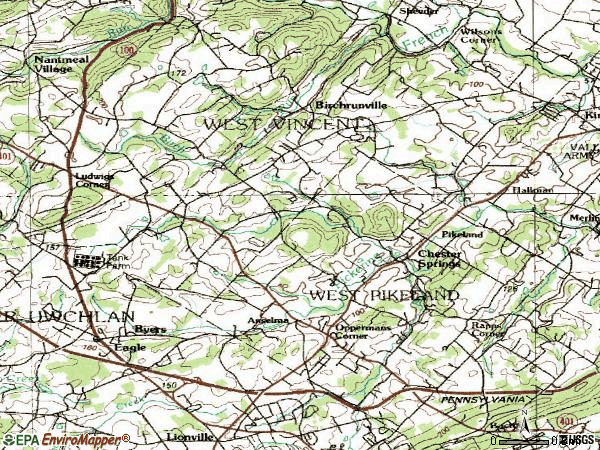
Notable locations in this zip code not listed on our city pages
Notable locations in zip code 19425: Historic Yellow Springs (A), Lionville Station (B), Chester Springs Library (C), Upper Uwchlan Township Building (D), West Pikeland Township Building (E). Display/hide their locations on the map
Churches in zip code 19425 include: Vincent Church (A), Saint Matthews United Church of Christ (B), Saint Matthews Lutheran Church (C), Saint Peter Church (D). Display/hide their locations on the map
Tourist attractions (not listed on the city page) : BareCat Catamarans in the British Virgin Islands (Tours & Charters; 352 Harshaw Drive) (1), American Heritage Student Tours Inc (Tours & Charters; 1736 Valley Lane) (2). Display/hide their approximate locations on the map
4,637 married couples with children.
336 single-parent households (48 men, 288 women).
79.6% of residents of 19425 zip code speak English at home.
1.3% of residents speak Spanish at home (54% very well, 16% well, 20% not well, 10% not at all).
7.2% of residents speak other Indo-European language at home (80% very well, 16% well, 4% not well).
10.4% of residents speak Asian or Pacific Island language at home (92% very well, 7% well, 1% not at all).
0.9% of residents speak other language at home (72% very well, 28% well).
Foreign born population: 3,313 (19.1%) (59.9% of them are naturalized citizens)
This zip code:
19.1%
Whole state:
7.5%
56%Bhutan
6%Thailand
5%Honduras
3%Malaysia
2%Sweden
2%India
1%Jordan
11%Irish
10%Italian
7%German
5%English
2%Polish
2%American
2%Eastern European
Year of entry for the foreign-born population
6672010 or later
1,2932000 to 2009
8141990 to 1999
662Before 1990
Facilities with environmental interests located in this zip code:
ATLANTIC 0363 0191 (RTES 113 & 401 in CHESTER SPRINGS, PA)
STATE MASTER (Pennsylvania database) - RCRIS-PAD987341641, HAZARDOUS WASTE PROGRAM Conditionally Exempt Small Quantity Generators, less than 100 kg/month of hazardous waste (Resource Conservation and Recovery Act (tracking hazardous waste)) - notification Organizations: OPERNAME (CONTACT/OPERATOR)
, ATLANTIC REFINING & MARKETING (CONTACT/OWNER)
, ATLANTIC REFINING & MARKETING CORPORATION (CONTACT/OWNER)
Alternative names: ATLANTIC SERVICE STATION
Housing units lacking complete plumbing facilities: 0.3%
47.5%Utility gas
25.5%Electricity
14.3%Bottled, tank, or LP gas
10.7%Fuel oil, kerosene, etc.
1.2%Other fuel
Population in 1990: 4,413. Population change in the 1990s: +3,107 (+70.4%).
Place of birth for U.S.-born residents:
This state: 8,994
Northeast: 1,806
Midwest: 819
South: 1,694
West: 608
56% of the 19425 zip code residents lived in the same house 5 years ago. Out of people who lived in different houses, 49% lived in this county. Out of people who lived in different counties, 50% lived in Pennsylvania.
92% of the 19425 zip code residents lived in the same house 1 year ago. Out of people who lived in different houses, 53% moved from this county. Out of people who lived in different houses, 11% moved from different county within same state. Out of people who lived in different houses, 35% moved from different state. Out of people who lived in different houses, 3% moved from abroad.
Private vs. public school enrollment:
Students in private schools in grades 1 to 8 (elementary and middle school): 395
Here:
14.8%
Pennsylvania:
15.7%
Students in private schools in grades 9 to 12 (high school): 159
Here:
14.6%
Pennsylvania:
13.4%
Students in private undergraduate colleges: 121
Here:
26.6%
Pennsylvania:
39.8%
Occupation by median earnings in the past 12 months ($)
218,583Legal occupations
162,759Management occupations
141,118Life, physical, and social science occupations
134,347Computer and mathematical occupations
126,152Architecture and engineering occupations
116,670Sales and related occupations
Companies with federal contracts located in this zip code (CHESTER SPRING, PA):
PENN TANK LINES, INC (300 LIONVILLE STATION ROAD) : $1,363,250 in 6 contractsfrom 2002 to 2003
Contracts for Motor Freight by Army Signed by year:2000: $0; 2001: $0; 2002: $340,813; 2003: $1,022,437; 2004: $0; 2005: $0; 2006: $0.
Biggest contracts:
$1,087,750 with Army for Motor Freight. Signed on 2003-04-08. Completion date: 2003-10-31.
$340,813, same as above.Signed on 2002-12-19. Completion date: 2004-12-22.
$275,500, same as above.Signed on 2003-04-08. Completion date: 2003-10-31.
$0, same as above.Signed on 2003-04-08. Completion date: 2007-10-31.
QUALITY SYSTEMS INTEGRATORS (148 MAGNOLIA DRIVE; small business) : $336,250 in 4 contractsfrom 2003 to 2005
$157,000 with Air Force for ADP Software, Equipment, and Telecommunications Training. Signed on 2004-09-22. Completion date: 2004-10-22.
$75,000 with Air Force for ADP Software. Signed on 2005-08-31. Completion date: 2006-03-31.
$59,500 with Air Force for ADP Software, Equipment, and Telecommunications Training. Signed on 2004-05-18. Completion date: 2004-09-30.
$44,750, same as above.Signed on 2003-09-29. Completion date: 2006-09-30.
JUPITER ASSOCIATES (308 WELSH CIR; small business) : $38,456 in 5 contractsfrom 2004 to 2006
Contracts for Books and Pamphlets by Army, Navy Signed by year:2000: $0; 2001: $0; 2002: $0; 2003: $0; 2004: $26,670; 2005: $9,274; 2006: $2,512.
Biggest contracts:
$26,670 with Army for Books and Pamphlets. Signed on 2004-08-03. Completion date: 2004-09-03.
$4,150 with Navy for Books and Pamphlets. Signed on 2005-06-27. Completion date: 2005-07-15.
$2,824, same as above.Signed on 2005-02-16. Completion date: 2005-03-01.
$2,512 with Army for Books and Pamphlets. Signed on 2006-03-08. Completion date: 2006-03-24.
DMW MARINE, LLC (1123 ST MATTHEWS ROAD; small business) : $15,658 in 4 contractsfrom 2002 to 2005
$12,304 with U.S. Army Corps of Engineers - civil program financing only for Winches, Hoists, Cranes, and Derricks. Signed on 2002-07-03. Completion date: 2002-07-09.
$3,600 with Air Force for Winches, Hoists, Cranes, and Derricks. Signed on 2005-09-16. Completion date: 2005-10-17.
-$123 with Army for Winches, Hoists, Cranes, and Derricks. Signed on 2005-04-01. Completion date: 2002-07-09.
-$123 with U.S. Army Corps of Engineers - civil program financing only for Winches, Hoists, Cranes, and Derricks. Signed on 2005-04-01. Completion date: 2002-07-09.
EXIJET INC (22 N IROQUOIS LN; small business)
$6,355 with Army for Filters and Networks. Signed on 2003-04-21. Completion date: 2003-05-17.
Top industries in this zip code by the number of employees in 2005:
Administrative and Support and Waste Management and Remediation Services: Janitorial Services (100-249 employees: 1 establishment)
2003 - 2018 National Fire Incident Reporting System (NFIRS) incidents
According to the data from the years 2003 - 2018 the average number of fire incidents per year is 26. The highest number of fires - 43 took place in 2009, and the least - 10 in 2014. The data has a growing trend.
When looking into fire subcategories, the most reports belonged to: Structure Fires (56.1%), and Outside Fires (29.1%).
Fire incident types reported to NFIRS in Zip Code 19425


 Nearest zip codes: 19341, 19442, 19475, 19465, 19343, 19335.


 According to the data from the years 2003 - 2018 the average number of fire incidents per year is 26. The highest number of fires - 43 took place in 2009, and the least - 10 in 2014. The data has a growing trend.
 When looking into fire subcategories, the most reports belonged to: Structure Fires (56.1%), and Outside Fires (29.1%).