Estimated zip code population in 2022: 3,076 Zip code population in 2010: 3,226 Zip code population in 2000: 2,600
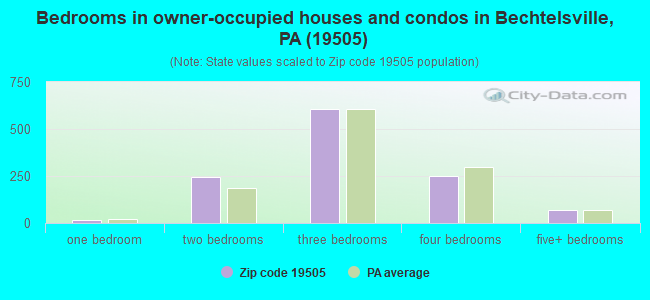
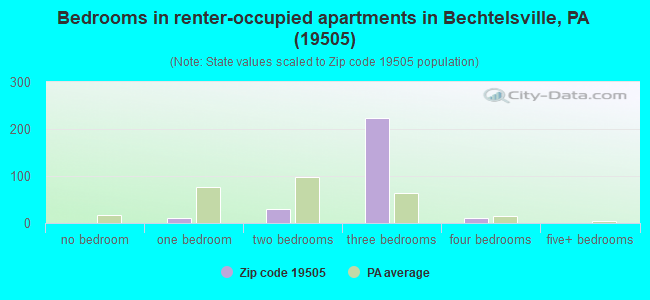
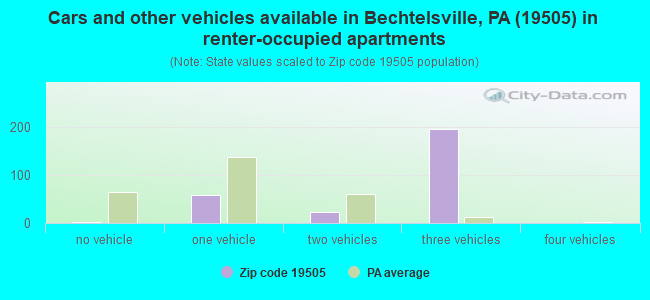
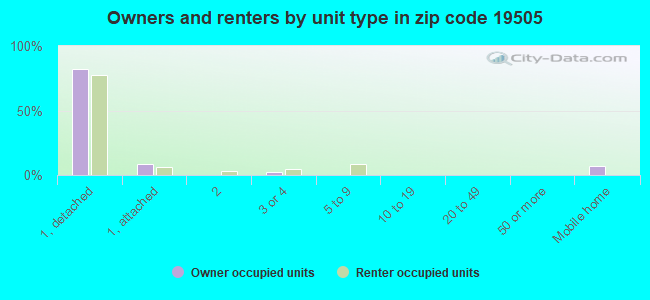
Houses and condos: 1,473 Renter-occupied apartments: 284
% of renters here:
19%
State:
31%
March 2022 cost of living index in zip code 19505: 95.7 (near average, U.S. average is 100)
Land area: 8.9 sq. mi. Water area: 0.0 sq. mi.
Population density: 347 people per square mile
(very low).
OSM Map
General Map
Google Map
MSN Map
OSM Map
General Map
Google Map
MSN Map
OSM Map
General Map
Google Map
MSN Map
OSM Map
General Map
Google Map
MSN Map
Please wait while loading the map...
Real estate property taxes paid for housing units in 2022:
This zip code:
1.4% ($4,043)
Pennsylvania:
1.3% ($3,094)
Median real estate property taxes paid for housing units with mortgages in 2022: $4,325 (1.6%) Median real estate property taxes paid for housing units with no mortgage in 2022: $3,470 (1.2%)
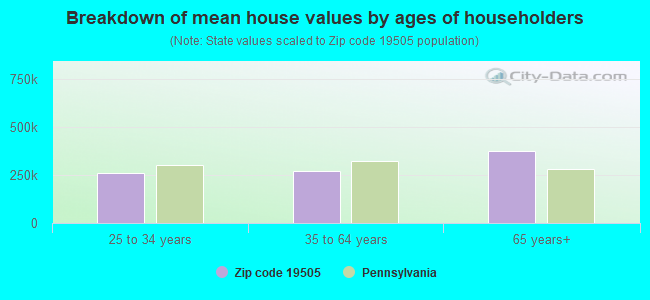
Estimated median house/condo value in 2022: $287,719
19505:
$287,719
Pennsylvania:
$245,500
According to our research of Pennsylvania and other state lists, there were 6 registered sex offenders living in 19505 zip code as of May 20, 2024. The ratio of all residents to sex offenders in zip code 19505 is 538 to 1. The ratio of registered sex offenders to all residents in this zip code is near the state average.
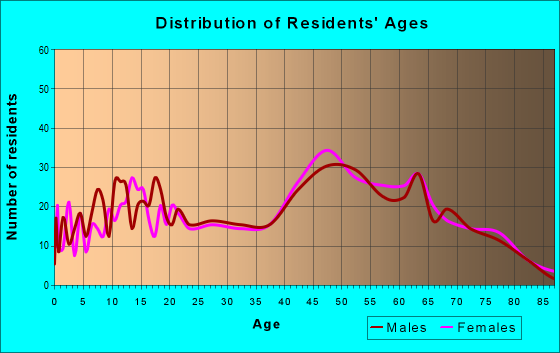
Median resident age:
This zip code:
58.5 years
Pennsylvania median age:
40.9 years
Average household size:
This zip code:
2.1 people
Pennsylvania:
2.4 people
Averages for the 2020 tax year for zip code 19505, filed in 2021:
Average Adjusted Gross Income (AGI) in 2020: $68,481 (Individual Income Tax Returns)
Here:
$68,481
State:
$75,707
Salary/wage: $61,266 (reported on 75.1% of returns)
Here:
$61,266
State:
$62,806
(% of AGI for various income ranges: 920.6% for AGIs below $25k, 3363.1% for AGIs $25k-50k, 6141.3% for AGIs $50k-75k, 9030.6% for AGIs $75k-100k, 14985.0% for AGIs $100k-200k)
Taxable interest for individuals: $804 (reported on 38.3% of returns)
This zip code:
$804
Pennsylvania:
$1,633
(% of AGI for various income ranges: 35.3% for AGIs below $25k, 36.3% for AGIs $25k-50k, 26.5% for AGIs $50k-75k, 70.6% for AGIs $75k-100k, 46.8% for AGIs $100k-200k)
Ordinary dividends: $2,888 (reported on 24.9% of returns)
Here:
$2,888
State:
$7,382
(% of AGI for various income ranges: 53.4% for AGIs below $25k, 57.7% for AGIs $25k-50k, 57.0% for AGIs $50k-75k, 165.6% for AGIs $75k-100k, 153.2% for AGIs $100k-200k)
Net capital gain/loss in AGI: +$9,180 (reported on 20.7% of returns)
Here:
+$9,180
State:
+$23,522
(% of AGI for various income ranges: 12.2% for AGIs below $25k, 31.1% for AGIs $25k-50k, 67.0% for AGIs $50k-75k, 156.2% for AGIs $75k-100k, 613.6% for AGIs $100k-200k)
Profit/loss from business: +$12,577 (reported on 11.4% of returns)
Here:
+$12,577
State:
+$16,274
(% of AGI for various income ranges: 78.4% for AGIs below $25k, 132.0% for AGIs $25k-50k, 216.1% for AGIs $50k-75k, 298.1% for AGIs $75k-100k, 490.9% for AGIs $100k-200k)
Taxable individual retirement arrangement distribution: $13,028 (reported on 18.7% of returns)
19505:
$13,028
Pennsylvania:
$18,583
(% of AGI for various income ranges: 230.9% for AGIs below $25k, 215.7% for AGIs $25k-50k, 302.6% for AGIs $50k-75k, 415.6% for AGIs $75k-100k, 834.1% for AGIs $100k-200k)
Total itemized deductions: $25,177 (reported on 6.7% of returns)
Here:
$25,177
State:
$34,850
(% of AGI for various income ranges: 220.9% for AGIs $25k-50k, 318.8% for AGIs $75k-100k, 904.5% for AGIs $100k-200k)
Charity contributions: $7,150 (reported on 4.1% of returns)
Here:
$7,150
State:
$12,392
(% of AGI for various income ranges: 60.9% for AGIs $50k-75k, 196.4% for AGIs $100k-200k)
Taxes paid: $7,815 (reported on 6.7% of returns)
19505:
$7,815
State:
$8,200
(% of AGI for various income ranges: 60.6% for AGIs $25k-50k, 130.0% for AGIs $75k-100k, 270.9% for AGIs $100k-200k)
Earned income credit: $1,664 (reported on 7.3% of returns)
Here:
$1,664
State:
$2,100
(% of AGI for various income ranges: 36.9% for AGIs below $25k, 32.9% for AGIs $25k-50k)
Percentage of individuals using paid preparers for their 2020 taxes: 92.7%
Here:
93%
State:
92%
(% for various income ranges: 90.6% for AGIs below $25k, 95.7% for AGIs $25k-50k, 93.5% for AGIs $50k-75k, 95.8% for AGIs $75k-100k, 90.9% for AGIs $100k-200k, 83.3% for AGIs over 200k)
Averages for the 2012 tax year for zip code 19505, filed in 2013:
Average Adjusted Gross Income (AGI) in 2012: $51,651 (Individual Income Tax Returns)
Here:
$51,651
State:
$61,346
Salary/wage: $47,685 (reported on 81.7% of returns)
Here:
$47,685
State:
$51,902
(% of AGI for various income ranges: 65.7% for AGIs below $25k, 77.2% for AGIs $25k-50k, 78.1% for AGIs $50k-75k, 78.0% for AGIs $75k-100k, 80.1% for AGIs $100k-200k, 57.2% for AGIs over 200k)
Taxable interest for individuals: $1,119 (reported on 39.4% of returns)
This zip code:
$1,119
Pennsylvania:
$1,588
(% of AGI for various income ranges: 2.6% for AGIs below $25k, 0.6% for AGIs $25k-50k, 1.1% for AGIs $50k-75k, 0.7% for AGIs $75k-100k, 0.3% for AGIs $100k-200k, 1.2% for AGIs over 200k)
Ordinary dividends: $2,776 (reported on 23.4% of returns)
Here:
$2,776
State:
$5,827
(% of AGI for various income ranges: 2.6% for AGIs below $25k, 0.9% for AGIs $25k-50k, 1.1% for AGIs $50k-75k, 0.7% for AGIs $75k-100k, 2.1% for AGIs $100k-200k)
Net capital gain/loss in AGI: +$2,745 (reported on 16.6% of returns)
Here:
+$2,745
State:
+$14,495
(% of AGI for various income ranges: 0.3% for AGIs $50k-75k, 3.2% for AGIs $100k-200k)
Profit/loss from business: +$10,429 (reported on 12.0% of returns)
Here:
+$10,429
State:
+$16,268
(% of AGI for various income ranges: 4.3% for AGIs below $25k, 3.6% for AGIs $25k-50k, 3.0% for AGIs $50k-75k, 3.6% for AGIs $75k-100k, 0.8% for AGIs $100k-200k)
Taxable individual retirement arrangement distribution: $10,766 (reported on 16.6% of returns)
19505:
$10,766
Pennsylvania:
$14,550
(% of AGI for various income ranges: 6.3% for AGIs below $25k, 3.2% for AGIs $25k-50k, 3.9% for AGIs $50k-75k, 3.2% for AGIs $75k-100k, 3.8% for AGIs $100k-200k)
Total itemized deductions: $19,592 (22% of AGI, reported on 34.3% of returns)
Here:
$19,592
State:
$23,538
Here:
21.8% of AGI
State:
18.4% of AGI
(% of AGI for various income ranges: 10.9% for AGIs below $25k, 9.0% for AGIs $25k-50k, 13.8% for AGIs $50k-75k, 13.6% for AGIs $75k-100k, 14.8% for AGIs $100k-200k, 14.1% for AGIs over 200k)
Charity contributions: $2,506 (reported on 26.9% of returns)
Here:
$2,506
State:
$4,025
(% of AGI for various income ranges: 0.8% for AGIs below $25k, 0.7% for AGIs $25k-50k, 1.3% for AGIs $50k-75k, 1.6% for AGIs $75k-100k, 1.7% for AGIs $100k-200k, 1.3% for AGIs over 200k)
Taxes paid: $8,060 (reported on 34.3% of returns)
19505:
$8,060
State:
$9,982
(% of AGI for various income ranges: 2.9% for AGIs below $25k, 3.5% for AGIs $25k-50k, 5.5% for AGIs $50k-75k, 5.4% for AGIs $75k-100k, 6.7% for AGIs $100k-200k, 6.4% for AGIs over 200k)
Earned income credit: $2,047 (reported on 9.7% of returns)
Here:
$2,047
State:
$2,106
(% of AGI for various income ranges: 3.5% for AGIs below $25k, 0.6% for AGIs $25k-50k)
Percentage of individuals using paid preparers for their 2012 taxes: 52.0%
Here:
52%
State:
53%
(% for various income ranges: 46.8% for AGIs below $25k, 50.0% for AGIs $25k-50k, 56.7% for AGIs $50k-75k, 57.9% for AGIs $75k-100k, 57.9% for AGIs $100k-200k, 66.7% for AGIs over 200k)
Averages for the 2004 tax year for zip code 19505, filed in 2005:
Average Adjusted Gross Income (AGI) in 2004: $44,506 (Individual Income Tax Returns)
Here:
$44,506
State:
$48,049
Salary/wage: $41,370 (reported on 87.4% of returns)
Here:
$41,370
State:
$42,646
(% of AGI for various income ranges: 159.5% for AGIs below $10k, 70.9% for AGIs $10k-25k, 83.8% for AGIs $25k-50k, 88.1% for AGIs $50k-75k, 88.9% for AGIs $75k-100k, 67.0% for AGIs over 100k)
Taxable interest for individuals: $1,050 (reported on 49.8% of returns)
This zip code:
$1,050
Pennsylvania:
$1,657
(% of AGI for various income ranges: 7.0% for AGIs below $10k, 3.1% for AGIs $10k-25k, 1.3% for AGIs $25k-50k, 1.1% for AGIs $50k-75k, 0.5% for AGIs $75k-100k, 0.8% for AGIs over 100k)
Taxable dividends: $1,717 (reported on 27.0% of returns)
Here:
$1,717
State:
$3,566
(% of AGI for various income ranges: 9.0% for AGIs below $10k, 2.3% for AGIs $10k-25k, 1.0% for AGIs $25k-50k, 0.8% for AGIs $50k-75k, 0.4% for AGIs $75k-100k, 1.1% for AGIs over 100k)
Net capital gain/loss: +$4,797 (reported on 16.0% of returns)
Here:
+$4,797
State:
+$9,716
(% of AGI for various income ranges: -6.3% for AGIs below $10k, 0.8% for AGIs $10k-25k, -0.1% for AGIs $25k-50k, 0.3% for AGIs $50k-75k, 0.5% for AGIs $75k-100k, 6.2% for AGIs over 100k)
Profit/loss from business: +$11,265 (reported on 14.1% of returns)
Here:
+$11,265
State:
+$14,267
(% of AGI for various income ranges: 18.6% for AGIs below $10k, 8.7% for AGIs $10k-25k, 4.6% for AGIs $25k-50k, 2.9% for AGIs $50k-75k, 3.3% for AGIs $75k-100k, 1.3% for AGIs over 100k)
IRA payment deduction: $2,451 (reported on 3.1% of returns)
19505:
$2,451
Pennsylvania:
$2,903
Total itemized deductions: $15,321 (20% of AGI, reported on 35.4% of returns)
Here:
$15,321
State:
$18,804
Here:
20.2% of AGI
State:
19.5% of AGI
(% of AGI for various income ranges: 10.6% for AGIs $10k-25k, 11.1% for AGIs $25k-50k, 13.3% for AGIs $50k-75k, 14.3% for AGIs $75k-100k, 11.5% for AGIs over 100k)
Charity contributions deductions: $2,218 (3% of AGI, reported on 29.8% of returns)
Here:
$2,218
State:
$3,337
Here:
2.8% of AGI
State:
3.3% of AGI
(% of AGI for various income ranges: 0.8% for AGIs $10k-25k, 1.0% for AGIs $25k-50k, 1.3% for AGIs $50k-75k, 1.5% for AGIs $75k-100k, 2.4% for AGIs over 100k)
Total tax: $6,004 (reported on 80.4% of returns)
19505:
$6,004
State:
$8,008
(% of AGI for various income ranges: 5.5% for AGIs below $10k, 5.1% for AGIs $10k-25k, 7.6% for AGIs $25k-50k, 8.7% for AGIs $50k-75k, 10.3% for AGIs $75k-100k, 18.0% for AGIs over 100k)
Earned income credit: $1,385 (reported on 8.0% of returns)
Here:
$1,385
State:
$1,643
Percentage of individuals using paid preparers for their 2004 taxes: 56.3%
Here:
56%
State:
56%
(% for various income ranges: 45.3% for AGIs below $10k, 57.5% for AGIs $10k-25k, 54.6% for AGIs $25k-50k, 66.2% for AGIs $50k-75k, 58.2% for AGIs $75k-100k, 64.0% for AGIs over 100k)
Household received Food Stamps/SNAP in the past 12 months: 96 Household did not receive Food Stamps/SNAP in the past 12 months: 1,372
Women who had a birth in the past 12 months: 10 (2 now married, 6 unmarried) Women who did not have a birth in the past 12 months: 316 (153 now married, 161 unmarried)
Housing units in zip code 19505 with a mortgage: 594 (94 second mortgage, 81 both second mortgage and home equity loan) Houses without a mortgage: 34
Median monthly owner costs for units with a mortgage: $1,685 Median monthly owner costs for units without a mortgage: $651
Residents with income below the poverty level in 2022:
This zip code:
5.4%
Whole state:
11.8%
Residents with income below 50% of the poverty level in 2022:
This zip code:
3.2%
Whole state:
6.1%
Median number of rooms in houses and condos:
Here:
6.3
State:
6.8
Median number of rooms in apartments:
Here:
6.0
State:
4.3
Notable locations in this zip code not listed on our city pages
Notable locations in zip code 19505: Community Rod and Gun Club (A), Lazy K Campground (B), Grandview Speedway (C), Bechtelsville Borough Hall (D), Keystone Fire Company Bechtelsville (E). Display/hide their locations on the map
Churches in zip code 19505 include: Trinity Evangelical Lutheran Church (A), Morning Star Fellowship (B), Saint Andrews United Methodist Church (C). Display/hide their locations on the map
Size of family households: 755 2-persons, 126 3-persons, 166 4-persons, 22 5-persons, 4 6-persons
Size of nonfamily households: 360 1-person, 42 2-persons
275 married couples with children.
78 single-parent households (31 men, 47 women).
97.3% of residents of 19505 zip code speak English at home.
0.1% of residents speak Spanish at home (100% very well).
3.0% of residents speak other Indo-European language at home (100% very well).
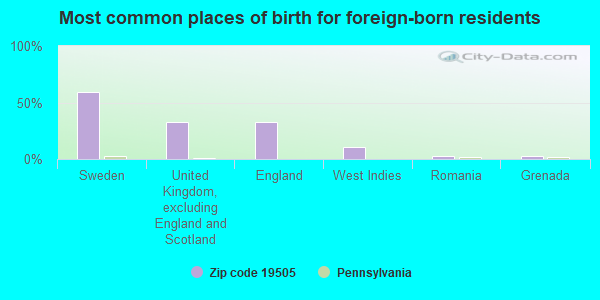
Foreign born population: 37 (1.2%) (70.3% of them are naturalized citizens)
This zip code:
1.2%
Whole state:
7.5%
59%Sweden
32%United Kingdom, excluding England and Scotland
32%England
11%West Indies
3%Romania
3%Grenada
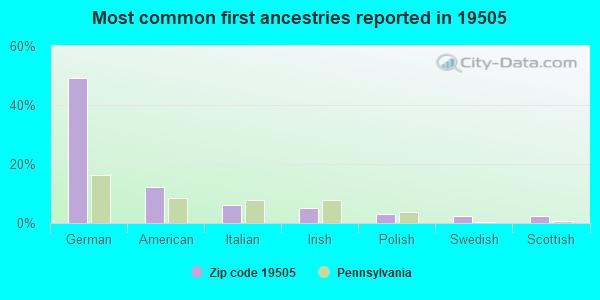
49%German
12%American
6%Italian
5%Irish
3%Polish
2%Swedish
2%Scottish
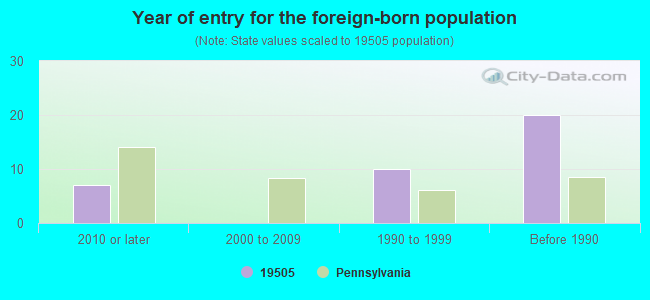
Year of entry for the foreign-born population
72010 or later
02000 to 2009
101990 to 1999
20Before 1990
Facilities with environmental interests located in this zip code:
BECHTELSVILLE ASPHALT (OLD RTE 100 in BECHTELSVILLE, PA)
AIR SYNTHETIC MINOR (AIRS/AFS) STATE MASTER (Pennsylvania database) - RCRIS-PAD982662694, HAZARDOUS WASTE PROGRAM Small Quantity Generators, between 100 kg and 1000 kg of hazardous waste/month (Resource Conservation and Recovery Act (tracking hazardous waste)) - notification Business SIC classification: CRUSHED AND BROKEN LIMESTONE Organizations: OPERNAME (CONTACT/OPERATOR)
, HAINE S & KIBBLEHOUSE INC (CONTACT/OWNER)
Alternative names: HAINES & KIBBLEHOUSE, HAINES & KIBBLEHOUSE/BECHTELSVILLE ASPHA
ALCAM INCORPORATED (RD 1, BOX 392-E in BECHTELSVILLE, PA)
COMPLIANCE ACTIVITY (Tracking inspections of insecticide, fungicide, and rodenticide, and toxic substances) Alternative names: ALCAM, INC.(SPRINGFIELD TWP. SR. H.S.)
BECHTELSVILLE AUTO BODY (RT 100 in BECHTELSVILLE, PA)
Small Quantity Generators, between 100 kg and 1000 kg of hazardous waste/month (Resource Conservation and Recovery Act (tracking hazardous waste)) - notification Organizations: SWINERART RAY (CONTACT/OWNER)
Housing units lacking complete plumbing facilities: 1.2% Housing units lacking complete kitchen facilities: 0.1%
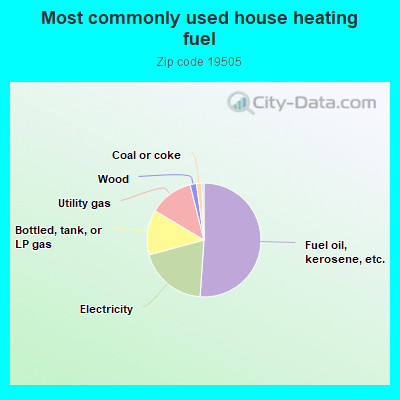
51.1%Fuel oil, kerosene, etc.
19.7%Electricity
12.8%Bottled, tank, or LP gas
12.5%Utility gas
1.8%Wood
1.5%Coal or coke
0.6%No fuel used
Population in 1990: 3,640.
Place of birth for U.S.-born residents:
This state: 2,603
Northeast: 224
Midwest: 35
South: 135
West: 19
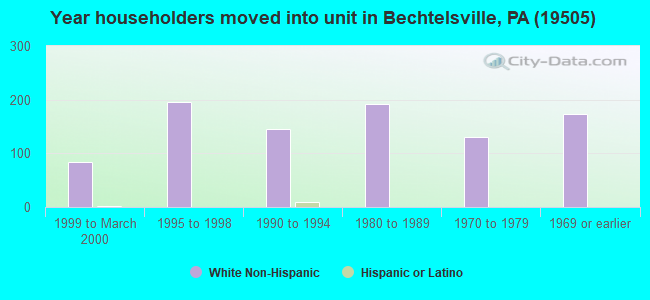
71% of the 19505 zip code residents lived in the same house 5 years ago. Out of people who lived in different houses, 51% lived in this county. Out of people who lived in different counties, 50% lived in Pennsylvania.
95% of the 19505 zip code residents lived in the same house 1 year ago. Out of people who lived in different houses, 33% moved from this county. Out of people who lived in different houses, 47% moved from different county within same state. Out of people who lived in different houses, 23% moved from different state.
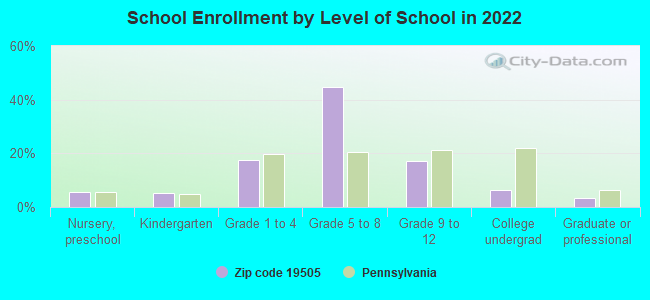
Private vs. public school enrollment:
Students in private schools in grades 1 to 8 (elementary and middle school): 63
Here:
29.9%
Pennsylvania:
15.7%
Students in private schools in grades 9 to 12 (high school): 23
Here:
40.4%
Pennsylvania:
13.4%
Students in private undergraduate colleges: 2
Here:
13.2%
Pennsylvania:
39.8%
Occupation by median earnings in the past 12 months ($)
103,448Health diagnosing and treating practitioners and other technical occupations
89,298Building and grounds cleaning and maintenance occupations
73,025Management occupations
71,603Material moving occupations
68,480Business and financial operations occupations
67,664Construction and extraction occupations
Companies with federal contracts located in this zip code:
SEVENTY-THREE MANUFACTURING CO (136 STAUFFER ROAD in BECHTELSVILLE, PA; small business)
$78,724 with U.S. Army Corps of Engineers - civil program financing only for Power and Hand Pumps. Signed on 2001-02-14. Completion date: 2001-06-18.
Top industries in this zip code by the number of employees in 2005:
Health Care and Social Assistance: Vocational Rehabilitation Services (50-99 employees: 1 establishment)
Mining: Crushed and Broken Granite Mining and Quarrying (50-99: 1)
Accommodation and Food Services: Full-Service Restaurants (50-99: 1)
Other Services (except Public Administration): Religious Organizations (10-19: 2, 5-9: 1)
Real Estate and Rental and Leasing: Lessors of Nonfinancial Intangible Assets (except Copyrighted Works) (20-49: 1)
Professional, Scientific, and Technical Services: Offices of Lawyers (20-49: 1)
Fatal accident statistics in 2014:
Fatal accident count: 1
Vehicles involved in fatal accidents: 2
Fatal accidents caused by drunken drivers: 0
Fatalities: 1
Persons involved in fatal accidents: 4
Pedestrians involved in fatal accidents: 0
Fatal accident statistics in 2013:
Fatal accident count: 1
Vehicles involved in fatal accidents: 2
Fatal accidents caused by drunken drivers: 0
Fatalities: 1
Persons involved in fatal accidents: 2
Pedestrians involved in fatal accidents: 0
Home Mortgage Disclosure Act Aggregated Statistics For Year 2009 (Based on 2 partial tracts)
A) FHA, FSA/RHS & VA Home Purchase Loans
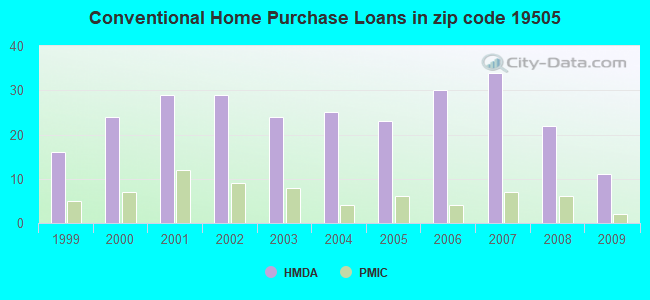
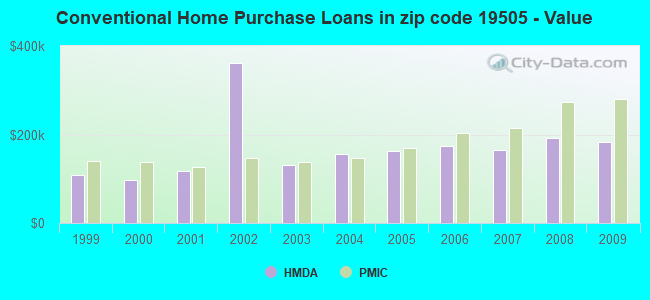
B) Conventional Home Purchase Loans
C) Refinancings
D) Home Improvement Loans
F) Non-occupant Loans on < 5 Family Dwellings (A B C & D)
G) Loans On Manufactured Home Dwelling (A B C & D)
Number
Average Value
Number
Average Value
Number
Average Value
Number
Average Value
Number
Average Value
Number
Average Value
LOANS ORIGINATED
10
$184,898
11
$183,135
55
$172,442
9
$71,031
1
$261,610
4
$55,850
APPLICATIONS APPROVED, NOT ACCEPTED
1
$104,810
1
$140,780
3
$152,490
1
$20,510
0
$0
2
$106,080
APPLICATIONS DENIED
1
$176,750
6
$126,168
22
$177,298
1
$62,100
2
$125,890
5
$91,944
APPLICATIONS WITHDRAWN
2
$190,800
2
$169,020
12
$192,953
1
$8,430
1
$53,110
1
$60,980
FILES CLOSED FOR INCOMPLETENESS
0
$0
2
$77,135
3
$194,170
1
$84,020
1
$123,640
1
$85,420
Aggregated Statistics For Year 2008 (Based on 2 partial tracts)
A) FHA, FSA/RHS & VA Home Purchase Loans
B) Conventional Home Purchase Loans
C) Refinancings
D) Home Improvement Loans
F) Non-occupant Loans on < 5 Family Dwellings (A B C & D)
G) Loans On Manufactured Home Dwelling (A B C & D)
Number
Average Value
Number
Average Value
Number
Average Value
Number
Average Value
Number
Average Value
Number
Average Value
LOANS ORIGINATED
6
$206,770
22
$191,118
33
$161,439
7
$48,453
3
$107,343
5
$88,458
APPLICATIONS APPROVED, NOT ACCEPTED
0
$0
6
$114,977
5
$212,886
2
$33,020
1
$238,290
3
$73,717
APPLICATIONS DENIED
0
$0
4
$89,640
22
$173,888
3
$82,147
0
$0
3
$84,300
APPLICATIONS WITHDRAWN
1
$211,310
3
$199,790
10
$180,430
1
$18,830
1
$219,740
1
$55,920
FILES CLOSED FOR INCOMPLETENESS
0
$0
1
$80,930
3
$193,983
0
$0
0
$0
0
$0
Aggregated Statistics For Year 2007 (Based on 2 partial tracts)
A) FHA, FSA/RHS & VA Home Purchase Loans
B) Conventional Home Purchase Loans
C) Refinancings
D) Home Improvement Loans
F) Non-occupant Loans on < 5 Family Dwellings (A B C & D)
G) Loans On Manufactured Home Dwelling (A B C & D)
Number
Average Value
Number
Average Value
Number
Average Value
Number
Average Value
Number
Average Value
Number
Average Value
LOANS ORIGINATED
1
$271,730
34
$164,625
44
$160,432
20
$65,024
5
$198,668
7
$51,141
APPLICATIONS APPROVED, NOT ACCEPTED
0
$0
7
$150,014
8
$181,878
3
$103,690
0
$0
4
$81,842
APPLICATIONS DENIED
0
$0
7
$167,034
30
$209,542
8
$111,802
3
$178,717
5
$97,170
APPLICATIONS WITHDRAWN
0
$0
3
$243,813
12
$195,974
2
$131,225
0
$0
1
$76,150
FILES CLOSED FOR INCOMPLETENESS
0
$0
1
$272,010
4
$212,435
0
$0
0
$0
0
$0
Aggregated Statistics For Year 2006 (Based on 2 partial tracts)
A) FHA, FSA/RHS & VA Home Purchase Loans
B) Conventional Home Purchase Loans
C) Refinancings
D) Home Improvement Loans
F) Non-occupant Loans on < 5 Family Dwellings (A B C & D)
G) Loans On Manufactured Home Dwelling (A B C & D)
Number
Average Value
Number
Average Value
Number
Average Value
Number
Average Value
Number
Average Value
Number
Average Value
LOANS ORIGINATED
2
$152,020
30
$173,218
50
$137,077
18
$53,593
3
$201,197
4
$62,452
APPLICATIONS APPROVED, NOT ACCEPTED
0
$0
1
$177,030
8
$162,454
3
$38,030
0
$0
2
$43,975
APPLICATIONS DENIED
0
$0
5
$208,840
26
$177,581
5
$108,578
1
$146,680
1
$61,540
APPLICATIONS WITHDRAWN
0
$0
3
$181,900
23
$167,928
1
$53,670
1
$251,500
1
$80,650
FILES CLOSED FOR INCOMPLETENESS
0
$0
0
$0
4
$152,795
0
$0
0
$0
0
$0
Aggregated Statistics For Year 2005 (Based on 2 partial tracts)
A) FHA, FSA/RHS & VA Home Purchase Loans
B) Conventional Home Purchase Loans
C) Refinancings
D) Home Improvement Loans
F) Non-occupant Loans on < 5 Family Dwellings (A B C & D)
G) Loans On Manufactured Home Dwelling (A B C & D)
Number
Average Value
Number
Average Value
Number
Average Value
Number
Average Value
Number
Average Value
Number
Average Value
LOANS ORIGINATED
2
$138,110
23
$161,624
71
$128,160
15
$62,757
3
$118,863
4
$59,502
APPLICATIONS APPROVED, NOT ACCEPTED
0
$0
3
$106,873
11
$111,762
3
$37,840
0
$0
2
$38,075
APPLICATIONS DENIED
0
$0
7
$106,219
29
$165,742
6
$46,787
1
$35,410
5
$46,814
APPLICATIONS WITHDRAWN
0
$0
2
$100,035
21
$144,996
2
$104,110
0
$0
1
$35,690
FILES CLOSED FOR INCOMPLETENESS
0
$0
1
$118,580
10
$175,990
0
$0
0
$0
0
$0
Aggregated Statistics For Year 2004 (Based on 2 partial tracts)
A) FHA, FSA/RHS & VA Home Purchase Loans
B) Conventional Home Purchase Loans
C) Refinancings
D) Home Improvement Loans
F) Non-occupant Loans on < 5 Family Dwellings (A B C & D)
G) Loans On Manufactured Home Dwelling (A B C & D)
Number
Average Value
Number
Average Value
Number
Average Value
Number
Average Value
Number
Average Value
Number
Average Value
LOANS ORIGINATED
1
$105,380
25
$155,843
71
$131,785
12
$58,940
3
$116,617
1
$47,490
APPLICATIONS APPROVED, NOT ACCEPTED
0
$0
4
$157,430
14
$115,451
2
$33,440
1
$78,960
2
$58,730
APPLICATIONS DENIED
0
$0
5
$117,008
32
$155,261
7
$58,449
2
$110,715
3
$50,017
APPLICATIONS WITHDRAWN
0
$0
4
$169,865
28
$122,857
3
$31,940
0
$0
0
$0
FILES CLOSED FOR INCOMPLETENESS
0
$0
0
$0
4
$202,672
0
$0
0
$0
0
$0
Aggregated Statistics For Year 2003 (Based on 2 partial tracts)
A) FHA, FSA/RHS & VA Home Purchase Loans
B) Conventional Home Purchase Loans
C) Refinancings
D) Home Improvement Loans
F) Non-occupant Loans on < 5 Family Dwellings (A B C & D)
Number
Average Value
Number
Average Value
Number
Average Value
Number
Average Value
Number
Average Value
LOANS ORIGINATED
2
$166,070
24
$130,173
128
$121,682
17
$35,406
4
$95,892
APPLICATIONS APPROVED, NOT ACCEPTED
0
$0
6
$127,527
23
$99,865
3
$39,527
1
$170,290
APPLICATIONS DENIED
0
$0
7
$57,926
34
$133,392
6
$23,323
1
$89,080
APPLICATIONS WITHDRAWN
1
$80,090
3
$220,397
30
$139,442
1
$76,150
0
$0
FILES CLOSED FOR INCOMPLETENESS
0
$0
1
$136,850
4
$106,500
1
$17,420
0
$0
Aggregated Statistics For Year 2002 (Based on 2 partial tracts)
A) FHA, FSA/RHS & VA Home Purchase Loans
B) Conventional Home Purchase Loans
C) Refinancings
D) Home Improvement Loans
F) Non-occupant Loans on < 5 Family Dwellings (A B C & D)
Number
Average Value
Number
Average Value
Number
Average Value
Number
Average Value
Number
Average Value
LOANS ORIGINATED
2
$137,130
29
$361,289
74
$112,427
15
$36,586
3
$103,407
APPLICATIONS APPROVED, NOT ACCEPTED
1
$72,500
1
$136,290
10
$87,503
5
$49,456
0
$0
APPLICATIONS DENIED
0
$0
7
$80,326
23
$79,792
4
$13,208
1
$145,000
APPLICATIONS WITHDRAWN
0
$0
1
$146,960
17
$124,202
1
$43,840
0
$0
FILES CLOSED FOR INCOMPLETENESS
0
$0
1
$132,910
3
$73,810
0
$0
1
$59,010
Aggregated Statistics For Year 2001 (Based on 2 partial tracts)
A) FHA, FSA/RHS & VA Home Purchase Loans
B) Conventional Home Purchase Loans
C) Refinancings
D) Home Improvement Loans
F) Non-occupant Loans on < 5 Family Dwellings (A B C & D)
Number
Average Value
Number
Average Value
Number
Average Value
Number
Average Value
Number
Average Value
LOANS ORIGINATED
3
$134,973
29
$117,613
48
$100,452
13
$27,084
2
$70,810
APPLICATIONS APPROVED, NOT ACCEPTED
0
$0
6
$101,815
6
$87,718
3
$25,477
0
$0
APPLICATIONS DENIED
1
$89,080
11
$53,977
17
$91,854
7
$21,919
0
$0
APPLICATIONS WITHDRAWN
0
$0
1
$182,090
10
$148,874
3
$15,457
0
$0
FILES CLOSED FOR INCOMPLETENESS
0
$0
0
$0
2
$66,315
0
$0
0
$0
Aggregated Statistics For Year 2000 (Based on 2 partial tracts)
A) FHA, FSA/RHS & VA Home Purchase Loans
B) Conventional Home Purchase Loans
C) Refinancings
D) Home Improvement Loans
F) Non-occupant Loans on < 5 Family Dwellings (A B C & D)
Number
Average Value
Number
Average Value
Number
Average Value
Number
Average Value
Number
Average Value
LOANS ORIGINATED
5
$108,186
24
$97,858
18
$81,802
15
$22,892
3
$57,887
APPLICATIONS APPROVED, NOT ACCEPTED
0
$0
5
$72,554
4
$85,565
3
$16,860
1
$42,430
APPLICATIONS DENIED
0
$0
18
$33,829
13
$133,453
6
$26,320
1
$84,860
APPLICATIONS WITHDRAWN
1
$60,700
3
$97,787
8
$141,132
2
$36,810
0
$0
FILES CLOSED FOR INCOMPLETENESS
0
$0
0
$0
1
$208,220
0
$0
0
$0
Aggregated Statistics For Year 1999 (Based on 1 partial tract)
Detailed PMIC statistics for the following Tracts:0133.00
2003 - 2018 National Fire Incident Reporting System (NFIRS) incidents
According to the data from the years 2003 - 2018 the average number of fire incidents per year is 11. The highest number of fires - 30 took place in 2004, and the least - 0 in 2011. The data has a dropping trend.
When looking into fire subcategories, the most reports belonged to: Structure Fires (61.3%), and Outside Fires (21.4%).
Fire incident types reported to NFIRS in Zip Code 19505
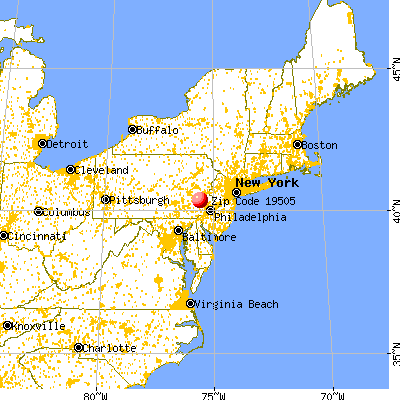


 Nearest zip codes: 19545, 19504, 19503, 19472, 19512, 19435.


 According to the data from the years 2003 - 2018 the average number of fire incidents per year is 11. The highest number of fires - 30 took place in 2004, and the least - 0 in 2011. The data has a dropping trend.
 When looking into fire subcategories, the most reports belonged to: Structure Fires (61.3%), and Outside Fires (21.4%).