Estimated zip code population in 2022: 3,666 Zip code population in 2010: 3,280 Zip code population in 2000: 3,431
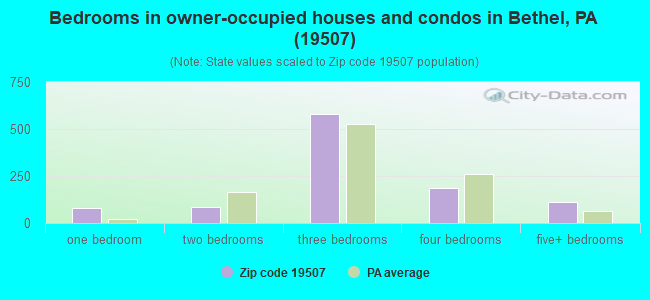
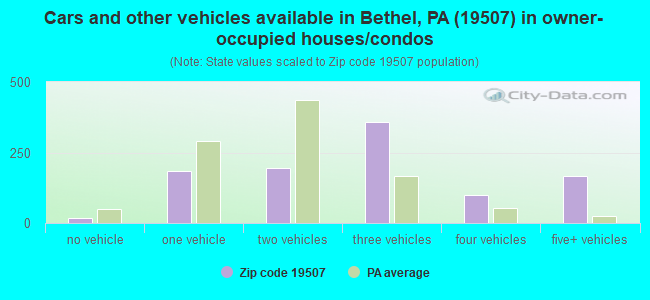
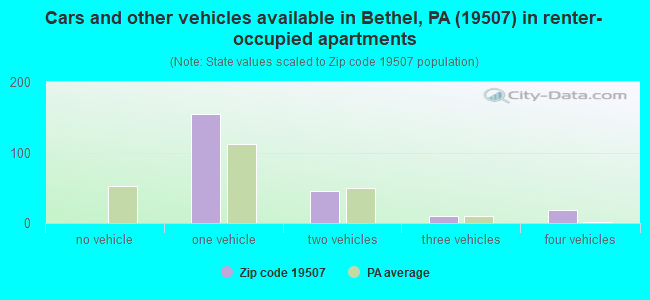
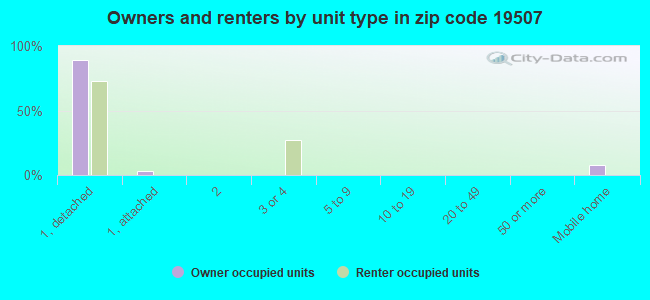
Houses and condos: 1,399 Renter-occupied apartments: 224
% of renters here:
18%
State:
31%
March 2022 cost of living index in zip code 19507: 92.6 (less than average, U.S. average is 100)
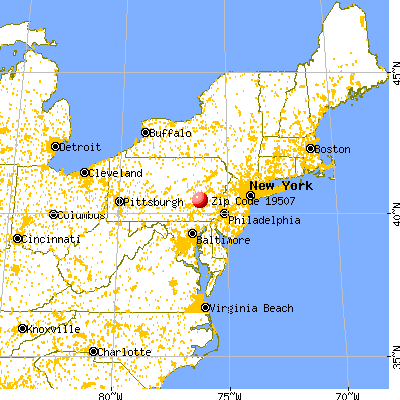
Land area: 37.7 sq. mi. Water area: 0.1 sq. mi.
Population density: 97 people per square mile
(very low).
OSM Map
General Map
Google Map
MSN Map
OSM Map
General Map
Google Map
MSN Map
OSM Map
General Map
Google Map
MSN Map
OSM Map
General Map
Google Map
MSN Map
Please wait while loading the map...
Real estate property taxes paid for housing units in 2022:
This zip code:
1.4% ($4,342)
Pennsylvania:
1.3% ($3,094)
Median real estate property taxes paid for housing units with mortgages in 2022: $4,919 (1.5%) Median real estate property taxes paid for housing units with no mortgage in 2022: $3,310 (1.2%)
Business Search- 14 Million verified businesses
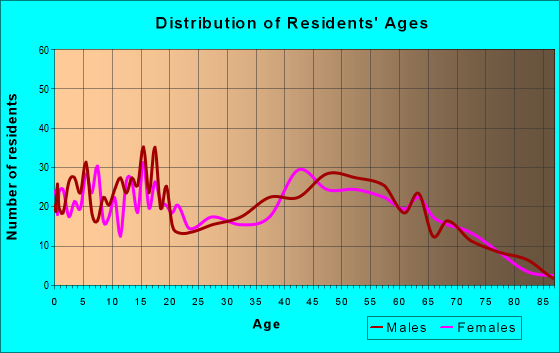
Males: 1,673
(45.6%)
Females: 1,993
(54.4%)
For population 25 years and over in 19507:
High school or higher: 83.4%
Bachelor's degree or higher: 16.3%
Graduate or professional degree: 4.5%
Unemployed: 1.6%
Mean travel time to work (commute): 27.2 minutes
For population 15 years and over in 19507:
Never married: 34.6%
Now married: 51.1%
Separated: 1.4%
Widowed: 5.6%
Divorced: 7.3%
Zip code 19507 compared to state average:
Unemployed percentage below state average.
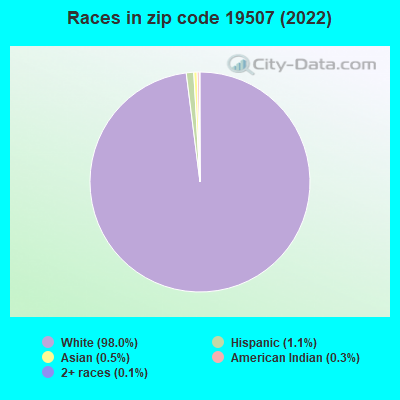
Black race population percentage significantly below state average.
Hispanic race population percentage significantly below state average.
Median age below state average.
Foreign-born population percentage significantly below state average.
Renting percentage below state average.
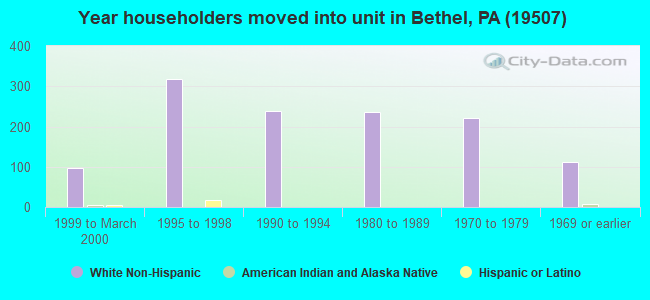
Length of stay since moving in significantly above state average.
Percentage of population with a bachelor's degree or higher significantly below state average.
Averages for the 2020 tax year for zip code 19507, filed in 2021:
Average Adjusted Gross Income (AGI) in 2020: $62,243 (Individual Income Tax Returns)
Here:
$62,243
State:
$75,707
Salary/wage: $50,483 (reported on 76.9% of returns)
Here:
$50,483
State:
$62,806
(% of AGI for various income ranges: 1484.6% for AGIs below $25k, 3843.3% for AGIs $25k-50k, 7751.2% for AGIs $50k-75k, 9370.7% for AGIs $75k-100k, 15950.8% for AGIs $100k-200k)
Taxable interest for individuals: $1,350 (reported on 30.8% of returns)
This zip code:
$1,350
Pennsylvania:
$1,633
(% of AGI for various income ranges: 42.3% for AGIs below $25k, 30.8% for AGIs $25k-50k, 54.4% for AGIs $50k-75k, 70.0% for AGIs $75k-100k, 101.5% for AGIs $100k-200k)
Ordinary dividends: $2,303 (reported on 17.8% of returns)
Here:
$2,303
State:
$7,382
(% of AGI for various income ranges: 39.6% for AGIs below $25k, 20.4% for AGIs $25k-50k, 76.2% for AGIs $50k-75k, 52.0% for AGIs $75k-100k, 260.8% for AGIs $100k-200k)
Net capital gain/loss in AGI: +$9,839 (reported on 16.6% of returns)
Here:
+$9,839
State:
+$23,522
(% of AGI for various income ranges: 6.9% for AGIs below $25k, 71.7% for AGIs $25k-50k, 146.9% for AGIs $50k-75k, 219.3% for AGIs $75k-100k, 676.9% for AGIs $100k-200k)
Profit/loss from business: +$19,837 (reported on 17.8% of returns)
Here:
+$19,837
State:
+$16,274
(% of AGI for various income ranges: 327.7% for AGIs below $25k, 339.6% for AGIs $25k-50k, 870.6% for AGIs $50k-75k, 694.0% for AGIs $75k-100k, 1423.1% for AGIs $100k-200k)
Taxable individual retirement arrangement distribution: $12,924 (reported on 10.1% of returns)
19507:
$12,924
Pennsylvania:
$18,583
(% of AGI for various income ranges: 106.2% for AGIs below $25k, 134.6% for AGIs $25k-50k, 183.1% for AGIs $50k-75k, 256.0% for AGIs $75k-100k, 708.5% for AGIs $100k-200k)
Total itemized deductions: $34,440 (reported on 5.9% of returns)
Here:
$34,440
State:
$34,850
(% of AGI for various income ranges: 888.1% for AGIs $50k-75k, 1556.2% for AGIs $100k-200k)
Charity contributions: $15,814 (reported on 4.1% of returns)
Here:
$15,814
State:
$12,392
(% of AGI for various income ranges: 108.3% for AGIs $25k-50k, 651.5% for AGIs $100k-200k)
Taxes paid: $7,200 (reported on 5.9% of returns)
19507:
$7,200
State:
$8,200
(% of AGI for various income ranges: 178.1% for AGIs $50k-75k, 334.6% for AGIs $100k-200k)
Earned income credit: $2,141 (reported on 10.1% of returns)
Here:
$2,141
State:
$2,100
(% of AGI for various income ranges: 71.5% for AGIs below $25k, 74.2% for AGIs $25k-50k)
Percentage of individuals using paid preparers for their 2020 taxes: 90.5%
Here:
91%
State:
92%
(% for various income ranges: 88.9% for AGIs below $25k, 91.7% for AGIs $25k-50k, 89.7% for AGIs $50k-75k, 91.3% for AGIs $75k-100k, 91.3% for AGIs $100k-200k, 100.0% for AGIs over 200k)
Averages for the 2012 tax year for zip code 19507, filed in 2013:
Average Adjusted Gross Income (AGI) in 2012: $48,666 (Individual Income Tax Returns)
Here:
$48,666
State:
$61,346
Salary/wage: $39,447 (reported on 81.0% of returns)
Here:
$39,447
State:
$51,902
(% of AGI for various income ranges: 70.3% for AGIs below $25k, 71.0% for AGIs $25k-50k, 74.6% for AGIs $50k-75k, 74.7% for AGIs $75k-100k, 51.2% for AGIs $100k-200k)
Taxable interest for individuals: $1,835 (reported on 33.1% of returns)
This zip code:
$1,835
Pennsylvania:
$1,588
(% of AGI for various income ranges: 2.5% for AGIs below $25k, 1.4% for AGIs $25k-50k, 0.9% for AGIs $50k-75k, 0.7% for AGIs $75k-100k, 1.4% for AGIs $100k-200k)
Ordinary dividends: $2,125 (reported on 19.6% of returns)
Here:
$2,125
State:
$5,827
(% of AGI for various income ranges: 1.0% for AGIs below $25k, 0.9% for AGIs $25k-50k, 0.5% for AGIs $50k-75k, 0.7% for AGIs $75k-100k, 1.1% for AGIs $100k-200k)
Net capital gain/loss in AGI: +$3,948 (reported on 15.3% of returns)
Here:
+$3,948
State:
+$14,495
(% of AGI for various income ranges: 0.7% for AGIs $25k-50k, 0.4% for AGIs $50k-75k, 1.2% for AGIs $75k-100k, 2.4% for AGIs $100k-200k)
Profit/loss from business: +$12,565 (reported on 16.0% of returns)
Here:
+$12,565
State:
+$16,268
(% of AGI for various income ranges: 8.5% for AGIs below $25k, 6.3% for AGIs $25k-50k, 3.6% for AGIs $50k-75k, 2.2% for AGIs $75k-100k, 3.0% for AGIs $100k-200k)
Taxable individual retirement arrangement distribution: $8,314 (reported on 8.6% of returns)
19507:
$8,314
Pennsylvania:
$14,550
(% of AGI for various income ranges: 3.3% for AGIs below $25k, 1.9% for AGIs $25k-50k, 2.0% for AGIs $50k-75k, 1.2% for AGIs $100k-200k)
Total itemized deductions: $19,722 (21% of AGI, reported on 28.2% of returns)
Here:
$19,722
State:
$23,538
Here:
21.2% of AGI
State:
18.4% of AGI
(% of AGI for various income ranges: 8.4% for AGIs below $25k, 11.0% for AGIs $25k-50k, 11.1% for AGIs $50k-75k, 13.7% for AGIs $75k-100k, 11.6% for AGIs $100k-200k)
Charity contributions: $4,581 (reported on 22.7% of returns)
Here:
$4,581
State:
$4,025
(% of AGI for various income ranges: 1.3% for AGIs below $25k, 1.8% for AGIs $25k-50k, 1.3% for AGIs $50k-75k, 2.1% for AGIs $75k-100k, 3.1% for AGIs $100k-200k)
Taxes paid: $7,850 (reported on 28.2% of returns)
19507:
$7,850
State:
$9,982
(% of AGI for various income ranges: 2.0% for AGIs below $25k, 3.3% for AGIs $25k-50k, 4.1% for AGIs $50k-75k, 5.5% for AGIs $75k-100k, 5.7% for AGIs $100k-200k)
Earned income credit: $1,876 (reported on 12.9% of returns)
Here:
$1,876
State:
$2,106
(% of AGI for various income ranges: 3.7% for AGIs below $25k, 0.8% for AGIs $25k-50k)
Percentage of individuals using paid preparers for their 2012 taxes: 69.3%
Here:
69%
State:
53%
(% for various income ranges: 63.9% for AGIs below $25k, 68.2% for AGIs $25k-50k, 73.1% for AGIs $50k-75k, 75.0% for AGIs $75k-100k, 81.2% for AGIs $100k-200k)
Averages for the 2004 tax year for zip code 19507, filed in 2005:
Average Adjusted Gross Income (AGI) in 2004: $43,338 (Individual Income Tax Returns)
Here:
$43,338
State:
$48,049
Salary/wage: $36,953 (reported on 82.8% of returns)
Here:
$36,953
State:
$42,646
(% of AGI for various income ranges: 106.6% for AGIs below $10k, 70.9% for AGIs $10k-25k, 78.6% for AGIs $25k-50k, 77.6% for AGIs $50k-75k, 73.8% for AGIs $75k-100k, 53.0% for AGIs over 100k)
Taxable interest for individuals: $1,622 (reported on 49.0% of returns)
This zip code:
$1,622
Pennsylvania:
$1,657
(% of AGI for various income ranges: 8.6% for AGIs below $10k, 3.3% for AGIs $10k-25k, 1.1% for AGIs $25k-50k, 0.9% for AGIs $50k-75k, 1.4% for AGIs $75k-100k, 2.7% for AGIs over 100k)
Taxable dividends: $1,366 (reported on 23.7% of returns)
Here:
$1,366
State:
$3,566
(% of AGI for various income ranges: 2.4% for AGIs below $10k, 1.5% for AGIs $10k-25k, 0.6% for AGIs $25k-50k, 0.3% for AGIs $50k-75k, 1.1% for AGIs $75k-100k, 0.8% for AGIs over 100k)
Net capital gain/loss: +$11,614 (reported on 17.5% of returns)
Here:
+$11,614
State:
+$9,716
(% of AGI for various income ranges: -1.9% for AGIs below $10k, 0.5% for AGIs $10k-25k, 0.7% for AGIs $25k-50k, 1.9% for AGIs $50k-75k, 2.1% for AGIs $75k-100k, 14.0% for AGIs over 100k)
Profit/loss from business: +$11,625 (reported on 18.3% of returns)
Here:
+$11,625
State:
+$14,267
(% of AGI for various income ranges: 10.1% for AGIs below $10k, 8.4% for AGIs $10k-25k, 6.4% for AGIs $25k-50k, 7.0% for AGIs $50k-75k, 5.8% for AGIs $75k-100k, -0.2% for AGIs over 100k)
Profit/loss from farming: +$10,672 (reported on 3.9% of returns)
Here:
+$10,672
State:
+$274
(% of AGI for various income ranges: 0.1% for AGIs $10k-25k, 1.4% for AGIs $25k-50k, 1.7% for AGIs $50k-75k, 1.4% for AGIs $75k-100k)
IRA payment deduction: $2,862 (reported on 4.2% of returns)
19507:
$2,862
Pennsylvania:
$2,903
Total itemized deductions: $15,912 (22% of AGI, reported on 30.8% of returns)
Here:
$15,912
State:
$18,804
Here:
22.0% of AGI
State:
19.5% of AGI
(% of AGI for various income ranges: 11.5% for AGIs $10k-25k, 9.6% for AGIs $25k-50k, 12.4% for AGIs $50k-75k, 15.1% for AGIs $75k-100k, 10.5% for AGIs over 100k)
Charity contributions deductions: $3,679 (5% of AGI, reported on 25.1% of returns)
Here:
$3,679
State:
$3,337
Here:
4.8% of AGI
State:
3.3% of AGI
(% of AGI for various income ranges: 1.0% for AGIs $10k-25k, 1.1% for AGIs $25k-50k, 1.8% for AGIs $50k-75k, 3.6% for AGIs $75k-100k, 3.1% for AGIs over 100k)
Total tax: $5,736 (reported on 78.5% of returns)
19507:
$5,736
State:
$8,008
(% of AGI for various income ranges: 4.8% for AGIs below $10k, 5.0% for AGIs $10k-25k, 7.3% for AGIs $25k-50k, 8.4% for AGIs $50k-75k, 10.2% for AGIs $75k-100k, 17.1% for AGIs over 100k)
Earned income credit: $1,329 (reported on 9.6% of returns)
Here:
$1,329
State:
$1,643
Percentage of individuals using paid preparers for their 2004 taxes: 70.8%
Here:
71%
State:
56%
(% for various income ranges: 63.5% for AGIs below $10k, 73.0% for AGIs $10k-25k, 70.6% for AGIs $25k-50k, 72.7% for AGIs $50k-75k, 73.5% for AGIs $75k-100k, 78.5% for AGIs over 100k)
Household received Food Stamps/SNAP in the past 12 months: 105 Household did not receive Food Stamps/SNAP in the past 12 months: 1,150
Women who had a birth in the past 12 months: 19 (20 now married, 0 unmarried) Women who did not have a birth in the past 12 months: 885 (372 now married, 512 unmarried)
Housing units in zip code 19507 with a mortgage: 670 (19 second mortgage, 19 both second mortgage and home equity loan) Houses without a mortgage: 89
Median monthly owner costs for units with a mortgage: $1,702 Median monthly owner costs for units without a mortgage: $578
Residents with income below the poverty level in 2022:
This zip code:
7.7%
Whole state:
11.8%
Residents with income below 50% of the poverty level in 2022:
This zip code:
5.9%
Whole state:
6.1%
Median number of rooms in houses and condos:
Here:
6.9
State:
6.8
Median number of rooms in apartments:
Here:
3.4
State:
4.3
Notable locations in this zip code not listed on our city pages
Notable locations in zip code 19507: Applebee Shelter (A), Camp Swatara (B), Hertline Shelter (C), Shikellamy Scout Camp (D), Union Fire Company of Bethel (E), American Legion Leon Deck Post 991 (F), Bethel Township Police Station (G), Union Fire Company of Bethel (H), Bethel-Tulpehocken Public Library (I), Golden Age Air Museum (J). Display/hide their locations on the map
Churches in zip code 19507 include: Meckville Church (A), Merkey Church (B), Tri-County Worship Center (C), Salem Church (D), Salem Lutheran Church (E), Christ Evangelical Free Church (F), Assemblies of Yahweh International Headquarters (G). Display/hide their locations on the map
Size of family households: 271 2-persons, 165 3-persons, 211 4-persons, 59 5-persons, 28 6-persons, 81 7-or-more-persons
Size of nonfamily households: 383 1-person, 55 2-persons
673 married couples with children.
0 single-parent households ().
94.3% of residents of 19507 zip code speak English at home.
4.1% of residents speak other Indo-European language at home (78% very well, 22% well).
0.5% of residents speak Asian or Pacific Island language at home (78% well, 22% not well).
Foreign born population: 97 (2.7%) (83.4% of them are naturalized citizens)
This zip code:
2.7%
Whole state:
7.5%
33%France
20%Greece
6%North Macedonia (Macedonia)
4%Poland
4%Thailand
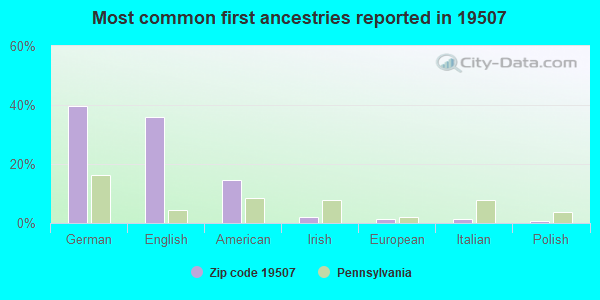
40%German
36%English
15%American
2%Irish
2%European
2%Italian
1%Polish
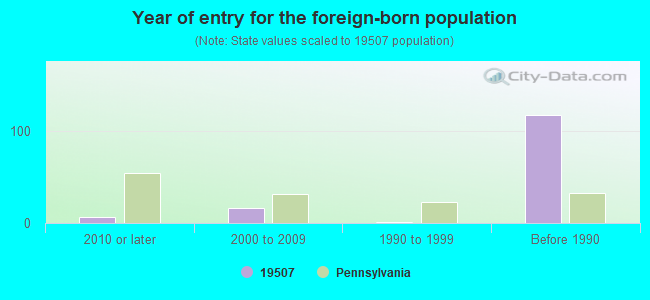
Year of entry for the foreign-born population
62010 or later
162000 to 2009
11990 to 1999
117Before 1990
Facilities with environmental interests located in this zip code:
BETHEL EL SCH ( in BETHEL, PA)
(National Center for Education Statistics) - STATE ID-6321 Organizations: TULPEHOCKEN AREA SD (SCHOOL DISTRICT)
ALL AMERICAN TRAVEL PLAZAS INCORPORATED (I 78 ROUTE 645 in BETHEL, PA)
National Pollutant Discharge Elimination System NON-MAJOR (Tracking pollutant discharge elimination systems) - permit National Pollutant Discharge Elimination System NON-MAJOR (Tracking pollutant discharge elimination systems) - permit Business SIC classification: GASOLINE SERVICE STATIONS Alternative names: ALL AMERICAN PLAZA FRYSTOWN, ALL AMERICAN PLAZAS INC, ALL AMERICAN PLAZAS INC - FRYS, FRYSTOWN ALL AMERICAN TRVL PLZ
Housing units lacking complete plumbing facilities: 6.1% Housing units lacking complete kitchen facilities: 10.6%
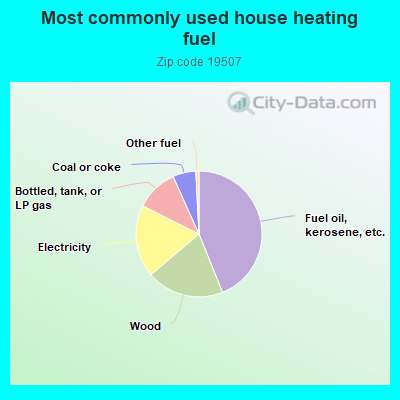
43.9%Fuel oil, kerosene, etc.
19.9%Wood
18.6%Electricity
10.9%Bottled, tank, or LP gas
5.9%Coal or coke
0.8%Other fuel
Population in 1990: 3,523.
Place of birth for U.S.-born residents:
This state: 3,065
Northeast: 213
Midwest: 86
South: 23
West: 103
69% of the 19507 zip code residents lived in the same house 5 years ago. Out of people who lived in different houses, 46% lived in this county. Out of people who lived in different counties, 50% lived in Pennsylvania.
90% of the 19507 zip code residents lived in the same house 1 year ago. Out of people who lived in different houses, 47% moved from this county. Out of people who lived in different houses, 27% moved from different county within same state. Out of people who lived in different houses, 22% moved from different state. Out of people who lived in different houses, 3% moved from abroad.
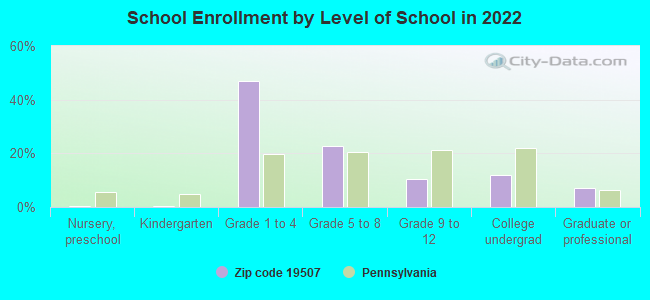
Private vs. public school enrollment:
Students in private schools in grades 1 to 8 (elementary and middle school): 202
Here:
35.1%
Pennsylvania:
15.7%
Students in private schools in grades 9 to 12 (high school):
Here:
0.0%
Pennsylvania:
13.4%
Students in private undergraduate colleges: 45
Here:
46.7%
Pennsylvania:
39.8%
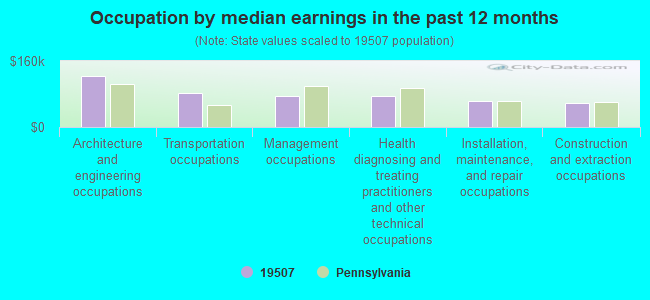
Occupation by median earnings in the past 12 months ($)
124,089Architecture and engineering occupations
82,868Transportation occupations
74,713Management occupations
74,155Health diagnosing and treating practitioners and other technical occupations
62,881Installation, maintenance, and repair occupations
57,091Construction and extraction occupations
Companies with federal contracts located in this zip code:
GERMANTOWN GROUP (9190 OLD RT 22 in BETHEL, PA; small business)
$53,640 with Army for Safety and Rescue Equipment. Taking place in NJ. Signed on 2001-10-26. Completion date: 2001-12-31.
Top industries in this zip code by the number of employees in 2005:
Other Services (except Public Administration): Religious Organizations (10-19 employees: 1 establishment, 5-9 employees: 3 establishments, 1-4 employees: 3 establishments)
Accommodation and Food Services: Limited-Service Restaurants (20-49: 1, 1-4: 1)
Accommodation and Food Services: Hotels (except Casino Hotels) and Motels (20-49: 1)
Construction: Masonry Contractors (20-49: 1)
Administrative and Support and Waste Management and Remediation Services: Other Services to Buildings and Dwellings (20-49: 1)
Fatal accident statistics in 2014:
Fatal accident count: 1
Vehicles involved in fatal accidents: 1
Fatal accidents caused by drunken drivers: 0
Fatalities: 1
Persons involved in fatal accidents: 2
Pedestrians involved in fatal accidents: 1
Fatal accident statistics in 2013:
Fatal accident count: 3
Vehicles involved in fatal accidents: 3
Fatal accidents caused by drunken drivers: 1
Fatalities: 3
Persons involved in fatal accidents: 3
Pedestrians involved in fatal accidents: 0
Home Mortgage Disclosure Act Aggregated Statistics For Year 2009 (Based on 2 partial tracts)
A) FHA, FSA/RHS & VA Home Purchase Loans
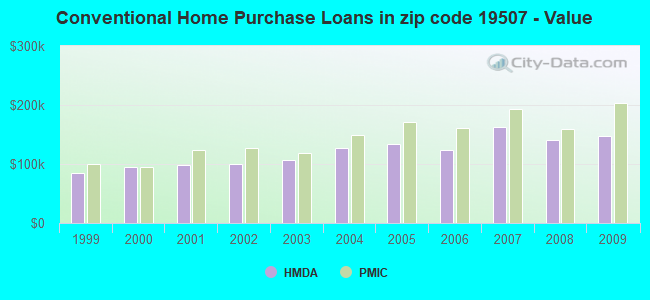
B) Conventional Home Purchase Loans
C) Refinancings
D) Home Improvement Loans
F) Non-occupant Loans on < 5 Family Dwellings (A B C & D)
G) Loans On Manufactured Home Dwelling (A B C & D)
Number
Average Value
Number
Average Value
Number
Average Value
Number
Average Value
Number
Average Value
Number
Average Value
LOANS ORIGINATED
9
$141,696
28
$148,182
133
$133,254
17
$51,178
12
$189,587
6
$124,263
APPLICATIONS APPROVED, NOT ACCEPTED
3
$155,993
1
$144,650
3
$154,930
1
$11,700
0
$0
0
$0
APPLICATIONS DENIED
4
$135,078
6
$123,555
51
$150,635
11
$19,532
2
$194,105
12
$101,662
APPLICATIONS WITHDRAWN
0
$0
3
$179,040
21
$165,111
0
$0
0
$0
1
$122,310
FILES CLOSED FOR INCOMPLETENESS
0
$0
2
$220,165
1
$140,400
1
$15,950
1
$15,950
1
$123,380
Aggregated Statistics For Year 2008 (Based on 2 partial tracts)
A) FHA, FSA/RHS & VA Home Purchase Loans
B) Conventional Home Purchase Loans
C) Refinancings
D) Home Improvement Loans
F) Non-occupant Loans on < 5 Family Dwellings (A B C & D)
G) Loans On Manufactured Home Dwelling (A B C & D)
Number
Average Value
Number
Average Value
Number
Average Value
Number
Average Value
Number
Average Value
Number
Average Value
LOANS ORIGINATED
3
$147,487
24
$140,484
85
$136,729
26
$39,476
4
$228,940
5
$77,218
APPLICATIONS APPROVED, NOT ACCEPTED
0
$0
6
$108,487
24
$101,485
1
$26,590
1
$141,460
5
$48,500
APPLICATIONS DENIED
2
$116,995
13
$114,542
66
$166,518
11
$119,316
1
$207,400
6
$56,903
APPLICATIONS WITHDRAWN
0
$0
5
$186,980
14
$169,948
2
$129,760
0
$0
1
$143,590
FILES CLOSED FOR INCOMPLETENESS
1
$144,650
0
$0
5
$159,114
0
$0
1
$184,000
1
$122,310
Aggregated Statistics For Year 2007 (Based on 2 partial tracts)
A) FHA, FSA/RHS & VA Home Purchase Loans
B) Conventional Home Purchase Loans
C) Refinancings
D) Home Improvement Loans
F) Non-occupant Loans on < 5 Family Dwellings (A B C & D)
G) Loans On Manufactured Home Dwelling (A B C & D)
Number
Average Value
Number
Average Value
Number
Average Value
Number
Average Value
Number
Average Value
Number
Average Value
LOANS ORIGINATED
2
$186,130
76
$162,549
108
$124,008
51
$50,844
11
$178,201
6
$98,560
APPLICATIONS APPROVED, NOT ACCEPTED
1
$163,790
9
$138,977
21
$88,937
0
$0
1
$302,060
2
$97,320
APPLICATIONS DENIED
0
$0
22
$175,832
98
$142,305
22
$98,770
6
$161,313
11
$100,752
APPLICATIONS WITHDRAWN
0
$0
5
$157,200
20
$157,306
2
$23,930
1
$160,600
2
$122,315
FILES CLOSED FOR INCOMPLETENESS
1
$168,050
3
$186,840
14
$159,236
1
$15,950
0
$0
0
$0
Aggregated Statistics For Year 2006 (Based on 2 partial tracts)
A) FHA, FSA/RHS & VA Home Purchase Loans
B) Conventional Home Purchase Loans
C) Refinancings
D) Home Improvement Loans
E) Loans on Dwellings For 5+ Families
F) Non-occupant Loans on < 5 Family Dwellings (A B C & D)
G) Loans On Manufactured Home Dwelling (A B C & D)
Number
Average Value
Number
Average Value
Number
Average Value
Number
Average Value
Number
Average Value
Number
Average Value
Number
Average Value
LOANS ORIGINATED
2
$222,290
99
$124,140
131
$112,587
57
$38,234
1
$388,210
18
$92,888
10
$71,048
APPLICATIONS APPROVED, NOT ACCEPTED
0
$0
7
$113,197
26
$113,969
2
$37,225
0
$0
2
$208,465
2
$103,170
APPLICATIONS DENIED
1
$52,120
27
$134,211
99
$145,616
20
$50,468
0
$0
1
$246,760
16
$79,172
APPLICATIONS WITHDRAWN
0
$0
6
$111,323
61
$134,850
1
$124,440
0
$0
2
$90,940
3
$103,877
FILES CLOSED FOR INCOMPLETENESS
0
$0
1
$285,040
10
$123,378
1
$27,650
0
$0
0
$0
0
$0
Aggregated Statistics For Year 2005 (Based on 2 partial tracts)
A) FHA, FSA/RHS & VA Home Purchase Loans
B) Conventional Home Purchase Loans
C) Refinancings
D) Home Improvement Loans
F) Non-occupant Loans on < 5 Family Dwellings (A B C & D)
G) Loans On Manufactured Home Dwelling (A B C & D)
Number
Average Value
Number
Average Value
Number
Average Value
Number
Average Value
Number
Average Value
Number
Average Value
LOANS ORIGINATED
1
$188,260
84
$133,127
130
$102,376
47
$46,165
12
$136,229
12
$77,111
APPLICATIONS APPROVED, NOT ACCEPTED
0
$0
5
$67,006
36
$101,840
2
$23,930
0
$0
6
$84,733
APPLICATIONS DENIED
1
$110,610
23
$103,678
129
$115,116
20
$52,383
3
$75,870
22
$72,325
APPLICATIONS WITHDRAWN
0
$0
12
$105,651
90
$144,425
7
$122,770
2
$107,955
1
$95,720
FILES CLOSED FOR INCOMPLETENESS
0
$0
0
$0
14
$178,001
1
$358,430
1
$71,260
0
$0
Aggregated Statistics For Year 2004 (Based on 2 partial tracts)
A) FHA, FSA/RHS & VA Home Purchase Loans
B) Conventional Home Purchase Loans
C) Refinancings
D) Home Improvement Loans
F) Non-occupant Loans on < 5 Family Dwellings (A B C & D)
G) Loans On Manufactured Home Dwelling (A B C & D)
Number
Average Value
Number
Average Value
Number
Average Value
Number
Average Value
Number
Average Value
Number
Average Value
LOANS ORIGINATED
3
$124,797
69
$127,586
126
$95,395
24
$51,319
7
$134,317
12
$74,275
APPLICATIONS APPROVED, NOT ACCEPTED
0
$0
15
$85,939
40
$108,408
4
$86,950
1
$86,150
10
$61,689
APPLICATIONS DENIED
0
$0
19
$110,111
101
$120,871
18
$32,381
2
$131,885
9
$104,823
APPLICATIONS WITHDRAWN
0
$0
4
$72,858
78
$115,701
3
$16,663
1
$54,240
3
$78,353
FILES CLOSED FOR INCOMPLETENESS
0
$0
2
$109,550
17
$144,837
1
$10,640
0
$0
0
$0
Aggregated Statistics For Year 2003 (Based on 2 partial tracts)
A) FHA, FSA/RHS & VA Home Purchase Loans
B) Conventional Home Purchase Loans
C) Refinancings
D) Home Improvement Loans
E) Loans on Dwellings For 5+ Families
F) Non-occupant Loans on < 5 Family Dwellings (A B C & D)
Number
Average Value
Number
Average Value
Number
Average Value
Number
Average Value
Number
Average Value
Number
Average Value
LOANS ORIGINATED
3
$101,043
62
$106,446
258
$92,137
37
$25,038
0
$0
14
$76,883
APPLICATIONS APPROVED, NOT ACCEPTED
1
$81,900
4
$71,528
46
$73,573
3
$15,953
0
$0
2
$109,020
APPLICATIONS DENIED
0
$0
15
$74,452
100
$112,550
20
$34,780
0
$0
2
$44,140
APPLICATIONS WITHDRAWN
0
$0
5
$111,890
66
$108,407
3
$37,580
1
$276,540
0
$0
FILES CLOSED FOR INCOMPLETENESS
1
$142,520
1
$212,720
5
$146,564
0
$0
0
$0
0
$0
Aggregated Statistics For Year 2002 (Based on 2 partial tracts)
A) FHA, FSA/RHS & VA Home Purchase Loans
B) Conventional Home Purchase Loans
C) Refinancings
D) Home Improvement Loans
F) Non-occupant Loans on < 5 Family Dwellings (A B C & D)
Number
Average Value
Number
Average Value
Number
Average Value
Number
Average Value
Number
Average Value
LOANS ORIGINATED
9
$104,469
56
$99,200
187
$89,411
35
$20,634
10
$57,860
APPLICATIONS APPROVED, NOT ACCEPTED
0
$0
7
$81,746
35
$85,179
9
$44,199
0
$0
APPLICATIONS DENIED
0
$0
11
$106,456
80
$95,019
16
$21,604
1
$117,000
APPLICATIONS WITHDRAWN
0
$0
3
$88,633
60
$98,809
0
$0
2
$76,045
FILES CLOSED FOR INCOMPLETENESS
0
$0
0
$0
14
$103,853
0
$0
1
$88,280
Aggregated Statistics For Year 2001 (Based on 2 partial tracts)
A) FHA, FSA/RHS & VA Home Purchase Loans
B) Conventional Home Purchase Loans
C) Refinancings
D) Home Improvement Loans
E) Loans on Dwellings For 5+ Families
F) Non-occupant Loans on < 5 Family Dwellings (A B C & D)
Number
Average Value
Number
Average Value
Number
Average Value
Number
Average Value
Number
Average Value
Number
Average Value
LOANS ORIGINATED
6
$143,232
58
$97,998
135
$89,106
31
$25,286
1
$99,980
9
$62,043
APPLICATIONS APPROVED, NOT ACCEPTED
0
$0
4
$72,325
31
$87,044
2
$15,955
0
$0
1
$77,640
APPLICATIONS DENIED
0
$0
10
$51,585
67
$81,834
10
$19,996
0
$0
1
$102,110
APPLICATIONS WITHDRAWN
0
$0
3
$52,117
43
$91,297
6
$38,290
0
$0
0
$0
FILES CLOSED FOR INCOMPLETENESS
0
$0
0
$0
11
$107,230
0
$0
0
$0
0
$0
Aggregated Statistics For Year 2000 (Based on 2 partial tracts)
A) FHA, FSA/RHS & VA Home Purchase Loans
B) Conventional Home Purchase Loans
C) Refinancings
D) Home Improvement Loans
F) Non-occupant Loans on < 5 Family Dwellings (A B C & D)
Number
Average Value
Number
Average Value
Number
Average Value
Number
Average Value
Number
Average Value
LOANS ORIGINATED
2
$119,125
53
$95,744
76
$67,553
43
$22,657
5
$48,926
APPLICATIONS APPROVED, NOT ACCEPTED
0
$0
10
$75,941
28
$76,503
10
$16,060
1
$68,070
APPLICATIONS DENIED
0
$0
15
$90,548
74
$85,749
13
$44,098
2
$63,285
APPLICATIONS WITHDRAWN
0
$0
7
$110,919
34
$73,263
3
$54,243
1
$68,070
FILES CLOSED FOR INCOMPLETENESS
0
$0
1
$255,260
2
$111,680
2
$31,910
0
$0
Aggregated Statistics For Year 1999 (Based on 1 partial tract)
A) FHA, FSA/RHS & VA Home Purchase Loans
B) Conventional Home Purchase Loans
C) Refinancings
D) Home Improvement Loans
F) Non-occupant Loans on < 5 Family Dwellings (A B C & D)
Detailed PMIC statistics for the following Tracts:0101.00
2003 - 2018 National Fire Incident Reporting System (NFIRS) incidents
Based on the data from the years 2003 - 2018 the average number of fires per year is 25. The highest number of reported fire incidents - 63 took place in 2018, and the least - 0 in 2011. The data has an increasing trend.
When looking into fire subcategories, the most incidents belonged to: Structure Fires (54.8%), and Outside Fires (23.9%).
Fire incident types reported to NFIRS in Zip Code 19507


 Nearest zip codes: 19550, 17087, 19559, 17979, 19544, 17933.


 Based on the data from the years 2003 - 2018 the average number of fires per year is 25. The highest number of reported fire incidents - 63 took place in 2018, and the least - 0 in 2011. The data has an increasing trend.
 When looking into fire subcategories, the most incidents belonged to: Structure Fires (54.8%), and Outside Fires (23.9%).