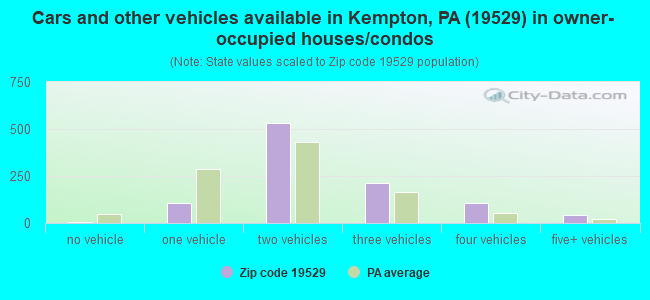
Estimated zip code population in 2022: 3,351 Zip code population in 2010: 3,131 Zip code population in 2000: 3,076
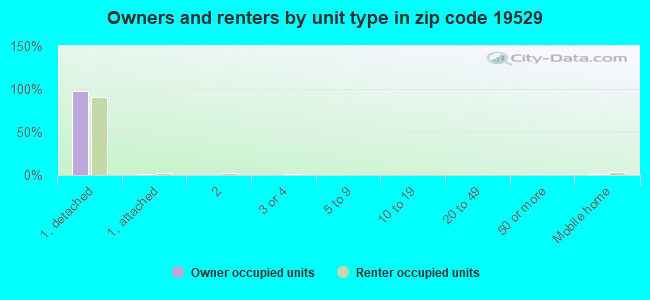
Houses and condos: 1,242 Renter-occupied apartments: 155
% of renters here:
13%
State:
31%
March 2022 cost of living index in zip code 19529: 93.8 (less than average, U.S. average is 100)
Land area: 58.1 sq. mi. Water area: 0.2 sq. mi.
Population density: 58 people per square mile
(very low).
OSM Map
General Map
Google Map
MSN Map
OSM Map
General Map
Google Map
MSN Map
OSM Map
General Map
Google Map
MSN Map
OSM Map
General Map
Google Map
MSN Map
Please wait while loading the map...
Real estate property taxes paid for housing units in 2022:
This zip code:
1.5% ($4,608)
Pennsylvania:
1.3% ($3,094)
Median real estate property taxes paid for housing units with mortgages in 2022: $4,758 (1.4%) Median real estate property taxes paid for housing units with no mortgage in 2022: $4,284 (1.5%)
Business Search- 14 Million verified businesses
Males: 1,702
(50.8%)
Females: 1,649
(49.2%)
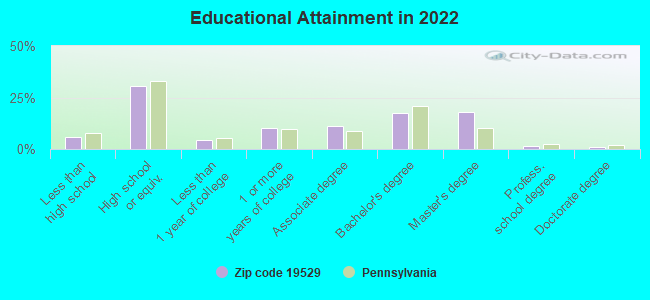
For population 25 years and over in 19529:
High school or higher: 94.5%
Bachelor's degree or higher: 37.9%
Graduate or professional degree: 20.4%
Unemployed: 4.4%
Mean travel time to work (commute): 27.0 minutes
For population 15 years and over in 19529:
Never married: 23.9%
Now married: 56.1%
Separated: 1.5%
Widowed: 11.3%
Divorced: 7.2%
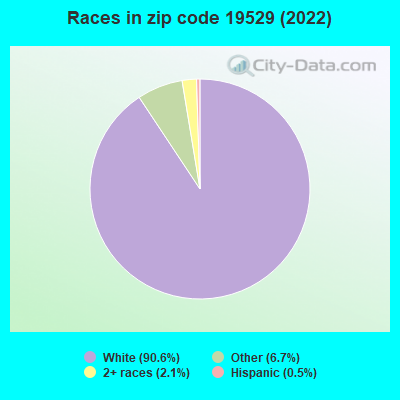
Zip code 19529 compared to state average:
Black race population percentage significantly below state average.
Hispanic race population percentage significantly below state average.
Median age significantly above state average.
Foreign-born population percentage significantly below state average.
Renting percentage significantly below state average.
Length of stay since moving in significantly above state average.
Estimated median house/condo value in 2022: $317,565
19529:
$317,565
Pennsylvania:
$245,500
According to our research of Pennsylvania and other state lists, there was 1 registered sex offender living in 19529 zip code as of May 20, 2024. The ratio of all residents to sex offenders in zip code 19529 is 3,531 to 1. The ratio of registered sex offenders to all residents in this zip code is much lower than the state average.
Median resident age:
This zip code:
50.5 years
Pennsylvania median age:
40.9 years
Average household size:
This zip code:
2.8 people
Pennsylvania:
2.4 people
Averages for the 2020 tax year for zip code 19529, filed in 2021:
Average Adjusted Gross Income (AGI) in 2020: $84,691 (Individual Income Tax Returns)
Here:
$84,691
State:
$75,707
Salary/wage: $64,625 (reported on 77.2% of returns)
Here:
$64,625
State:
$62,806
(% of AGI for various income ranges: 1293.7% for AGIs below $25k, 3487.6% for AGIs $25k-50k, 6581.3% for AGIs $50k-75k, 9397.0% for AGIs $75k-100k, 15448.3% for AGIs $100k-200k)
Taxable interest for individuals: $2,053 (reported on 43.0% of returns)
This zip code:
$2,053
Pennsylvania:
$1,633
(% of AGI for various income ranges: 53.7% for AGIs below $25k, 48.1% for AGIs $25k-50k, 108.7% for AGIs $50k-75k, 42.0% for AGIs $75k-100k, 132.2% for AGIs $100k-200k)
Ordinary dividends: $11,302 (reported on 33.6% of returns)
Here:
$11,302
State:
$7,382
(% of AGI for various income ranges: 148.9% for AGIs below $25k, 163.8% for AGIs $25k-50k, 252.0% for AGIs $50k-75k, 289.0% for AGIs $75k-100k, 648.3% for AGIs $100k-200k)
Net capital gain/loss in AGI: +$31,919 (reported on 28.2% of returns)
Here:
+$31,919
State:
+$23,522
(% of AGI for various income ranges: 34.7% for AGIs below $25k, 69.0% for AGIs $25k-50k, 202.7% for AGIs $50k-75k, 418.0% for AGIs $75k-100k, 670.0% for AGIs $100k-200k)
Profit/loss from business: +$17,526 (reported on 15.4% of returns)
Here:
+$17,526
State:
+$16,274
(% of AGI for various income ranges: 111.1% for AGIs below $25k, 284.3% for AGIs $25k-50k, 302.0% for AGIs $50k-75k, 106.0% for AGIs $75k-100k, 675.6% for AGIs $100k-200k)
Taxable individual retirement arrangement distribution: $16,170 (reported on 13.4% of returns)
19529:
$16,170
Pennsylvania:
$18,583
(% of AGI for various income ranges: 151.6% for AGIs below $25k, 175.7% for AGIs $25k-50k, 208.0% for AGIs $50k-75k, 456.0% for AGIs $75k-100k, 1005.0% for AGIs $100k-200k)
Total itemized deductions: $33,167 (reported on 8.1% of returns)
Here:
$33,167
State:
$34,850
(% of AGI for various income ranges: 373.3% for AGIs $25k-50k, 528.0% for AGIs $75k-100k, 540.6% for AGIs $100k-200k)
Charity contributions: $19,050 (reported on 5.4% of returns)
Here:
$19,050
State:
$12,392
(% of AGI for various income ranges: 91.3% for AGIs $50k-75k, 164.4% for AGIs $100k-200k)
Taxes paid: $8,155 (reported on 7.4% of returns)
19529:
$8,155
State:
$8,200
(% of AGI for various income ranges: 76.2% for AGIs $25k-50k, 171.0% for AGIs $75k-100k, 160.0% for AGIs $100k-200k)
Earned income credit: $1,636 (reported on 7.4% of returns)
Here:
$1,636
State:
$2,100
(% of AGI for various income ranges: 41.1% for AGIs below $25k, 48.6% for AGIs $25k-50k)
Percentage of individuals using paid preparers for their 2020 taxes: 91.3%
Here:
91%
State:
92%
(% for various income ranges: 89.7% for AGIs below $25k, 93.5% for AGIs $25k-50k, 91.3% for AGIs $50k-75k, 93.8% for AGIs $75k-100k, 90.0% for AGIs $100k-200k, 90.0% for AGIs over 200k)
Averages for the 2012 tax year for zip code 19529, filed in 2013:
Average Adjusted Gross Income (AGI) in 2012: $79,478 (Individual Income Tax Returns)
Here:
$79,478
State:
$61,346
Salary/wage: $53,145 (reported on 80.0% of returns)
Here:
$53,145
State:
$51,902
(% of AGI for various income ranges: 65.1% for AGIs below $25k, 74.4% for AGIs $25k-50k, 75.6% for AGIs $50k-75k, 75.6% for AGIs $75k-100k, 74.3% for AGIs $100k-200k, 21.9% for AGIs over 200k)
Taxable interest for individuals: $1,807 (reported on 47.3% of returns)
This zip code:
$1,807
Pennsylvania:
$1,588
(% of AGI for various income ranges: 2.8% for AGIs below $25k, 1.8% for AGIs $25k-50k, 0.8% for AGIs $50k-75k, 0.6% for AGIs $75k-100k, 1.5% for AGIs $100k-200k, 0.7% for AGIs over 200k)
Ordinary dividends: $8,215 (reported on 32.0% of returns)
Here:
$8,215
State:
$5,827
(% of AGI for various income ranges: 7.2% for AGIs below $25k, 1.7% for AGIs $25k-50k, 2.3% for AGIs $50k-75k, 1.5% for AGIs $75k-100k, 3.3% for AGIs $100k-200k, 4.1% for AGIs over 200k)
Net capital gain/loss in AGI: +$15,868 (reported on 22.7% of returns)
Here:
+$15,868
State:
+$14,495
(% of AGI for various income ranges: 0.2% for AGIs $25k-50k, 0.8% for AGIs $50k-75k, 1.8% for AGIs $75k-100k, 2.5% for AGIs $100k-200k, 9.3% for AGIs over 200k)
Profit/loss from business: +$11,374 (reported on 15.3% of returns)
Here:
+$11,374
State:
+$16,268
(% of AGI for various income ranges: 7.5% for AGIs below $25k, 5.5% for AGIs $25k-50k, 3.4% for AGIs $50k-75k, 2.2% for AGIs $75k-100k, 2.7% for AGIs $100k-200k)
Taxable individual retirement arrangement distribution: $11,467 (reported on 12.0% of returns)
19529:
$11,467
Pennsylvania:
$14,550
(% of AGI for various income ranges: 5.1% for AGIs below $25k, 2.3% for AGIs $25k-50k, 1.6% for AGIs $50k-75k, 3.1% for AGIs $75k-100k, 3.2% for AGIs $100k-200k)
Total itemized deductions: $23,266 (14% of AGI, reported on 35.3% of returns)
Here:
$23,266
State:
$23,538
Here:
14.1% of AGI
State:
18.4% of AGI
(% of AGI for various income ranges: 8.0% for AGIs below $25k, 10.2% for AGIs $25k-50k, 11.2% for AGIs $50k-75k, 15.0% for AGIs $75k-100k, 14.9% for AGIs $100k-200k, 6.6% for AGIs over 200k)
Charity contributions: $3,525 (reported on 29.3% of returns)
Here:
$3,525
State:
$4,025
(% of AGI for various income ranges: 0.9% for AGIs below $25k, 1.2% for AGIs $25k-50k, 1.1% for AGIs $50k-75k, 1.9% for AGIs $75k-100k, 1.9% for AGIs $100k-200k, 0.9% for AGIs over 200k)
Taxes paid: $10,326 (reported on 35.3% of returns)
19529:
$10,326
State:
$9,982
(% of AGI for various income ranges: 2.1% for AGIs below $25k, 3.0% for AGIs $25k-50k, 4.5% for AGIs $50k-75k, 6.0% for AGIs $75k-100k, 6.8% for AGIs $100k-200k, 3.7% for AGIs over 200k)
Earned income credit: $1,814 (reported on 9.3% of returns)
Here:
$1,814
State:
$2,106
(% of AGI for various income ranges: 3.2% for AGIs below $25k, 0.6% for AGIs $25k-50k)
Percentage of individuals using paid preparers for their 2012 taxes: 58.0%
Here:
58%
State:
53%
(% for various income ranges: 52.9% for AGIs below $25k, 57.1% for AGIs $25k-50k, 60.9% for AGIs $50k-75k, 62.5% for AGIs $75k-100k, 60.0% for AGIs $100k-200k, 80.0% for AGIs over 200k)
Averages for the 2004 tax year for zip code 19529, filed in 2005:
Average Adjusted Gross Income (AGI) in 2004: $47,778 (Individual Income Tax Returns)
Here:
$47,778
State:
$48,049
Salary/wage: $42,793 (reported on 81.8% of returns)
Here:
$42,793
State:
$42,646
(% of AGI for various income ranges: 72.9% for AGIs below $10k, 68.5% for AGIs $10k-25k, 74.6% for AGIs $25k-50k, 80.9% for AGIs $50k-75k, 79.4% for AGIs $75k-100k, 65.6% for AGIs over 100k)
Taxable interest for individuals: $1,539 (reported on 61.9% of returns)
This zip code:
$1,539
Pennsylvania:
$1,657
(% of AGI for various income ranges: 8.7% for AGIs below $10k, 4.8% for AGIs $10k-25k, 2.3% for AGIs $25k-50k, 1.4% for AGIs $50k-75k, 0.9% for AGIs $75k-100k, 1.8% for AGIs over 100k)
Taxable dividends: $4,427 (reported on 37.5% of returns)
Here:
$4,427
State:
$3,566
(% of AGI for various income ranges: 8.2% for AGIs below $10k, 6.5% for AGIs $10k-25k, 2.1% for AGIs $25k-50k, 1.4% for AGIs $50k-75k, 2.4% for AGIs $75k-100k, 5.2% for AGIs over 100k)
Net capital gain/loss: +$6,753 (reported on 27.2% of returns)
Here:
+$6,753
State:
+$9,716
(% of AGI for various income ranges: 1.6% for AGIs below $10k, 2.3% for AGIs $10k-25k, 1.0% for AGIs $25k-50k, 1.3% for AGIs $50k-75k, 3.0% for AGIs $75k-100k, 7.8% for AGIs over 100k)
Profit/loss from business: +$12,167 (reported on 16.8% of returns)
Here:
+$12,167
State:
+$14,267
(% of AGI for various income ranges: 14.6% for AGIs below $10k, 3.5% for AGIs $10k-25k, 7.8% for AGIs $25k-50k, 4.1% for AGIs $50k-75k, 3.4% for AGIs $75k-100k, 2.6% for AGIs over 100k)
IRA payment deduction: $3,032 (reported on 4.3% of returns)
19529:
$3,032
Pennsylvania:
$2,903
Total itemized deductions: $16,929 (19% of AGI, reported on 33.7% of returns)
Here:
$16,929
State:
$18,804
Here:
18.9% of AGI
State:
19.5% of AGI
(% of AGI for various income ranges: 8.9% for AGIs $10k-25k, 10.0% for AGIs $25k-50k, 12.1% for AGIs $50k-75k, 14.7% for AGIs $75k-100k, 12.8% for AGIs over 100k)
Charity contributions deductions: $2,648 (3% of AGI, reported on 29.4% of returns)
Here:
$2,648
State:
$3,337
Here:
2.8% of AGI
State:
3.3% of AGI
(% of AGI for various income ranges: 0.5% for AGIs $10k-25k, 1.1% for AGIs $25k-50k, 1.2% for AGIs $50k-75k, 1.6% for AGIs $75k-100k, 2.6% for AGIs over 100k)
Total tax: $7,019 (reported on 79.5% of returns)
19529:
$7,019
State:
$8,008
(% of AGI for various income ranges: 4.0% for AGIs below $10k, 4.8% for AGIs $10k-25k, 7.8% for AGIs $25k-50k, 8.8% for AGIs $50k-75k, 10.3% for AGIs $75k-100k, 18.0% for AGIs over 100k)
Earned income credit: $1,453 (reported on 6.5% of returns)
Here:
$1,453
State:
$1,643
Percentage of individuals using paid preparers for their 2004 taxes: 61.0%
Here:
61%
State:
56%
(% for various income ranges: 49.4% for AGIs below $10k, 64.4% for AGIs $10k-25k, 66.7% for AGIs $25k-50k, 64.3% for AGIs $50k-75k, 65.0% for AGIs $75k-100k, 57.6% for AGIs over 100k)
Household received Food Stamps/SNAP in the past 12 months: 86 Household did not receive Food Stamps/SNAP in the past 12 months: 1,078
Women who had a birth in the past 12 months: 35 (27 now married, 8 unmarried) Women who did not have a birth in the past 12 months: 483 (275 now married, 204 unmarried)
Housing units in zip code 19529 with a mortgage: 562 (60 second mortgage, 5 home equity loan, 55 both second mortgage and home equity loan) Houses without a mortgage: 30
Median monthly owner costs for units with a mortgage: $1,749 Median monthly owner costs for units without a mortgage: $670
Residents with income below the poverty level in 2022:
This zip code:
8.9%
Whole state:
11.8%
Residents with income below 50% of the poverty level in 2022:
This zip code:
2.8%
Whole state:
6.1%
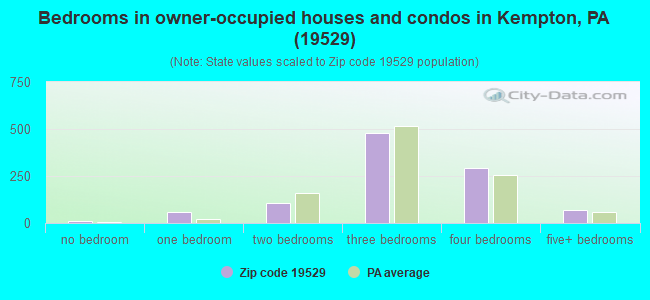
Median number of rooms in houses and condos:
Here:
6.9
State:
6.8
Median number of rooms in apartments:
Here:
6.1
State:
4.3
Notable locations in this zip code not listed on our city pages
Notable locations in zip code 19529: South Lookout (A), Appalachian Overlook (B), Bald Lookout (C), Blue Mountain House of Hope (D), Ridge Overlook (E), River of Rocks Overlook (F), The Pinnacle (G), Hawk Mountain Sanctuary Visitors Center (H), Kempton Fire Company (I), Kempton Fire Company Social Hall (J). Display/hide their locations on the map
In group quarters: 20 (-1 institutionalized population)
Size of family households: 375 2-persons, 181 3-persons, 141 4-persons, 81 5-persons, 15 6-persons, 38 7-or-more-persons
Size of nonfamily households: 255 1-person, 78 2-persons
509 married couples with children.
102 single-parent households (4 men, 98 women).
96.8% of residents of 19529 zip code speak English at home.
0.1% of residents speak Spanish at home (100% not well).
3.0% of residents speak other Indo-European language at home (88% very well, 12% well).
0.1% of residents speak Asian or Pacific Island language at home (100% very well).
Foreign born population: 72 (2.2%) (71.8% of them are naturalized citizens)
This zip code:
2.2%
Whole state:
7.5%
14%Sweden
13%United Kingdom, excluding England and Scotland
8%France
7%Serbia
6%Netherlands
3%Germany
3%Italy
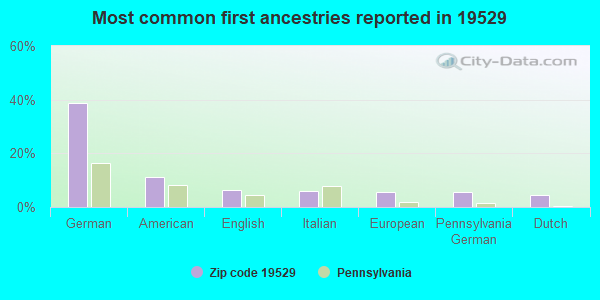
39%German
11%American
6%English
6%Italian
6%European
6%Pennsylvania German
4%Dutch
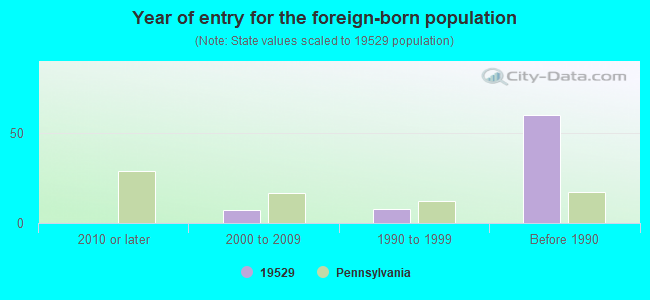
Year of entry for the foreign-born population
02010 or later
72000 to 2009
81990 to 1999
60Before 1990
Facilities with environmental interests located in this zip code:
ADAMS RES (RR 2 BOX 213 in KEMPTON, PA)
STATE MASTER (Pennsylvania database) - PCS-PA0086169, National Pollutant Discharge Elimination System Permit National Pollutant Discharge Elimination System NON-MAJOR (Tracking pollutant discharge elimination systems) - permit Business SIC classification: SEWERAGE SYSTEMS; OPERATORS OF DWELLINGS OTHER THAN APARTMENT BUILDINGS Alternative names: ADAMS, JAMES & SANDRA, HARAKEL & SCHENWAR RESIDENCE, JAMES & SANDRA ADAMS
ALBANY EL SCH ( in KEMPTON, PA)
(National Center for Education Statistics) - STATE ID-6314 Organizations: KUTZTOWN AREA SD (SCHOOL DISTRICT)
.ISTLER DANE AND GRANDSON INC (9128 KINGS HWY in KEMPTON, PA)
TRANSPORTER (Resource Conservation and Recovery Act (tracking hazardous waste)) Organizations: DELONG DAVID K (CONTACT/OWNER)
B&R AUTO REFINISHING (8660 KISTLER VALLY in KEMPTON, PA)
Small Quantity Generators, between 100 kg and 1000 kg of hazardous waste/month (Resource Conservation and Recovery Act (tracking hazardous waste)) - notification Organizations: RASSLER BRYAN (CONTACT/OWNER)
Housing units lacking complete plumbing facilities: 1.5% Housing units lacking complete kitchen facilities: 3.1%
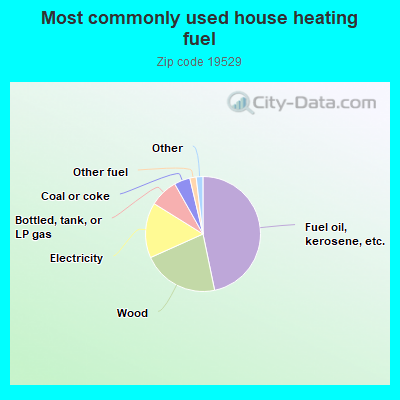
46.9%Fuel oil, kerosene, etc.
21.6%Wood
15.6%Electricity
8.0%Bottled, tank, or LP gas
4.5%Coal or coke
1.8%Other fuel
0.8%No fuel used
0.7%Utility gas
Population in 1990: 2,387. Population change in the 1990s: +689 (+28.9%).
Place of birth for U.S.-born residents:
This state: 2,599
Northeast: 311
Midwest: 77
South: 171
West: 99
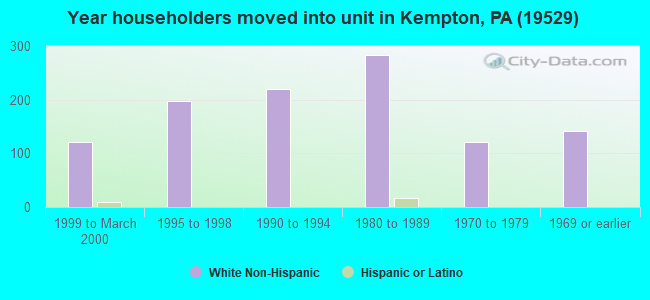
72% of the 19529 zip code residents lived in the same house 5 years ago. Out of people who lived in different houses, 52% lived in this county. Out of people who lived in different counties, 50% lived in Pennsylvania.
96% of the 19529 zip code residents lived in the same house 1 year ago. Out of people who lived in different houses, 47% moved from this county. Out of people who lived in different houses, 48% moved from different county within same state. Out of people who lived in different houses, 8% moved from different state.
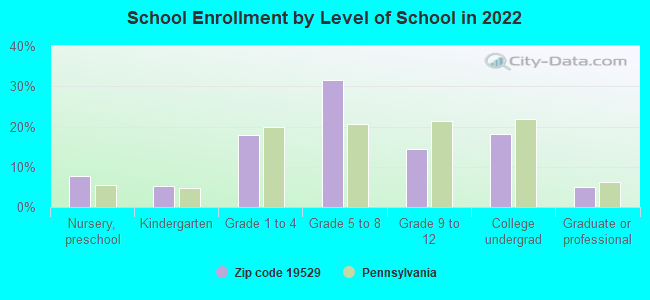
Private vs. public school enrollment:
Students in private schools in grades 1 to 8 (elementary and middle school): 156
Here:
41.8%
Pennsylvania:
15.7%
Students in private schools in grades 9 to 12 (high school): 26
Here:
25.1%
Pennsylvania:
13.4%
Students in private undergraduate colleges: 23
Here:
17.9%
Pennsylvania:
39.8%
Occupation by median earnings in the past 12 months ($)
187,968Computer and mathematical occupations
138,835Architecture and engineering occupations
113,082Law enforcement workers including supervisors
90,476Management occupations
62,222Health diagnosing and treating practitioners and other technical occupations
58,536Installation, maintenance, and repair occupations
Companies with federal contracts located in this zip code:
KETTLE CREEK CORPORATION (MAIN ST in KEMPTON, PA; small business) : $77,128 in 8 contractsfrom 2001 to 2005
Contracts for Household and Commercial Utility Containers, ADP Central Processing Unit (CPU, Computer), Analog by Army, Navy, Federal Supply Service, U.S. Army Corps of Engineers - civil program financing only, and others Signed by year:2000: $0; 2001: $28,358; 2002: $36,943; 2003: $4,933; 2004: $0; 2005: $6,894; 2006: $0.
Biggest contracts:
$28,358 with Army for Household and Commercial Utility Containers. Taking place in KS. Signed on 2001-05-15. Completion date: 2001-06-01.
$26,768 with Navy for Household and Commercial Utility Containers. Taking place in CA. Signed on 2002-02-22. Completion date: 2002-03-27.
$9,932, same as above.Signed on 2002-05-29. Completion date: 2002-07-19.
$3,945 with Federal Supply Service for Household and Commercial Utility Containers. Signed on 2003-08-15. Completion date: 2003-09-15.
Top industries in this zip code by the number of employees in 2005:
Health Care and Social Assistance: Residential Mental Health and Substance Abuse Facilities (20-49 employees: 1 establishment)
Arts, Entertainment, and Recreation: Nature Parks and Other Similar Institutions (20-49: 1)
Construction: New Single-Family Housing Construction (except Operative Builders) (5-9: 2, 1-4: 3)
Construction: Site Preparation Contractors (10-19: 1, 1-4: 2)
Administrative and Support and Waste Management and Remediation Services: Janitorial Services (10-19: 1)
People in group quarters in 2010:
19 people in residential treatment centers for adults
People in group quarters in 2000:
14 people in homes or halfway houses for drug/alcohol abuse
Fatal accident statistics in 2013:
Fatal accident count: 1
Vehicles involved in fatal accidents: 1
Fatal accidents caused by drunken drivers: 1
Fatalities: 2
Persons involved in fatal accidents: 2
Pedestrians involved in fatal accidents: 0
Fatal accident statistics in 2012:
Fatal accident count: 1
Vehicles involved in fatal accidents: 1
Fatal accidents caused by drunken drivers: 1
Fatalities: 1
Persons involved in fatal accidents: 1
Pedestrians involved in fatal accidents: 0
Home Mortgage Disclosure Act Aggregated Statistics For Year 2009 (Based on 4 partial tracts)
A) FHA, FSA/RHS & VA Home Purchase Loans
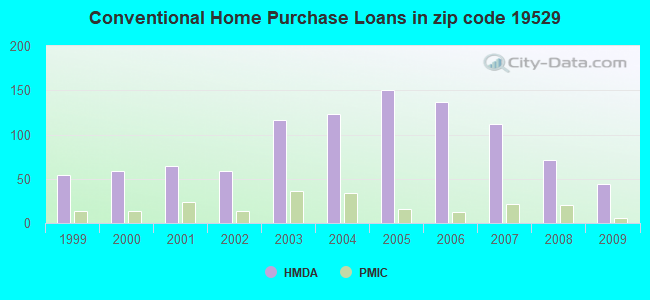
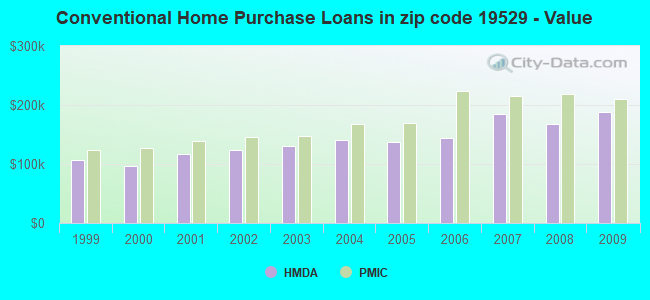
B) Conventional Home Purchase Loans
C) Refinancings
D) Home Improvement Loans
F) Non-occupant Loans on < 5 Family Dwellings (A B C & D)
G) Loans On Manufactured Home Dwelling (A B C & D)
Number
Average Value
Number
Average Value
Number
Average Value
Number
Average Value
Number
Average Value
Number
Average Value
LOANS ORIGINATED
22
$197,235
44
$188,787
233
$174,161
38
$74,717
8
$121,338
10
$69,303
APPLICATIONS APPROVED, NOT ACCEPTED
0
$0
4
$210,642
15
$181,583
3
$18,323
0
$0
0
$0
APPLICATIONS DENIED
3
$142,943
10
$89,471
83
$212,355
7
$62,406
3
$280,663
11
$66,554
APPLICATIONS WITHDRAWN
3
$142,657
2
$209,845
37
$201,472
4
$73,022
2
$136,050
1
$25,090
FILES CLOSED FOR INCOMPLETENESS
0
$0
0
$0
11
$171,452
0
$0
0
$0
1
$46,830
Aggregated Statistics For Year 2008 (Based on 4 partial tracts)
A) FHA, FSA/RHS & VA Home Purchase Loans
B) Conventional Home Purchase Loans
C) Refinancings
D) Home Improvement Loans
F) Non-occupant Loans on < 5 Family Dwellings (A B C & D)
G) Loans On Manufactured Home Dwelling (A B C & D)
Number
Average Value
Number
Average Value
Number
Average Value
Number
Average Value
Number
Average Value
Number
Average Value
LOANS ORIGINATED
17
$197,063
71
$167,591
156
$145,646
56
$50,722
11
$154,115
16
$59,596
APPLICATIONS APPROVED, NOT ACCEPTED
0
$0
8
$144,061
34
$148,941
7
$38,303
1
$60,210
6
$90,555
APPLICATIONS DENIED
6
$179,825
12
$124,489
86
$161,165
18
$36,069
2
$90,820
14
$73,939
APPLICATIONS WITHDRAWN
3
$160,293
4
$187,035
26
$189,232
3
$85,860
0
$0
3
$29,463
FILES CLOSED FOR INCOMPLETENESS
1
$141,320
3
$142,153
8
$170,182
0
$0
0
$0
0
$0
Aggregated Statistics For Year 2007 (Based on 4 partial tracts)
A) FHA, FSA/RHS & VA Home Purchase Loans
B) Conventional Home Purchase Loans
C) Refinancings
D) Home Improvement Loans
F) Non-occupant Loans on < 5 Family Dwellings (A B C & D)
G) Loans On Manufactured Home Dwelling (A B C & D)
Number
Average Value
Number
Average Value
Number
Average Value
Number
Average Value
Number
Average Value
Number
Average Value
LOANS ORIGINATED
5
$180,156
112
$184,683
176
$134,258
78
$56,462
13
$105,465
20
$63,067
APPLICATIONS APPROVED, NOT ACCEPTED
0
$0
13
$100,585
40
$151,752
10
$62,920
4
$173,240
8
$34,600
APPLICATIONS DENIED
0
$0
24
$118,546
101
$152,087
23
$77,418
4
$154,342
9
$40,903
APPLICATIONS WITHDRAWN
2
$183,370
12
$134,908
38
$165,990
7
$135,477
0
$0
0
$0
FILES CLOSED FOR INCOMPLETENESS
0
$0
4
$176,110
12
$227,649
0
$0
0
$0
0
$0
Aggregated Statistics For Year 2006 (Based on 4 partial tracts)
A) FHA, FSA/RHS & VA Home Purchase Loans
B) Conventional Home Purchase Loans
C) Refinancings
D) Home Improvement Loans
E) Loans on Dwellings For 5+ Families
F) Non-occupant Loans on < 5 Family Dwellings (A B C & D)
G) Loans On Manufactured Home Dwelling (A B C & D)
Number
Average Value
Number
Average Value
Number
Average Value
Number
Average Value
Number
Average Value
Number
Average Value
Number
Average Value
LOANS ORIGINATED
4
$153,275
137
$144,268
240
$130,005
81
$51,748
1
$237,490
13
$124,358
25
$66,036
APPLICATIONS APPROVED, NOT ACCEPTED
1
$167,200
15
$169,679
55
$150,652
10
$29,762
0
$0
1
$289,750
10
$54,352
APPLICATIONS DENIED
2
$169,505
17
$162,449
120
$152,696
29
$43,239
0
$0
2
$138,810
17
$40,903
APPLICATIONS WITHDRAWN
1
$114,560
7
$220,094
86
$150,975
8
$71,961
0
$0
3
$162,673
2
$68,735
FILES CLOSED FOR INCOMPLETENESS
0
$0
5
$165,984
17
$160,479
2
$135,130
0
$0
0
$0
0
$0
Aggregated Statistics For Year 2005 (Based on 4 partial tracts)
A) FHA, FSA/RHS & VA Home Purchase Loans
B) Conventional Home Purchase Loans
C) Refinancings
D) Home Improvement Loans
E) Loans on Dwellings For 5+ Families
F) Non-occupant Loans on < 5 Family Dwellings (A B C & D)
G) Loans On Manufactured Home Dwelling (A B C & D)
Number
Average Value
Number
Average Value
Number
Average Value
Number
Average Value
Number
Average Value
Number
Average Value
Number
Average Value
LOANS ORIGINATED
5
$157,214
150
$138,031
260
$122,960
77
$66,252
1
$84,560
13
$180,458
29
$64,868
APPLICATIONS APPROVED, NOT ACCEPTED
0
$0
23
$95,466
45
$109,045
6
$21,113
0
$0
1
$142,150
19
$69,663
APPLICATIONS DENIED
0
$0
37
$121,080
130
$130,569
29
$43,641
0
$0
6
$135,340
24
$56,386
APPLICATIONS WITHDRAWN
0
$0
19
$135,722
91
$132,158
11
$112,504
0
$0
3
$183,410
8
$90,555
FILES CLOSED FOR INCOMPLETENESS
0
$0
4
$154,072
32
$157,941
3
$54,440
0
$0
0
$0
0
$0
Aggregated Statistics For Year 2004 (Based on 4 partial tracts)
A) FHA, FSA/RHS & VA Home Purchase Loans
B) Conventional Home Purchase Loans
C) Refinancings
D) Home Improvement Loans
E) Loans on Dwellings For 5+ Families
F) Non-occupant Loans on < 5 Family Dwellings (A B C & D)
G) Loans On Manufactured Home Dwelling (A B C & D)
Number
Average Value
Number
Average Value
Number
Average Value
Number
Average Value
Number
Average Value
Number
Average Value
Number
Average Value
LOANS ORIGINATED
8
$132,584
123
$139,969
276
$115,263
60
$43,765
1
$431,740
17
$117,136
14
$59,716
APPLICATIONS APPROVED, NOT ACCEPTED
0
$0
18
$136,584
50
$131,205
11
$35,792
0
$0
1
$211,630
8
$65,305
APPLICATIONS DENIED
1
$257,210
22
$121,300
122
$123,202
27
$38,221
1
$188,150
2
$110,885
8
$52,630
APPLICATIONS WITHDRAWN
1
$111,240
9
$146,162
109
$147,798
6
$79,468
0
$0
1
$166,870
1
$128,880
FILES CLOSED FOR INCOMPLETENESS
0
$0
2
$83,620
21
$132,703
4
$34,450
0
$0
0
$0
0
$0
Aggregated Statistics For Year 2003 (Based on 4 partial tracts)
A) FHA, FSA/RHS & VA Home Purchase Loans
B) Conventional Home Purchase Loans
C) Refinancings
D) Home Improvement Loans
E) Loans on Dwellings For 5+ Families
F) Non-occupant Loans on < 5 Family Dwellings (A B C & D)
Number
Average Value
Number
Average Value
Number
Average Value
Number
Average Value
Number
Average Value
Number
Average Value
LOANS ORIGINATED
8
$140,869
116
$130,652
499
$117,491
39
$36,936
2
$77,350
16
$90,592
APPLICATIONS APPROVED, NOT ACCEPTED
0
$0
10
$82,709
68
$111,245
10
$32,708
0
$0
0
$0
APPLICATIONS DENIED
0
$0
13
$124,279
148
$111,436
16
$79,011
0
$0
3
$90,893
APPLICATIONS WITHDRAWN
1
$109,130
8
$154,915
92
$124,431
3
$14,803
0
$0
1
$47,030
FILES CLOSED FOR INCOMPLETENESS
0
$0
5
$122,894
12
$113,299
3
$20,347
0
$0
1
$81,110
Aggregated Statistics For Year 2002 (Based on 2 partial tracts)
A) FHA, FSA/RHS & VA Home Purchase Loans
B) Conventional Home Purchase Loans
C) Refinancings
D) Home Improvement Loans
F) Non-occupant Loans on < 5 Family Dwellings (A B C & D)
Number
Average Value
Number
Average Value
Number
Average Value
Number
Average Value
Number
Average Value
LOANS ORIGINATED
3
$96,443
59
$123,630
175
$110,517
23
$19,669
5
$52,012
APPLICATIONS APPROVED, NOT ACCEPTED
0
$0
14
$67,851
31
$86,533
5
$26,090
1
$41,810
APPLICATIONS DENIED
0
$0
26
$47,631
65
$127,887
7
$34,881
1
$58,530
APPLICATIONS WITHDRAWN
0
$0
9
$110,750
38
$113,635
0
$0
1
$105,360
FILES CLOSED FOR INCOMPLETENESS
0
$0
1
$250,860
12
$128,427
0
$0
0
$0
Aggregated Statistics For Year 2001 (Based on 2 partial tracts)
A) FHA, FSA/RHS & VA Home Purchase Loans
B) Conventional Home Purchase Loans
C) Refinancings
D) Home Improvement Loans
F) Non-occupant Loans on < 5 Family Dwellings (A B C & D)
Number
Average Value
Number
Average Value
Number
Average Value
Number
Average Value
Number
Average Value
LOANS ORIGINATED
5
$113,388
64
$117,303
127
$112,393
36
$31,776
4
$76,302
APPLICATIONS APPROVED, NOT ACCEPTED
0
$0
23
$69,259
20
$74,966
9
$25,922
1
$27,590
APPLICATIONS DENIED
1
$93,650
28
$50,471
54
$76,806
13
$24,314
1
$18,400
APPLICATIONS WITHDRAWN
0
$0
5
$112,720
23
$113,141
6
$28,013
0
$0
FILES CLOSED FOR INCOMPLETENESS
0
$0
1
$134,630
3
$95,607
0
$0
0
$0
Aggregated Statistics For Year 2000 (Based on 2 partial tracts)
A) FHA, FSA/RHS & VA Home Purchase Loans
B) Conventional Home Purchase Loans
C) Refinancings
D) Home Improvement Loans
F) Non-occupant Loans on < 5 Family Dwellings (A B C & D)
Number
Average Value
Number
Average Value
Number
Average Value
Number
Average Value
Number
Average Value
LOANS ORIGINATED
1
$96,160
59
$96,758
41
$83,987
36
$21,881
3
$42,367
APPLICATIONS APPROVED, NOT ACCEPTED
0
$0
8
$29,790
7
$61,520
10
$34,786
1
$45,990
APPLICATIONS DENIED
0
$0
22
$71,647
28
$80,753
10
$19,818
1
$175,600
APPLICATIONS WITHDRAWN
0
$0
3
$111,493
18
$85,478
5
$25,922
1
$66,900
FILES CLOSED FOR INCOMPLETENESS
0
$0
0
$0
8
$96,059
2
$15,470
0
$0
Aggregated Statistics For Year 1999 (Based on 3 partial tracts)
A) FHA, FSA/RHS & VA Home Purchase Loans
B) Conventional Home Purchase Loans
C) Refinancings
D) Home Improvement Loans
F) Non-occupant Loans on < 5 Family Dwellings (A B C & D)
Detailed PMIC statistics for the following Tracts:0053.00
, 0139.00
2004 - 2018 National Fire Incident Reporting System (NFIRS) incidents
Based on the data from the years 2004 - 2018 the average number of fires per year is 9. The highest number of reported fire incidents - 25 took place in 2006, and the least - 0 in 2011. The data has an increasing trend.
When looking into fire subcategories, the most incidents belonged to: Structure Fires (60.6%), and Outside Fires (22.0%).
Fire incident types reported to NFIRS in Zip Code 19529

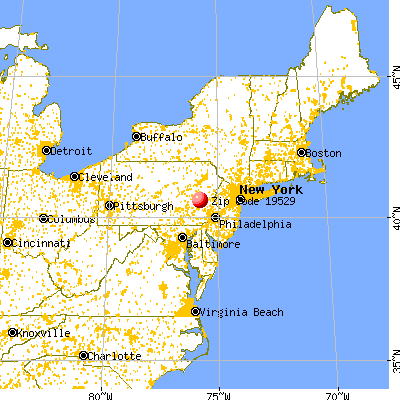


 Nearest zip codes: 19534, 17960, 19564, 18211, 19530, 18066.


 Based on the data from the years 2004 - 2018 the average number of fires per year is 9. The highest number of reported fire incidents - 25 took place in 2006, and the least - 0 in 2011. The data has an increasing trend.
 When looking into fire subcategories, the most incidents belonged to: Structure Fires (60.6%), and Outside Fires (22.0%).