Estimated zip code population in 2022: 4,543 Zip code population in 2010: 4,403 Zip code population in 2000: 3,561
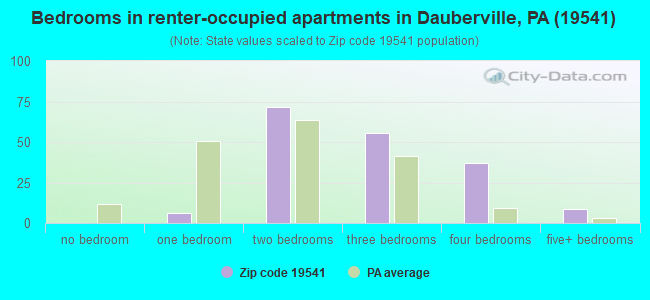
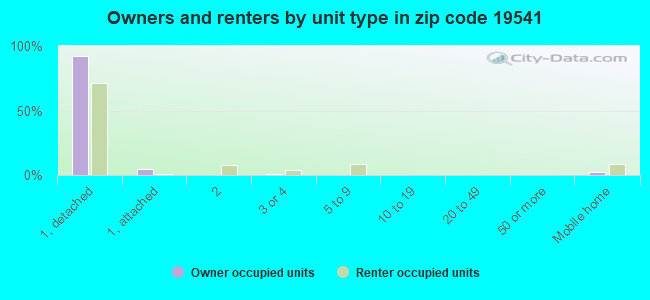
Houses and condos: 1,740 Renter-occupied apartments: 184
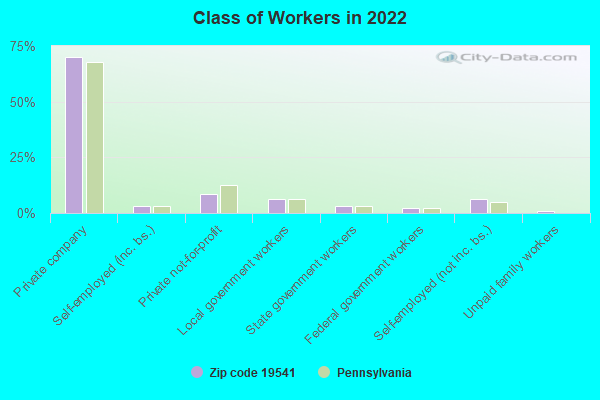
% of renters here:
11%
State:
31%
March 2022 cost of living index in zip code 19541: 93.6 (less than average, U.S. average is 100)
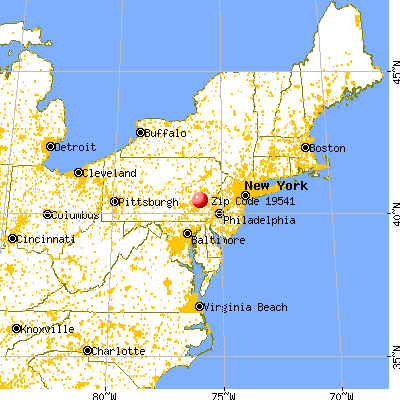
Land area: 22.4 sq. mi. Water area: 0.1 sq. mi.
Population density: 203 people per square mile
(very low).
OSM Map
General Map
Google Map
MSN Map
OSM Map
General Map
Google Map
MSN Map
OSM Map
General Map
Google Map
MSN Map
OSM Map
General Map
Google Map
MSN Map
Please wait while loading the map...
Real estate property taxes paid for housing units in 2022:
This zip code:
1.4% ($4,132)
Pennsylvania:
1.3% ($3,094)
Median real estate property taxes paid for housing units with mortgages in 2022: $4,181 (1.4%) Median real estate property taxes paid for housing units with no mortgage in 2022: $4,059 (1.5%)
Business Search- 14 Million verified businesses
Males: 2,143
(47.2%)
Females: 2,400
(52.8%)
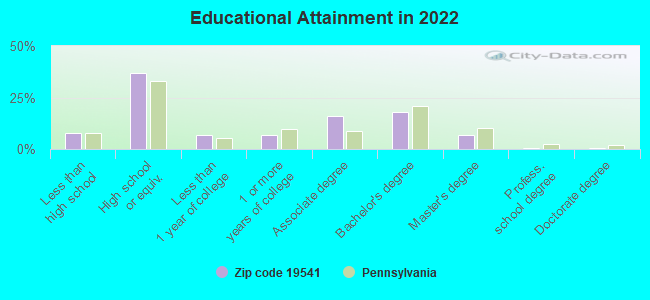
For population 25 years and over in 19541:
High school or higher: 92.4%
Bachelor's degree or higher: 25.8%
Graduate or professional degree: 8.0%
Unemployed: 3.1%
Mean travel time to work (commute): 26.9 minutes
For population 15 years and over in 19541:
Never married: 27.3%
Now married: 61.9%
Separated: 1.0%
Widowed: 4.1%
Divorced: 5.7%
Zip code 19541 compared to state average:
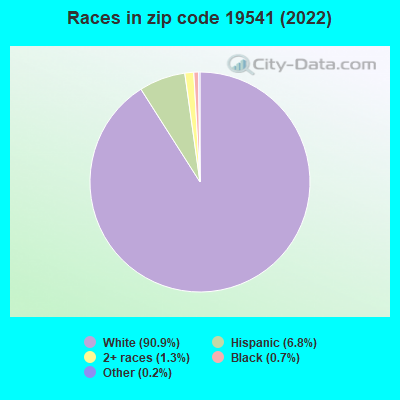
Black race population percentage significantly below state average.
Median age above state average.
Foreign-born population percentage significantly below state average.
Renting percentage significantly below state average.
Length of stay since moving in above state average.
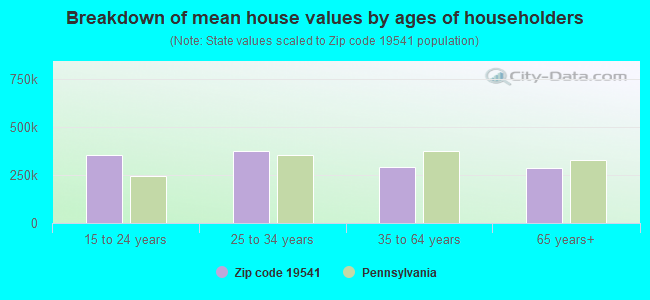
Estimated median house/condo value in 2022: $291,518
19541:
$291,518
Pennsylvania:
$245,500
According to our research of Pennsylvania and other state lists, there were 4 registered sex offenders living in 19541 zip code as of May 20, 2024. The ratio of all residents to sex offenders in zip code 19541 is 1,049 to 1. The ratio of registered sex offenders to all residents in this zip code is lower than the state average.
Median resident age:
This zip code:
46.3 years
Pennsylvania median age:
40.9 years
Average household size:
This zip code:
2.7 people
Pennsylvania:
2.4 people
Averages for the 2020 tax year for zip code 19541, filed in 2021:
Average Adjusted Gross Income (AGI) in 2020: $75,504 (Individual Income Tax Returns)
Here:
$75,504
State:
$75,707
Salary/wage: $66,041 (reported on 82.0% of returns)
Here:
$66,041
State:
$62,806
(% of AGI for various income ranges: 1006.5% for AGIs below $25k, 3504.0% for AGIs $25k-50k, 5980.4% for AGIs $50k-75k, 8487.1% for AGIs $75k-100k, 17418.1% for AGIs $100k-200k, 61326.7% for AGIs over 200k)
Taxable interest for individuals: $1,220 (reported on 36.0% of returns)
This zip code:
$1,220
Pennsylvania:
$1,633
(% of AGI for various income ranges: 37.6% for AGIs below $25k, 27.4% for AGIs $25k-50k, 23.8% for AGIs $50k-75k, 34.8% for AGIs $75k-100k, 71.2% for AGIs $100k-200k, 1340.0% for AGIs over 200k)
Ordinary dividends: $2,456 (reported on 23.7% of returns)
Here:
$2,456
State:
$7,382
(% of AGI for various income ranges: 51.1% for AGIs below $25k, 43.1% for AGIs $25k-50k, 64.2% for AGIs $50k-75k, 122.4% for AGIs $75k-100k, 85.6% for AGIs $100k-200k, 960.0% for AGIs over 200k)
Net capital gain/loss in AGI: +$7,328 (reported on 18.9% of returns)
Here:
+$7,328
State:
+$23,522
(% of AGI for various income ranges: 14.9% for AGIs below $25k, 80.9% for AGIs $25k-50k, 84.6% for AGIs $50k-75k, 151.0% for AGIs $75k-100k, 170.3% for AGIs $100k-200k, 5770.0% for AGIs over 200k)
Profit/loss from business: +$12,452 (reported on 11.8% of returns)
Here:
+$12,452
State:
+$16,274
(% of AGI for various income ranges: 81.6% for AGIs below $25k, 156.3% for AGIs $25k-50k, 218.8% for AGIs $50k-75k, 178.1% for AGIs $75k-100k, 490.6% for AGIs $100k-200k)
Taxable individual retirement arrangement distribution: $18,488 (reported on 14.0% of returns)
19541:
$18,488
Pennsylvania:
$18,583
(% of AGI for various income ranges: 127.8% for AGIs below $25k, 210.6% for AGIs $25k-50k, 285.0% for AGIs $50k-75k, 415.2% for AGIs $75k-100k, 966.6% for AGIs $100k-200k)
Total itemized deductions: $25,021 (reported on 6.1% of returns)
Here:
$25,021
State:
$34,850
(% of AGI for various income ranges: 280.0% for AGIs $50k-75k, 311.4% for AGIs $75k-100k, 356.9% for AGIs $100k-200k, 3263.3% for AGIs over 200k)
Charity contributions: $10,690 (reported on 4.4% of returns)
Here:
$10,690
State:
$12,392
(% of AGI for various income ranges: 114.8% for AGIs $75k-100k, 120.6% for AGIs $100k-200k, 1473.3% for AGIs over 200k)
Taxes paid: $7,764 (reported on 6.1% of returns)
19541:
$7,764
State:
$8,200
(% of AGI for various income ranges: 81.9% for AGIs $50k-75k, 106.7% for AGIs $75k-100k, 125.0% for AGIs $100k-200k, 833.3% for AGIs over 200k)
Earned income credit: $1,720 (reported on 6.6% of returns)
Here:
$1,720
State:
$2,100
(% of AGI for various income ranges: 38.6% for AGIs below $25k, 32.9% for AGIs $25k-50k)
Percentage of individuals using paid preparers for their 2020 taxes: 93.4%
Here:
93%
State:
92%
(% for various income ranges: 90.0% for AGIs below $25k, 95.6% for AGIs $25k-50k, 97.1% for AGIs $50k-75k, 93.1% for AGIs $75k-100k, 94.0% for AGIs $100k-200k, 88.9% for AGIs over 200k)
Averages for the 2012 tax year for zip code 19541, filed in 2013:
Average Adjusted Gross Income (AGI) in 2012: $61,280 (Individual Income Tax Returns)
Here:
$61,280
State:
$61,346
Salary/wage: $56,696 (reported on 85.4% of returns)
Here:
$56,696
State:
$51,902
(% of AGI for various income ranges: 67.8% for AGIs below $25k, 76.9% for AGIs $25k-50k, 79.3% for AGIs $50k-75k, 81.5% for AGIs $75k-100k, 86.9% for AGIs $100k-200k, 61.6% for AGIs over 200k)
Taxable interest for individuals: $874 (reported on 46.0% of returns)
This zip code:
$874
Pennsylvania:
$1,588
(% of AGI for various income ranges: 2.3% for AGIs below $25k, 1.0% for AGIs $25k-50k, 0.9% for AGIs $50k-75k, 0.2% for AGIs $75k-100k, 0.2% for AGIs $100k-200k, 1.2% for AGIs over 200k)
Ordinary dividends: $1,600 (reported on 26.3% of returns)
Here:
$1,600
State:
$5,827
(% of AGI for various income ranges: 2.3% for AGIs below $25k, 0.8% for AGIs $25k-50k, 0.8% for AGIs $50k-75k, 0.3% for AGIs $75k-100k, 0.3% for AGIs $100k-200k, 1.5% for AGIs over 200k)
Net capital gain/loss in AGI: +$3,642 (reported on 17.8% of returns)
Here:
+$3,642
State:
+$14,495
(% of AGI for various income ranges: 1.0% for AGIs below $25k, 0.2% for AGIs $50k-75k, 0.2% for AGIs $75k-100k, 0.3% for AGIs $100k-200k, 6.4% for AGIs over 200k)
Profit/loss from business: +$10,904 (reported on 12.2% of returns)
Here:
+$10,904
State:
+$16,268
(% of AGI for various income ranges: 6.0% for AGIs below $25k, 1.6% for AGIs $25k-50k, 2.0% for AGIs $50k-75k, 2.2% for AGIs $75k-100k, 2.7% for AGIs $100k-200k)
Taxable individual retirement arrangement distribution: $10,972 (reported on 13.6% of returns)
19541:
$10,972
Pennsylvania:
$14,550
(% of AGI for various income ranges: 6.7% for AGIs below $25k, 3.7% for AGIs $25k-50k, 2.7% for AGIs $50k-75k, 2.6% for AGIs $75k-100k, 2.0% for AGIs $100k-200k)
Total itemized deductions: $20,331 (21% of AGI, reported on 42.7% of returns)
Here:
$20,331
State:
$23,538
Here:
20.6% of AGI
State:
18.4% of AGI
(% of AGI for various income ranges: 10.0% for AGIs below $25k, 10.3% for AGIs $25k-50k, 13.9% for AGIs $50k-75k, 15.2% for AGIs $75k-100k, 15.7% for AGIs $100k-200k, 14.2% for AGIs over 200k)
Charity contributions: $2,626 (reported on 32.9% of returns)
Here:
$2,626
State:
$4,025
(% of AGI for various income ranges: 0.6% for AGIs below $25k, 1.1% for AGIs $25k-50k, 1.4% for AGIs $50k-75k, 1.3% for AGIs $75k-100k, 1.6% for AGIs $100k-200k, 1.7% for AGIs over 200k)
Taxes paid: $9,044 (reported on 42.3% of returns)
19541:
$9,044
State:
$9,982
(% of AGI for various income ranges: 2.8% for AGIs below $25k, 3.6% for AGIs $25k-50k, 5.6% for AGIs $50k-75k, 6.3% for AGIs $75k-100k, 7.3% for AGIs $100k-200k, 7.9% for AGIs over 200k)
Earned income credit: $1,853 (reported on 7.0% of returns)
Here:
$1,853
State:
$2,106
(% of AGI for various income ranges: 2.8% for AGIs below $25k, 0.5% for AGIs $25k-50k)
Percentage of individuals using paid preparers for their 2012 taxes: 53.1%
Here:
53%
State:
53%
(% for various income ranges: 46.3% for AGIs below $25k, 53.7% for AGIs $25k-50k, 58.8% for AGIs $50k-75k, 53.1% for AGIs $75k-100k, 55.9% for AGIs $100k-200k, 80.0% for AGIs over 200k)
Averages for the 2004 tax year for zip code 19541, filed in 2005:
Average Adjusted Gross Income (AGI) in 2004: $49,852 (Individual Income Tax Returns)
Here:
$49,852
State:
$48,049
Salary/wage: $47,688 (reported on 87.4% of returns)
Here:
$47,688
State:
$42,646
(% of AGI for various income ranges: 113.1% for AGIs below $10k, 70.0% for AGIs $10k-25k, 82.2% for AGIs $25k-50k, 87.6% for AGIs $50k-75k, 91.2% for AGIs $75k-100k, 75.9% for AGIs over 100k)
Taxable interest for individuals: $805 (reported on 57.9% of returns)
This zip code:
$805
Pennsylvania:
$1,657
(% of AGI for various income ranges: 6.8% for AGIs below $10k, 4.0% for AGIs $10k-25k, 0.9% for AGIs $25k-50k, 0.8% for AGIs $50k-75k, 0.2% for AGIs $75k-100k, 0.8% for AGIs over 100k)
Taxable dividends: $1,172 (reported on 31.0% of returns)
Here:
$1,172
State:
$3,566
(% of AGI for various income ranges: 3.0% for AGIs below $10k, 2.1% for AGIs $10k-25k, 1.1% for AGIs $25k-50k, 0.3% for AGIs $50k-75k, 0.2% for AGIs $75k-100k, 0.9% for AGIs over 100k)
Net capital gain/loss: +$4,846 (reported on 20.5% of returns)
Here:
+$4,846
State:
+$9,716
(% of AGI for various income ranges: -1.8% for AGIs below $10k, -0.7% for AGIs $10k-25k, 0.6% for AGIs $25k-50k, 0.8% for AGIs $50k-75k, 0.2% for AGIs $75k-100k, 6.3% for AGIs over 100k)
Profit/loss from business: +$9,348 (reported on 12.7% of returns)
Here:
+$9,348
State:
+$14,267
(% of AGI for various income ranges: 2.7% for AGIs below $10k, 4.5% for AGIs $10k-25k, 2.0% for AGIs $25k-50k, 2.6% for AGIs $50k-75k, 2.0% for AGIs $75k-100k, 2.3% for AGIs over 100k)
IRA payment deduction: $2,881 (reported on 3.0% of returns)
19541:
$2,881
Pennsylvania:
$2,903
(% of AGI for various income ranges: 2.5% for AGIs below $10k, 0.3% for AGIs $25k-50k, 0.2% for AGIs $50k-75k, 0.2% for AGIs $75k-100k)
Total itemized deductions: $16,506 (21% of AGI, reported on 44.8% of returns)
Here:
$16,506
State:
$18,804
Here:
21.0% of AGI
State:
19.5% of AGI
(% of AGI for various income ranges: 12.7% for AGIs $10k-25k, 12.2% for AGIs $25k-50k, 16.0% for AGIs $50k-75k, 17.3% for AGIs $75k-100k, 14.1% for AGIs over 100k)
Charity contributions deductions: $2,258 (3% of AGI, reported on 38.5% of returns)
Here:
$2,258
State:
$3,337
Here:
2.8% of AGI
State:
3.3% of AGI
(% of AGI for various income ranges: 1.2% for AGIs $10k-25k, 1.4% for AGIs $25k-50k, 1.7% for AGIs $50k-75k, 1.6% for AGIs $75k-100k, 2.4% for AGIs over 100k)
Total tax: $6,335 (reported on 81.1% of returns)
19541:
$6,335
State:
$8,008
(% of AGI for various income ranges: 2.6% for AGIs below $10k, 4.6% for AGIs $10k-25k, 7.5% for AGIs $25k-50k, 8.1% for AGIs $50k-75k, 9.8% for AGIs $75k-100k, 16.0% for AGIs over 100k)
Earned income credit: $1,528 (reported on 6.4% of returns)
Here:
$1,528
State:
$1,643
Percentage of individuals using paid preparers for their 2004 taxes: 56.2%
Here:
56%
State:
56%
(% for various income ranges: 46.6% for AGIs below $10k, 56.0% for AGIs $10k-25k, 58.3% for AGIs $25k-50k, 59.7% for AGIs $50k-75k, 54.8% for AGIs $75k-100k, 64.5% for AGIs over 100k)
Household received Food Stamps/SNAP in the past 12 months: 19 Household did not receive Food Stamps/SNAP in the past 12 months: 1,651
Women who had a birth in the past 12 months: 27 (29 now married, 0 unmarried) Women who did not have a birth in the past 12 months: 1,012 (477 now married, 532 unmarried)
Housing units in zip code 19541 with a mortgage: 874 (160 second mortgage, 10 home equity loan, 150 both second mortgage and home equity loan) Houses without a mortgage: 47
Median monthly owner costs for units with a mortgage: $1,737 Median monthly owner costs for units without a mortgage: $674
Residents with income below the poverty level in 2022:
This zip code:
5.0%
Whole state:
11.8%
Residents with income below 50% of the poverty level in 2022:
This zip code:
2.9%
Whole state:
6.1%
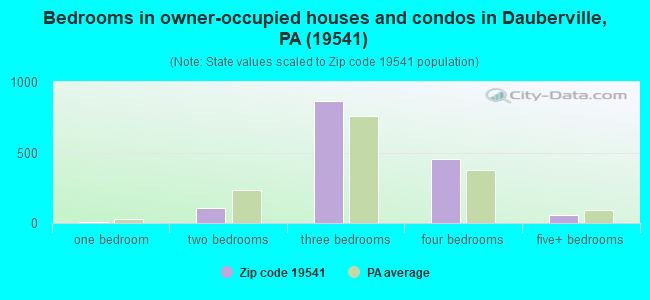
Median number of rooms in houses and condos:
Here:
6.9
State:
6.8
Median number of rooms in apartments:
Here:
5.9
State:
4.3
Notable locations in this zip code not listed on our city pages
Size of family households: 573 2-persons, 405 3-persons, 199 4-persons, 89 5-persons, 17 6-persons, 16 7-or-more-persons
Size of nonfamily households: 258 1-person, 80 2-persons, 32 3-persons
733 married couples with children.
66 single-parent households (11 men, 55 women).
95.6% of residents of 19541 zip code speak English at home.
2.3% of residents speak Spanish at home (93% very well, 4% well, 3% not well).
1.4% of residents speak other Indo-European language at home (85% very well, 15% well).
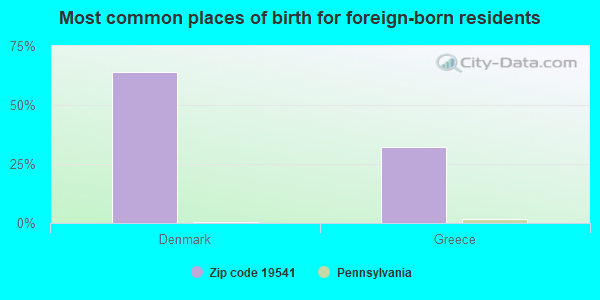
Foreign born population: 26 (0.6%) (100.0% of them are naturalized citizens)
This zip code:
0.6%
Whole state:
7.5%
64%Denmark
32%Greece
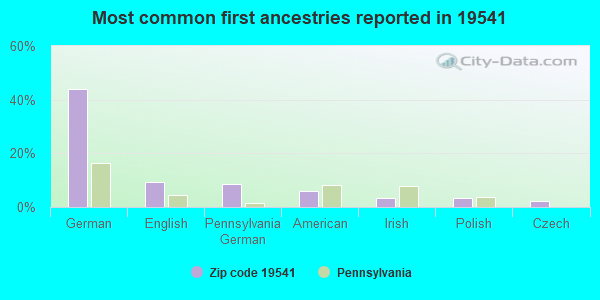
44%German
9%English
8%Pennsylvania German
6%American
4%Irish
3%Polish
2%Czech
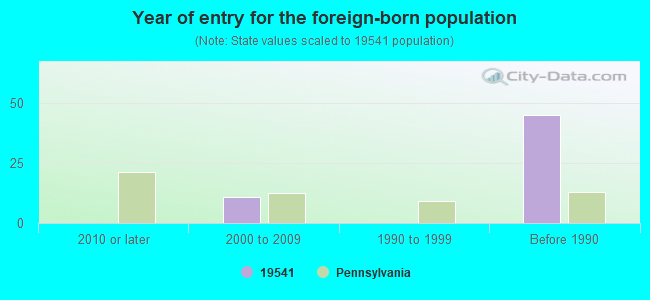
Year of entry for the foreign-born population
02010 or later
112000 to 2009
01990 to 1999
45Before 1990
Facilities with environmental interests located in this zip code:
BULK CHEM MFG (MOHRSVILLE ROAD OLD ROUTE 61 in MOHRSVILLE, PA)
STATE MASTER (Pennsylvania database) - RCRIS-PAD069799922, HAZARDOUS WASTE PROGRAM, RESIDUAL WASTE National Pollutant Discharge Elimination System NON-MAJOR (Tracking pollutant discharge elimination systems) - permit HAZARDOUS WASTE BIENNIAL REPORTER (Resource Conservation and Recovery Act (tracking hazardous waste)) Large Quantity Generators, more that 1000 kg of hazardous waste/month (Resource Conservation and Recovery Act (tracking hazardous waste)) - notification TRI REPORTER (Tracking of toxic chemicals releasing facilities) Business SIC classification: CHEMICALS AND CHEMICAL PREPARATIONS Organizations: OPERNAME (CONTACT/OPERATOR)
, SATORIS III PERCY A (CONTACT/OWNER)
Alternative names: BULK CHEMICAL
Housing units lacking complete kitchen facilities: 1.1%
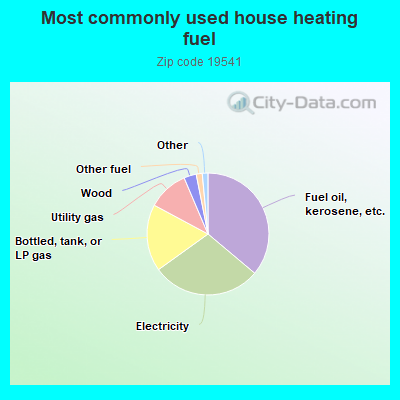
36.2%Fuel oil, kerosene, etc.
29.0%Electricity
17.8%Bottled, tank, or LP gas
10.8%Utility gas
3.3%Wood
1.6%Other fuel
1.0%Coal or coke
0.5%No fuel used
Population in 1990: 3,473. Population change in the 1990s: +88 (+2.5%).
Place of birth for U.S.-born residents:
This state: 3,912
Northeast: 295
Midwest: 59
South: 102
West: 83
62% of the 19541 zip code residents lived in the same house 5 years ago. Out of people who lived in different houses, 83% lived in this county. Out of people who lived in different counties, 50% lived in Pennsylvania.
94% of the 19541 zip code residents lived in the same house 1 year ago. Out of people who lived in different houses, 61% moved from this county. Out of people who lived in different houses, 34% moved from different county within same state. Out of people who lived in different houses, 6% moved from different state.
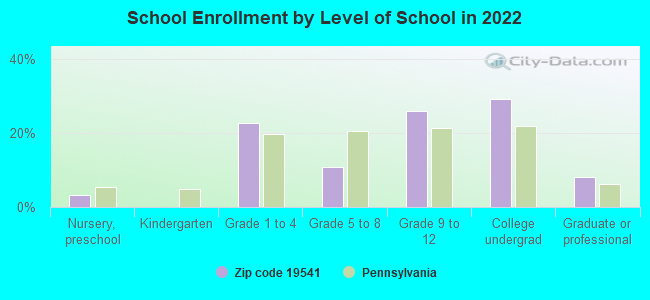
Private vs. public school enrollment:
Students in private schools in grades 1 to 8 (elementary and middle school): 36
Here:
9.7%
Pennsylvania:
15.7%
Students in private schools in grades 9 to 12 (high school): 50
Here:
16.9%
Pennsylvania:
13.4%
Students in private undergraduate colleges: 19
Here:
6.0%
Pennsylvania:
39.8%
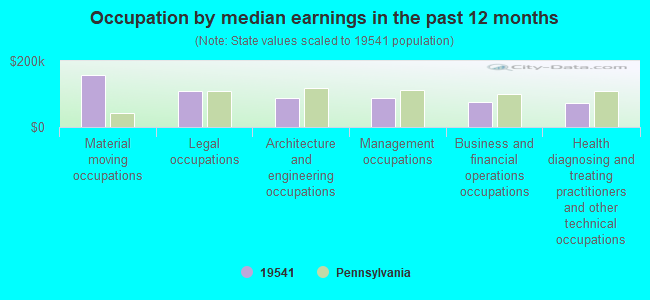
Occupation by median earnings in the past 12 months ($)
158,769Material moving occupations
108,957Legal occupations
88,745Architecture and engineering occupations
88,573Management occupations
75,588Business and financial operations occupations
73,228Health diagnosing and treating practitioners and other technical occupations
Companies with federal contracts located in this zip code:
J M FENCE AND DECK CO (2209 SHARTLESVILLE RD in MOHRSVILLE, PA; small business)
$8,796 with Navy for Maintenance, Repair or Alteration of Real Property -- Miscellaneous Buildings. Signed on 2003-09-18. Completion date: 2003-11-30.
Top industries in this zip code by the number of employees in 2005:
Construction: Water and Sewer Line and Related Structures Construction (20-49 employees: 1 establishment)
Other Services (except Public Administration): Car Washes (10-19: 1, 1-4: 2)
Construction: Framing Contractors (10-19: 1)
Other Services (except Public Administration): Religious Organizations (5-9: 1, 1-4: 2)
Finance and Insurance: Commercial Banking (5-9: 1)
Accommodation and Food Services: Full-Service Restaurants (5-9: 1)
Construction: Residential Remodelers (1-4: 2)
Fatal accident statistics in 2012:
Fatal accident count: 1
Vehicles involved in fatal accidents: 1
Fatal accidents caused by drunken drivers: 1
Fatalities: 1
Persons involved in fatal accidents: 1
Pedestrians involved in fatal accidents: 0
Fatal accident statistics in 2011:
Fatal accident count: 1
Vehicles involved in fatal accidents: 2
Fatal accidents caused by drunken drivers: 0
Fatalities: 1
Persons involved in fatal accidents: 3
Pedestrians involved in fatal accidents: 0
Home Mortgage Disclosure Act Aggregated Statistics For Year 2009 (Based on 2 partial tracts)
A) FHA, FSA/RHS & VA Home Purchase Loans
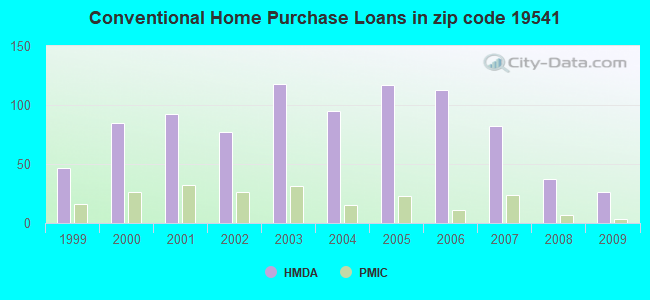
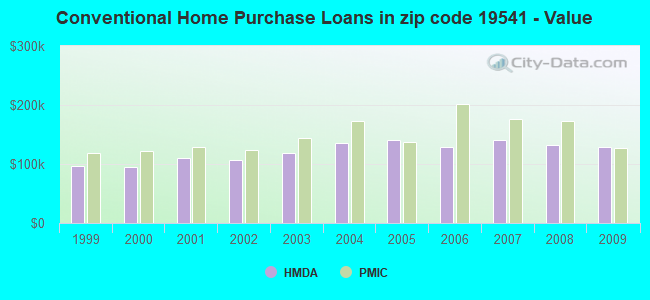
B) Conventional Home Purchase Loans
C) Refinancings
D) Home Improvement Loans
F) Non-occupant Loans on < 5 Family Dwellings (A B C & D)
G) Loans On Manufactured Home Dwelling (A B C & D)
Number
Average Value
Number
Average Value
Number
Average Value
Number
Average Value
Number
Average Value
Number
Average Value
LOANS ORIGINATED
21
$176,599
26
$128,710
168
$154,810
23
$47,549
2
$98,360
6
$42,987
APPLICATIONS APPROVED, NOT ACCEPTED
1
$97,630
2
$107,470
13
$138,995
1
$18,940
0
$0
1
$58,290
APPLICATIONS DENIED
2
$226,230
11
$71,734
55
$172,956
9
$100,790
3
$185,793
8
$55,465
APPLICATIONS WITHDRAWN
4
$192,168
2
$153,005
23
$144,706
4
$143,718
0
$0
0
$0
FILES CLOSED FOR INCOMPLETENESS
1
$381,790
3
$92,290
7
$127,713
1
$130,420
0
$0
2
$43,350
Aggregated Statistics For Year 2008 (Based on 2 partial tracts)
A) FHA, FSA/RHS & VA Home Purchase Loans
B) Conventional Home Purchase Loans
C) Refinancings
D) Home Improvement Loans
E) Loans on Dwellings For 5+ Families
F) Non-occupant Loans on < 5 Family Dwellings (A B C & D)
G) Loans On Manufactured Home Dwelling (A B C & D)
Number
Average Value
Number
Average Value
Number
Average Value
Number
Average Value
Number
Average Value
Number
Average Value
Number
Average Value
LOANS ORIGINATED
9
$182,879
37
$131,680
126
$129,621
34
$41,059
1
$326,410
7
$112,933
11
$47,690
APPLICATIONS APPROVED, NOT ACCEPTED
2
$165,030
4
$170,128
28
$135,077
3
$86,217
0
$0
0
$0
2
$82,330
APPLICATIONS DENIED
1
$185,060
7
$121,571
66
$165,646
18
$104,635
0
$0
1
$174,860
7
$61,514
APPLICATIONS WITHDRAWN
1
$115,120
3
$188,220
26
$162,198
7
$116,576
0
$0
1
$15,300
1
$139,160
FILES CLOSED FOR INCOMPLETENESS
0
$0
0
$0
9
$154,382
1
$51,000
0
$0
0
$0
0
$0
Aggregated Statistics For Year 2007 (Based on 2 partial tracts)
A) FHA, FSA/RHS & VA Home Purchase Loans
B) Conventional Home Purchase Loans
C) Refinancings
D) Home Improvement Loans
E) Loans on Dwellings For 5+ Families
F) Non-occupant Loans on < 5 Family Dwellings (A B C & D)
G) Loans On Manufactured Home Dwelling (A B C & D)
Number
Average Value
Number
Average Value
Number
Average Value
Number
Average Value
Number
Average Value
Number
Average Value
Number
Average Value
LOANS ORIGINATED
4
$164,300
82
$141,197
138
$127,975
49
$39,315
1
$370,130
12
$99,575
18
$55,090
APPLICATIONS APPROVED, NOT ACCEPTED
0
$0
16
$125,319
29
$138,409
11
$30,469
0
$0
4
$66,668
7
$36,221
APPLICATIONS DENIED
1
$252,820
20
$130,602
92
$161,139
33
$51,819
0
$0
5
$239,126
20
$48,234
APPLICATIONS WITHDRAWN
1
$110,750
6
$127,262
41
$190,093
7
$80,770
0
$0
1
$498,360
2
$79,780
FILES CLOSED FOR INCOMPLETENESS
0
$0
1
$110,020
13
$184,728
1
$43,720
0
$0
1
$46,630
0
$0
Aggregated Statistics For Year 2006 (Based on 2 partial tracts)
A) FHA, FSA/RHS & VA Home Purchase Loans
B) Conventional Home Purchase Loans
C) Refinancings
D) Home Improvement Loans
E) Loans on Dwellings For 5+ Families
F) Non-occupant Loans on < 5 Family Dwellings (A B C & D)
G) Loans On Manufactured Home Dwelling (A B C & D)
Number
Average Value
Number
Average Value
Number
Average Value
Number
Average Value
Number
Average Value
Number
Average Value
Number
Average Value
LOANS ORIGINATED
4
$159,745
113
$129,201
190
$109,486
41
$49,172
1
$58,290
10
$108,853
27
$50,193
APPLICATIONS APPROVED, NOT ACCEPTED
0
$0
12
$89,739
25
$143,097
5
$49,544
1
$167,580
0
$0
7
$52,667
APPLICATIONS DENIED
1
$97,630
20
$100,182
101
$144,602
20
$61,712
1
$183,610
1
$53,190
12
$60,778
APPLICATIONS WITHDRAWN
0
$0
7
$127,713
70
$158,658
5
$67,906
0
$0
0
$0
2
$99,455
FILES CLOSED FOR INCOMPLETENESS
0
$0
2
$205,465
9
$188,222
1
$136,980
0
$0
0
$0
0
$0
Aggregated Statistics For Year 2005 (Based on 2 partial tracts)
A) FHA, FSA/RHS & VA Home Purchase Loans
B) Conventional Home Purchase Loans
C) Refinancings
D) Home Improvement Loans
F) Non-occupant Loans on < 5 Family Dwellings (A B C & D)
G) Loans On Manufactured Home Dwelling (A B C & D)
Number
Average Value
Number
Average Value
Number
Average Value
Number
Average Value
Number
Average Value
Number
Average Value
LOANS ORIGINATED
2
$125,320
117
$141,143
184
$117,677
46
$41,150
8
$105,100
19
$39,805
APPLICATIONS APPROVED, NOT ACCEPTED
0
$0
17
$125,791
33
$129,912
1
$30,600
1
$101,280
9
$58,450
APPLICATIONS DENIED
1
$89,620
29
$84,920
105
$124,625
36
$32,443
4
$58,470
33
$45,372
APPLICATIONS WITHDRAWN
1
$123,130
10
$154,317
82
$139,171
12
$134,244
1
$84,520
1
$241,170
FILES CLOSED FOR INCOMPLETENESS
0
$0
7
$126,569
8
$126,321
2
$37,160
1
$254,280
0
$0
Aggregated Statistics For Year 2004 (Based on 2 partial tracts)
A) FHA, FSA/RHS & VA Home Purchase Loans
B) Conventional Home Purchase Loans
C) Refinancings
D) Home Improvement Loans
F) Non-occupant Loans on < 5 Family Dwellings (A B C & D)
G) Loans On Manufactured Home Dwelling (A B C & D)
Number
Average Value
Number
Average Value
Number
Average Value
Number
Average Value
Number
Average Value
Number
Average Value
LOANS ORIGINATED
0
$0
95
$135,811
197
$97,222
43
$33,075
9
$82,251
12
$46,145
APPLICATIONS APPROVED, NOT ACCEPTED
0
$0
15
$103,364
42
$85,142
4
$37,522
1
$212,020
9
$38,778
APPLICATIONS DENIED
1
$79,420
20
$83,206
118
$113,334
29
$42,887
1
$88,890
23
$53,695
APPLICATIONS WITHDRAWN
0
$0
6
$114,147
72
$126,614
2
$67,030
0
$0
1
$75,050
FILES CLOSED FOR INCOMPLETENESS
0
$0
2
$108,925
21
$139,752
3
$37,643
1
$45,900
0
$0
Aggregated Statistics For Year 2003 (Based on 2 partial tracts)
A) FHA, FSA/RHS & VA Home Purchase Loans
B) Conventional Home Purchase Loans
C) Refinancings
D) Home Improvement Loans
E) Loans on Dwellings For 5+ Families
F) Non-occupant Loans on < 5 Family Dwellings (A B C & D)
Number
Average Value
Number
Average Value
Number
Average Value
Number
Average Value
Number
Average Value
Number
Average Value
LOANS ORIGINATED
5
$133,770
118
$118,947
313
$108,361
28
$22,196
1
$78,690
9
$68,569
APPLICATIONS APPROVED, NOT ACCEPTED
0
$0
15
$91,609
62
$98,960
4
$22,770
0
$0
2
$91,075
APPLICATIONS DENIED
0
$0
20
$82,988
123
$110,285
12
$24,954
0
$0
1
$62,660
APPLICATIONS WITHDRAWN
1
$118,030
10
$126,412
57
$122,251
5
$30,018
0
$0
1
$99,090
FILES CLOSED FOR INCOMPLETENESS
0
$0
4
$119,308
7
$112,309
0
$0
0
$0
0
$0
Aggregated Statistics For Year 2002 (Based on 2 partial tracts)
A) FHA, FSA/RHS & VA Home Purchase Loans
B) Conventional Home Purchase Loans
C) Refinancings
D) Home Improvement Loans
F) Non-occupant Loans on < 5 Family Dwellings (A B C & D)
Number
Average Value
Number
Average Value
Number
Average Value
Number
Average Value
Number
Average Value
LOANS ORIGINATED
5
$123,570
77
$107,530
176
$108,942
25
$32,350
5
$93,990
APPLICATIONS APPROVED, NOT ACCEPTED
2
$123,135
15
$72,131
39
$94,942
9
$38,697
1
$116,580
APPLICATIONS DENIED
1
$31,330
13
$51,506
83
$97,132
9
$15,381
3
$89,617
APPLICATIONS WITHDRAWN
0
$0
6
$75,653
47
$110,065
1
$96,900
1
$79,420
FILES CLOSED FOR INCOMPLETENESS
0
$0
1
$155,920
7
$115,951
2
$125,320
0
$0
Aggregated Statistics For Year 2001 (Based on 2 partial tracts)
A) FHA, FSA/RHS & VA Home Purchase Loans
B) Conventional Home Purchase Loans
C) Refinancings
D) Home Improvement Loans
F) Non-occupant Loans on < 5 Family Dwellings (A B C & D)
Number
Average Value
Number
Average Value
Number
Average Value
Number
Average Value
Number
Average Value
LOANS ORIGINATED
5
$115,848
92
$109,369
160
$96,576
36
$39,628
7
$67,864
APPLICATIONS APPROVED, NOT ACCEPTED
1
$64,850
15
$59,891
27
$98,496
9
$22,020
2
$64,480
APPLICATIONS DENIED
0
$0
30
$53,164
73
$109,350
13
$18,663
1
$55,370
APPLICATIONS WITHDRAWN
0
$0
3
$104,920
31
$112,016
11
$51,797
0
$0
FILES CLOSED FOR INCOMPLETENESS
0
$0
0
$0
9
$140,377
0
$0
0
$0
Aggregated Statistics For Year 2000 (Based on 2 partial tracts)
A) FHA, FSA/RHS & VA Home Purchase Loans
B) Conventional Home Purchase Loans
C) Refinancings
D) Home Improvement Loans
F) Non-occupant Loans on < 5 Family Dwellings (A B C & D)
Number
Average Value
Number
Average Value
Number
Average Value
Number
Average Value
Number
Average Value
LOANS ORIGINATED
3
$86,217
85
$94,932
69
$84,264
26
$18,131
3
$38,130
APPLICATIONS APPROVED, NOT ACCEPTED
0
$0
12
$64,481
20
$73,078
12
$18,032
1
$49,540
APPLICATIONS DENIED
1
$72,860
47
$47,142
66
$74,836
11
$11,459
1
$72,860
APPLICATIONS WITHDRAWN
1
$83,060
9
$84,518
29
$80,749
4
$30,055
1
$68,490
FILES CLOSED FOR INCOMPLETENESS
0
$0
2
$116,575
3
$58,287
0
$0
1
$26,960
Aggregated Statistics For Year 1999 (Based on 1 partial tract)
A) FHA, FSA/RHS & VA Home Purchase Loans
B) Conventional Home Purchase Loans
C) Refinancings
D) Home Improvement Loans
F) Non-occupant Loans on < 5 Family Dwellings (A B C & D)
Detailed PMIC statistics for the following Tracts:0102.00
2003 - 2018 National Fire Incident Reporting System (NFIRS) incidents
According to the data from the years 2003 - 2018 the average number of fires per year is 12. The highest number of reported fire incidents - 36 took place in 2005, and the least - 0 in 2011. The data has a rising trend.
When looking into fire subcategories, the most reports belonged to: Structure Fires (54.0%), and Outside Fires (30.0%).
Fire incident types reported to NFIRS in Zip Code 19541


 Nearest zip codes: 19526, 19533, 19555, 19554, 19549, 19506.


 According to the data from the years 2003 - 2018 the average number of fires per year is 12. The highest number of reported fire incidents - 36 took place in 2005, and the least - 0 in 2011. The data has a rising trend.
 When looking into fire subcategories, the most reports belonged to: Structure Fires (54.0%), and Outside Fires (30.0%).