Estimated zip code population in 2022: 30,561
Zip code population in 2010: 27,658
Zip code population in 2000: 23,932
Houses and condos: 10,407
Renter-occupied apartments: 5,231
% of renters here:
54%State:
31%
March 2022 cost of living index in zip code 19604: 94.3
(less than average, U.S. average is 100)
Land area: 2.2
sq. mi.
Water area: 0.0
sq. mi.
Population density: 13,918 people per square mile (very high).
OSM Map
General Map
Google Map
MSN Map
OSM Map
General Map
Google Map
MSN Map
OSM Map
General Map
Google Map
MSN Map
OSM Map
General Map
Google Map
MSN Map
Please wait while loading the map...
Real estate property taxes paid for housing units in 2022:
This zip code:
1.7% ($1,902)Pennsylvania:
1.3% ($3,094)
Median real estate property taxes paid for housing units with mortgages in 2022: $2,264 (1.9%)
Median real estate property taxes paid for housing units with no mortgage in 2022: $1,576 (1.6%)
Profiles of local businesses
Business Search - 14 Million verified businesses
Males: 14,960 Females: 15,601
For population 25 years and over in 19604:
High school or higher: 68.3%Bachelor's degree or higher: 10.7%Graduate or professional degree: 4.5%Unemployed: 6.8%Mean travel time to work (commute): 24.2 minutes
For population 15 years and over in 19604:
Never married: 44.6%Now married: 37.9%Separated: 3.5%Widowed: 3.8%Divorced: 10.3%
Zip code 19604 compared to state average:
Median house value below state average. Hispanic race population percentage significantly above state average. Median age significantly below state average. Foreign-born population percentage significantly above state average. Renting percentage above state average. Length of stay since moving in above state average. House age above state average. Percentage of population with a bachelor's degree or higher significantly below state average. 22,413 73.3% Hispanic or Latino 5,704 18.7% White 1,951 6.4% Black 424 1.4% Two or more races 42 0.1% Asian 17 0.06% American Indian 6 0.02% Some other race
Data:
Median household income ($)
Median household income (% change since 2000)
Household income diversity
Ratio of average income to average house value (%)
Ratio of average income to average rent
Median household income ($) - White
Median household income ($) - Black or African American
Median household income ($) - Asian
Median household income ($) - Hispanic or Latino
Median household income ($) - American Indian and Alaska Native
Median household income ($) - Multirace
Median household income ($) - Other Race
Median household income for houses/condos with a mortgage ($)
Median household income for apartments without a mortgage ($)
Races - White alone (%)
Races - White alone (% change since 2000)
Races - Black alone (%)
Races - Black alone (% change since 2000)
Races - American Indian alone (%)
Races - American Indian alone (% change since 2000)
Races - Asian alone (%)
Races - Asian alone (% change since 2000)
Races - Hispanic (%)
Races - Hispanic (% change since 2000)
Races - Native Hawaiian and Other Pacific Islander alone (%)
Races - Native Hawaiian and Other Pacific Islander alone (% change since 2000)
Races - Two or more races (%)
Races - Two or more races (% change since 2000)
Races - Other race alone (%)
Races - Other race alone (% change since 2000)
Racial diversity
Unemployment (%)
Unemployment (% change since 2000)
Unemployment (%) - White
Unemployment (%) - Black or African American
Unemployment (%) - Asian
Unemployment (%) - Hispanic or Latino
Unemployment (%) - American Indian and Alaska Native
Unemployment (%) - Multirace
Unemployment (%) - Other Race
Population density (people per square mile)
Population - Males (%)
Population - Females (%)
Population - Males (%) - White
Population - Males (%) - Black or African American
Population - Males (%) - Asian
Population - Males (%) - Hispanic or Latino
Population - Males (%) - American Indian and Alaska Native
Population - Males (%) - Multirace
Population - Males (%) - Other Race
Population - Females (%) - White
Population - Females (%) - Black or African American
Population - Females (%) - Asian
Population - Females (%) - Hispanic or Latino
Population - Females (%) - American Indian and Alaska Native
Population - Females (%) - Multirace
Population - Females (%) - Other Race
Coronavirus confirmed cases (May 21, 2024)
Deaths caused by coronavirus (May 21, 2024)
Coronavirus confirmed cases (per 100k population) (May 21, 2024)
Deaths caused by coronavirus (per 100k population) (May 21, 2024)
Daily increase in number of cases (May 21, 2024)
Weekly increase in number of cases (May 21, 2024)
Cases doubled (in days) (May 21, 2024)
Hospitalized patients (Apr 18, 2022)
Negative test results (Apr 18, 2022)
Total test results (Apr 18, 2022)
COVID Vaccine doses distributed (per 100k population) (Sep 19, 2023)
COVID Vaccine doses administered (per 100k population) (Sep 19, 2023)
COVID Vaccine doses distributed (Sep 19, 2023)
COVID Vaccine doses administered (Sep 19, 2023)
Likely homosexual households (%)
Likely homosexual households (% change since 2000)
Likely homosexual households - Lesbian couples (%)
Likely homosexual households - Lesbian couples (% change since 2000)
Likely homosexual households - Gay men (%)
Likely homosexual households - Gay men (% change since 2000)
Cost of living index
Median gross rent ($)
Median contract rent ($)
Median monthly housing costs ($)
Median house or condo value ($)
Median house or condo value ($ change since 2000)
Mean house or condo value by units in structure - 1, detached ($)
Mean house or condo value by units in structure - 1, attached ($)
Mean house or condo value by units in structure - 2 ($)
Mean house or condo value by units in structure by units in structure - 3 or 4 ($)
Mean house or condo value by units in structure - 5 or more ($)
Mean house or condo value by units in structure - Boat, RV, van, etc. ($)
Mean house or condo value by units in structure - Mobile home ($)
Median house or condo value ($) - White
Median house or condo value ($) - Black or African American
Median house or condo value ($) - Asian
Median house or condo value ($) - Hispanic or Latino
Median house or condo value ($) - American Indian and Alaska Native
Median house or condo value ($) - Multirace
Median house or condo value ($) - Other Race
Median resident age
Resident age diversity
Median resident age - Males
Median resident age - Females
Median resident age - White
Median resident age - Black or African American
Median resident age - Asian
Median resident age - Hispanic or Latino
Median resident age - American Indian and Alaska Native
Median resident age - Multirace
Median resident age - Other Race
Median resident age - Males - White
Median resident age - Males - Black or African American
Median resident age - Males - Asian
Median resident age - Males - Hispanic or Latino
Median resident age - Males - American Indian and Alaska Native
Median resident age - Males - Multirace
Median resident age - Males - Other Race
Median resident age - Females - White
Median resident age - Females - Black or African American
Median resident age - Females - Asian
Median resident age - Females - Hispanic or Latino
Median resident age - Females - American Indian and Alaska Native
Median resident age - Females - Multirace
Median resident age - Females - Other Race
Commute - mean travel time to work (minutes)
Travel time to work - Less than 5 minutes (%)
Travel time to work - Less than 5 minutes (% change since 2000)
Travel time to work - 5 to 9 minutes (%)
Travel time to work - 5 to 9 minutes (% change since 2000)
Travel time to work - 10 to 19 minutes (%)
Travel time to work - 10 to 19 minutes (% change since 2000)
Travel time to work - 20 to 29 minutes (%)
Travel time to work - 20 to 29 minutes (% change since 2000)
Travel time to work - 30 to 39 minutes (%)
Travel time to work - 30 to 39 minutes (% change since 2000)
Travel time to work - 40 to 59 minutes (%)
Travel time to work - 40 to 59 minutes (% change since 2000)
Travel time to work - 60 to 89 minutes (%)
Travel time to work - 60 to 89 minutes (% change since 2000)
Travel time to work - 90 or more minutes (%)
Travel time to work - 90 or more minutes (% change since 2000)
Marital status - Never married (%)
Marital status - Now married (%)
Marital status - Separated (%)
Marital status - Widowed (%)
Marital status - Divorced (%)
Median family income ($)
Median family income (% change since 2000)
Median non-family income ($)
Median non-family income (% change since 2000)
Median per capita income ($)
Median per capita income (% change since 2000)
Median family income ($) - White
Median family income ($) - Black or African American
Median family income ($) - Asian
Median family income ($) - Hispanic or Latino
Median family income ($) - American Indian and Alaska Native
Median family income ($) - Multirace
Median family income ($) - Other Race
Median year house/condo built
Median year apartment built
Year house built - Built 2005 or later (%)
Year house built - Built 2000 to 2004 (%)
Year house built - Built 1990 to 1999 (%)
Year house built - Built 1980 to 1989 (%)
Year house built - Built 1970 to 1979 (%)
Year house built - Built 1960 to 1969 (%)
Year house built - Built 1950 to 1959 (%)
Year house built - Built 1940 to 1949 (%)
Year house built - Built 1939 or earlier (%)
Average household size
Household density (households per square mile)
Average household size - White
Average household size - Black or African American
Average household size - Asian
Average household size - Hispanic or Latino
Average household size - American Indian and Alaska Native
Average household size - Multirace
Average household size - Other Race
Occupied housing units (%)
Vacant housing units (%)
Owner occupied housing units (%)
Renter occupied housing units (%)
Vacancy status - For rent (%)
Vacancy status - For sale only (%)
Vacancy status - Rented or sold, not occupied (%)
Vacancy status - For seasonal, recreational, or occasional use (%)
Vacancy status - For migrant workers (%)
Vacancy status - Other vacant (%)
Residents with income below the poverty level (%)
Residents with income below 50% of the poverty level (%)
Children below poverty level (%)
Poor families by family type - Married-couple family (%)
Poor families by family type - Male, no wife present (%)
Poor families by family type - Female, no husband present (%)
Poverty status for native-born residents (%)
Poverty status for foreign-born residents (%)
Poverty among high school graduates not in families (%)
Poverty among people who did not graduate high school not in families (%)
Residents with income below the poverty level (%) - White
Residents with income below the poverty level (%) - Black or African American
Residents with income below the poverty level (%) - Asian
Residents with income below the poverty level (%) - Hispanic or Latino
Residents with income below the poverty level (%) - American Indian and Alaska Native
Residents with income below the poverty level (%) - Multirace
Residents with income below the poverty level (%) - Other Race
Air pollution - Air Quality Index (AQI)
Air pollution - CO
Air pollution - NO2
Air pollution - SO2
Air pollution - Ozone
Air pollution - PM10
Air pollution - PM25
Air pollution - Pb
Crime - Murders per 100,000 population
Crime - Rapes per 100,000 population
Crime - Robberies per 100,000 population
Crime - Assaults per 100,000 population
Crime - Burglaries per 100,000 population
Crime - Thefts per 100,000 population
Crime - Auto thefts per 100,000 population
Crime - Arson per 100,000 population
Crime - City-data.com crime index
Crime - Violent crime index
Crime - Property crime index
Crime - Murders per 100,000 population (5 year average)
Crime - Rapes per 100,000 population (5 year average)
Crime - Robberies per 100,000 population (5 year average)
Crime - Assaults per 100,000 population (5 year average)
Crime - Burglaries per 100,000 population (5 year average)
Crime - Thefts per 100,000 population (5 year average)
Crime - Auto thefts per 100,000 population (5 year average)
Crime - Arson per 100,000 population (5 year average)
Crime - City-data.com crime index (5 year average)
Crime - Violent crime index (5 year average)
Crime - Property crime index (5 year average)
1996 Presidential Elections Results (%) - Democratic Party (Clinton)
1996 Presidential Elections Results (%) - Republican Party (Dole)
1996 Presidential Elections Results (%) - Other
2000 Presidential Elections Results (%) - Democratic Party (Gore)
2000 Presidential Elections Results (%) - Republican Party (Bush)
2000 Presidential Elections Results (%) - Other
2004 Presidential Elections Results (%) - Democratic Party (Kerry)
2004 Presidential Elections Results (%) - Republican Party (Bush)
2004 Presidential Elections Results (%) - Other
2008 Presidential Elections Results (%) - Democratic Party (Obama)
2008 Presidential Elections Results (%) - Republican Party (McCain)
2008 Presidential Elections Results (%) - Other
2012 Presidential Elections Results (%) - Democratic Party (Obama)
2012 Presidential Elections Results (%) - Republican Party (Romney)
2012 Presidential Elections Results (%) - Other
2016 Presidential Elections Results (%) - Democratic Party (Clinton)
2016 Presidential Elections Results (%) - Republican Party (Trump)
2016 Presidential Elections Results (%) - Other
2020 Presidential Elections Results (%) - Democratic Party (Biden)
2020 Presidential Elections Results (%) - Republican Party (Trump)
2020 Presidential Elections Results (%) - Other
Ancestries Reported - Arab (%)
Ancestries Reported - Czech (%)
Ancestries Reported - Danish (%)
Ancestries Reported - Dutch (%)
Ancestries Reported - English (%)
Ancestries Reported - French (%)
Ancestries Reported - French Canadian (%)
Ancestries Reported - German (%)
Ancestries Reported - Greek (%)
Ancestries Reported - Hungarian (%)
Ancestries Reported - Irish (%)
Ancestries Reported - Italian (%)
Ancestries Reported - Lithuanian (%)
Ancestries Reported - Norwegian (%)
Ancestries Reported - Polish (%)
Ancestries Reported - Portuguese (%)
Ancestries Reported - Russian (%)
Ancestries Reported - Scotch-Irish (%)
Ancestries Reported - Scottish (%)
Ancestries Reported - Slovak (%)
Ancestries Reported - Subsaharan African (%)
Ancestries Reported - Swedish (%)
Ancestries Reported - Swiss (%)
Ancestries Reported - Ukrainian (%)
Ancestries Reported - United States (%)
Ancestries Reported - Welsh (%)
Ancestries Reported - West Indian (%)
Ancestries Reported - Other (%)
Educational Attainment - No schooling completed (%)
Educational Attainment - Less than high school (%)
Educational Attainment - High school or equivalent (%)
Educational Attainment - Less than 1 year of college (%)
Educational Attainment - 1 or more years of college (%)
Educational Attainment - Associate degree (%)
Educational Attainment - Bachelor's degree (%)
Educational Attainment - Master's degree (%)
Educational Attainment - Professional school degree (%)
Educational Attainment - Doctorate degree (%)
School Enrollment - Nursery, preschool (%)
School Enrollment - Kindergarten (%)
School Enrollment - Grade 1 to 4 (%)
School Enrollment - Grade 5 to 8 (%)
School Enrollment - Grade 9 to 12 (%)
School Enrollment - College undergrad (%)
School Enrollment - Graduate or professional (%)
School Enrollment - Not enrolled in school (%)
School enrollment - Public schools (%)
School enrollment - Private schools (%)
School enrollment - Not enrolled (%)
Median number of rooms in houses and condos
Median number of rooms in apartments
Housing units lacking complete plumbing facilities (%)
Housing units lacking complete kitchen facilities (%)
Density of houses
Urban houses (%)
Rural houses (%)
Households with people 60 years and over (%)
Households with people 65 years and over (%)
Households with people 75 years and over (%)
Households with one or more nonrelatives (%)
Households with no nonrelatives (%)
Population in households (%)
Family households (%)
Nonfamily households (%)
Population in families (%)
Family households with own children (%)
Median number of bedrooms in owner occupied houses
Mean number of bedrooms in owner occupied houses
Median number of bedrooms in renter occupied houses
Mean number of bedrooms in renter occupied houses
Median number of vehichles in owner occupied houses
Mean number of vehichles in owner occupied houses
Median number of vehichles in renter occupied houses
Mean number of vehichles in renter occupied houses
Mortgage status - with mortgage (%)
Mortgage status - with second mortgage (%)
Mortgage status - with home equity loan (%)
Mortgage status - with both second mortgage and home equity loan (%)
Mortgage status - without a mortgage (%)
Average family size
Average family size - White
Average family size - Black or African American
Average family size - Asian
Average family size - Hispanic or Latino
Average family size - American Indian and Alaska Native
Average family size - Multirace
Average family size - Other Race
Geographical mobility - Same house 1 year ago (%)
Geographical mobility - Moved within same county (%)
Geographical mobility - Moved from different county within same state (%)
Geographical mobility - Moved from different state (%)
Geographical mobility - Moved from abroad (%)
Place of birth - Born in state of residence (%)
Place of birth - Born in other state (%)
Place of birth - Native, outside of US (%)
Place of birth - Foreign born (%)
Housing units in structures - 1, detached (%)
Housing units in structures - 1, attached (%)
Housing units in structures - 2 (%)
Housing units in structures - 3 or 4 (%)
Housing units in structures - 5 to 9 (%)
Housing units in structures - 10 to 19 (%)
Housing units in structures - 20 to 49 (%)
Housing units in structures - 50 or more (%)
Housing units in structures - Mobile home (%)
Housing units in structures - Boat, RV, van, etc. (%)
House/condo owner moved in on average (years ago)
Renter moved in on average (years ago)
Year householder moved into unit - Moved in 1999 to March 2000 (%)
Year householder moved into unit - Moved in 1995 to 1998 (%)
Year householder moved into unit - Moved in 1990 to 1994 (%)
Year householder moved into unit - Moved in 1980 to 1989 (%)
Year householder moved into unit - Moved in 1970 to 1979 (%)
Year householder moved into unit - Moved in 1969 or earlier (%)
Means of transportation to work - Drove car alone (%)
Means of transportation to work - Carpooled (%)
Means of transportation to work - Public transportation (%)
Means of transportation to work - Bus or trolley bus (%)
Means of transportation to work - Streetcar or trolley car (%)
Means of transportation to work - Subway or elevated (%)
Means of transportation to work - Railroad (%)
Means of transportation to work - Ferryboat (%)
Means of transportation to work - Taxicab (%)
Means of transportation to work - Motorcycle (%)
Means of transportation to work - Bicycle (%)
Means of transportation to work - Walked (%)
Means of transportation to work - Other means (%)
Working at home (%)
Industry diversity
Most Common Industries - Agriculture, forestry, fishing and hunting, and mining (%)
Most Common Industries - Agriculture, forestry, fishing and hunting (%)
Most Common Industries - Mining, quarrying, and oil and gas extraction (%)
Most Common Industries - Construction (%)
Most Common Industries - Manufacturing (%)
Most Common Industries - Wholesale trade (%)
Most Common Industries - Retail trade (%)
Most Common Industries - Transportation and warehousing, and utilities (%)
Most Common Industries - Transportation and warehousing (%)
Most Common Industries - Utilities (%)
Most Common Industries - Information (%)
Most Common Industries - Finance and insurance, and real estate and rental and leasing (%)
Most Common Industries - Finance and insurance (%)
Most Common Industries - Real estate and rental and leasing (%)
Most Common Industries - Professional, scientific, and management, and administrative and waste management services (%)
Most Common Industries - Professional, scientific, and technical services (%)
Most Common Industries - Management of companies and enterprises (%)
Most Common Industries - Administrative and support and waste management services (%)
Most Common Industries - Educational services, and health care and social assistance (%)
Most Common Industries - Educational services (%)
Most Common Industries - Health care and social assistance (%)
Most Common Industries - Arts, entertainment, and recreation, and accommodation and food services (%)
Most Common Industries - Arts, entertainment, and recreation (%)
Most Common Industries - Accommodation and food services (%)
Most Common Industries - Other services, except public administration (%)
Most Common Industries - Public administration (%)
Occupation diversity
Most Common Occupations - Management, business, science, and arts occupations (%)
Most Common Occupations - Management, business, and financial occupations (%)
Most Common Occupations - Management occupations (%)
Most Common Occupations - Business and financial operations occupations (%)
Most Common Occupations - Computer, engineering, and science occupations (%)
Most Common Occupations - Computer and mathematical occupations (%)
Most Common Occupations - Architecture and engineering occupations (%)
Most Common Occupations - Life, physical, and social science occupations (%)
Most Common Occupations - Education, legal, community service, arts, and media occupations (%)
Most Common Occupations - Community and social service occupations (%)
Most Common Occupations - Legal occupations (%)
Most Common Occupations - Education, training, and library occupations (%)
Most Common Occupations - Arts, design, entertainment, sports, and media occupations (%)
Most Common Occupations - Healthcare practitioners and technical occupations (%)
Most Common Occupations - Health diagnosing and treating practitioners and other technical occupations (%)
Most Common Occupations - Health technologists and technicians (%)
Most Common Occupations - Service occupations (%)
Most Common Occupations - Healthcare support occupations (%)
Most Common Occupations - Protective service occupations (%)
Most Common Occupations - Fire fighting and prevention, and other protective service workers including supervisors (%)
Most Common Occupations - Law enforcement workers including supervisors (%)
Most Common Occupations - Food preparation and serving related occupations (%)
Most Common Occupations - Building and grounds cleaning and maintenance occupations (%)
Most Common Occupations - Personal care and service occupations (%)
Most Common Occupations - Sales and office occupations (%)
Most Common Occupations - Sales and related occupations (%)
Most Common Occupations - Office and administrative support occupations (%)
Most Common Occupations - Natural resources, construction, and maintenance occupations (%)
Most Common Occupations - Farming, fishing, and forestry occupations (%)
Most Common Occupations - Construction and extraction occupations (%)
Most Common Occupations - Installation, maintenance, and repair occupations (%)
Most Common Occupations - Production, transportation, and material moving occupations (%)
Most Common Occupations - Production occupations (%)
Most Common Occupations - Transportation occupations (%)
Most Common Occupations - Material moving occupations (%)
People in Group quarters - Institutionalized population (%)
People in Group quarters - Correctional institutions (%)
People in Group quarters - Federal prisons and detention centers (%)
People in Group quarters - Halfway houses (%)
People in Group quarters - Local jails and other confinement facilities (including police lockups) (%)
People in Group quarters - Military disciplinary barracks (%)
People in Group quarters - State prisons (%)
People in Group quarters - Other types of correctional institutions (%)
People in Group quarters - Nursing homes (%)
People in Group quarters - Hospitals/wards, hospices, and schools for the handicapped (%)
People in Group quarters - Hospitals/wards and hospices for chronically ill (%)
People in Group quarters - Hospices or homes for chronically ill (%)
People in Group quarters - Military hospitals or wards for chronically ill (%)
People in Group quarters - Other hospitals or wards for chronically ill (%)
People in Group quarters - Hospitals or wards for drug/alcohol abuse (%)
People in Group quarters - Mental (Psychiatric) hospitals or wards (%)
People in Group quarters - Schools, hospitals, or wards for the mentally retarded (%)
People in Group quarters - Schools, hospitals, or wards for the physically handicapped (%)
People in Group quarters - Institutions for the deaf (%)
People in Group quarters - Institutions for the blind (%)
People in Group quarters - Orthopedic wards and institutions for the physically handicapped (%)
People in Group quarters - Wards in general hospitals for patients who have no usual home elsewhere (%)
People in Group quarters - Wards in military hospitals for patients who have no usual home elsewhere (%)
People in Group quarters - Juvenile institutions (%)
People in Group quarters - Long-term care (%)
People in Group quarters - Homes for abused, dependent, and neglected children (%)
People in Group quarters - Residential treatment centers for emotionally disturbed children (%)
People in Group quarters - Training schools for juvenile delinquents (%)
People in Group quarters - Short-term care, detention or diagnostic centers for delinquent children (%)
People in Group quarters - Type of juvenile institution unknown (%)
People in Group quarters - Noninstitutionalized population (%)
People in Group quarters - College dormitories (includes college quarters off campus) (%)
People in Group quarters - Military quarters (%)
People in Group quarters - On base (%)
People in Group quarters - Barracks, unaccompanied personnel housing (UPH), (Enlisted/Officer), ;and similar group living quarters for military personnel (%)
People in Group quarters - Transient quarters for temporary residents (%)
People in Group quarters - Military ships (%)
People in Group quarters - Group homes (%)
People in Group quarters - Homes or halfway houses for drug/alcohol abuse (%)
People in Group quarters - Homes for the mentally ill (%)
People in Group quarters - Homes for the mentally retarded (%)
People in Group quarters - Homes for the physically handicapped (%)
People in Group quarters - Other group homes (%)
People in Group quarters - Religious group quarters (%)
People in Group quarters - Dormitories (%)
People in Group quarters - Agriculture workers' dormitories on farms (%)
People in Group quarters - Job Corps and vocational training facilities (%)
People in Group quarters - Other workers' dormitories (%)
People in Group quarters - Crews of maritime vessels (%)
People in Group quarters - Other nonhousehold living situations (%)
People in Group quarters - Other noninstitutional group quarters (%)
Residents speaking English at home (%)
Residents speaking English at home - Born in the United States (%)
Residents speaking English at home - Native, born elsewhere (%)
Residents speaking English at home - Foreign born (%)
Residents speaking Spanish at home (%)
Residents speaking Spanish at home - Born in the United States (%)
Residents speaking Spanish at home - Native, born elsewhere (%)
Residents speaking Spanish at home - Foreign born (%)
Residents speaking other language at home (%)
Residents speaking other language at home - Born in the United States (%)
Residents speaking other language at home - Native, born elsewhere (%)
Residents speaking other language at home - Foreign born (%)
Class of Workers - Employee of private company (%)
Class of Workers - Self-employed in own incorporated business (%)
Class of Workers - Private not-for-profit wage and salary workers (%)
Class of Workers - Local government workers (%)
Class of Workers - State government workers (%)
Class of Workers - Federal government workers (%)
Class of Workers - Self-employed workers in own not incorporated business and Unpaid family workers (%)
House heating fuel used in houses and condos - Utility gas (%)
House heating fuel used in houses and condos - Bottled, tank, or LP gas (%)
House heating fuel used in houses and condos - Electricity (%)
House heating fuel used in houses and condos - Fuel oil, kerosene, etc. (%)
House heating fuel used in houses and condos - Coal or coke (%)
House heating fuel used in houses and condos - Wood (%)
House heating fuel used in houses and condos - Solar energy (%)
House heating fuel used in houses and condos - Other fuel (%)
House heating fuel used in houses and condos - No fuel used (%)
House heating fuel used in apartments - Utility gas (%)
House heating fuel used in apartments - Bottled, tank, or LP gas (%)
House heating fuel used in apartments - Electricity (%)
House heating fuel used in apartments - Fuel oil, kerosene, etc. (%)
House heating fuel used in apartments - Coal or coke (%)
House heating fuel used in apartments - Wood (%)
House heating fuel used in apartments - Solar energy (%)
House heating fuel used in apartments - Other fuel (%)
House heating fuel used in apartments - No fuel used (%)
Armed forces status - In Armed Forces (%)
Armed forces status - Civilian (%)
Armed forces status - Civilian - Veteran (%)
Armed forces status - Civilian - Nonveteran (%)
Fatal accidents locations in years 2005-2021
Fatal accidents locations in 2005
Fatal accidents locations in 2006
Fatal accidents locations in 2007
Fatal accidents locations in 2008
Fatal accidents locations in 2009
Fatal accidents locations in 2010
Fatal accidents locations in 2011
Fatal accidents locations in 2012
Fatal accidents locations in 2013
Fatal accidents locations in 2014
Fatal accidents locations in 2015
Fatal accidents locations in 2016
Fatal accidents locations in 2017
Fatal accidents locations in 2018
Fatal accidents locations in 2019
Fatal accidents locations in 2020
Fatal accidents locations in 2021
Alcohol use - People drinking some alcohol every month (%)
Alcohol use - People not drinking at all (%)
Alcohol use - Average days/month drinking alcohol
Alcohol use - Average drinks/week
Alcohol use - Average days/year people drink much
Audiometry - Average condition of hearing (%)
Audiometry - People that can hear a whisper from across a quiet room (%)
Audiometry - People that can hear normal voice from across a quiet room (%)
Audiometry - Ears ringing, roaring, buzzing (%)
Audiometry - Had a job exposure to loud noise (%)
Audiometry - Had off-work exposure to loud noise (%)
Blood Pressure & Cholesterol - Has high blood pressure (%)
Blood Pressure & Cholesterol - Checking blood pressure at home (%)
Blood Pressure & Cholesterol - Frequently checking blood cholesterol (%)
Blood Pressure & Cholesterol - Has high cholesterol level (%)
Consumer Behavior - Money monthly spent on food at supermarket/grocery store
Consumer Behavior - Money monthly spent on food at other stores
Consumer Behavior - Money monthly spent on eating out
Consumer Behavior - Money monthly spent on carryout/delivered foods
Consumer Behavior - Income spent on food at supermarket/grocery store (%)
Consumer Behavior - Income spent on food at other stores (%)
Consumer Behavior - Income spent on eating out (%)
Consumer Behavior - Income spent on carryout/delivered foods (%)
Current Health Status - General health condition (%)
Current Health Status - Blood donors (%)
Current Health Status - Has blood ever tested for HIV virus (%)
Current Health Status - Left-handed people (%)
Dermatology - People using sunscreen (%)
Diabetes - Diabetics (%)
Diabetes - Had a blood test for high blood sugar (%)
Diabetes - People taking insulin (%)
Diet Behavior & Nutrition - Diet health (%)
Diet Behavior & Nutrition - Milk product consumption (# of products/month)
Diet Behavior & Nutrition - Meals not home prepared (#/week)
Diet Behavior & Nutrition - Meals from fast food or pizza place (#/week)
Diet Behavior & Nutrition - Ready-to-eat foods (#/month)
Diet Behavior & Nutrition - Frozen meals/pizza (#/month)
Drug Use - People that ever used marijuana or hashish (%)
Drug Use - Ever used hard drugs (%)
Drug Use - Ever used any form of cocaine (%)
Drug Use - Ever used heroin (%)
Drug Use - Ever used methamphetamine (%)
Health Insurance - People covered by health insurance (%)
Kidney Conditions-Urology - Avg. # of times urinating at night
Medical Conditions - People with asthma (%)
Medical Conditions - People with anemia (%)
Medical Conditions - People with psoriasis (%)
Medical Conditions - People with overweight (%)
Medical Conditions - Elderly people having difficulties in thinking or remembering (%)
Medical Conditions - People who ever received blood transfusion (%)
Medical Conditions - People having trouble seeing even with glass/contacts (%)
Medical Conditions - People with arthritis (%)
Medical Conditions - People with gout (%)
Medical Conditions - People with congestive heart failure (%)
Medical Conditions - People with coronary heart disease (%)
Medical Conditions - People with angina pectoris (%)
Medical Conditions - People who ever had heart attack (%)
Medical Conditions - People who ever had stroke (%)
Medical Conditions - People with emphysema (%)
Medical Conditions - People with thyroid problem (%)
Medical Conditions - People with chronic bronchitis (%)
Medical Conditions - People with any liver condition (%)
Medical Conditions - People who ever had cancer or malignancy (%)
Mental Health - People who have little interest in doing things (%)
Mental Health - People feeling down, depressed, or hopeless (%)
Mental Health - People who have trouble sleeping or sleeping too much (%)
Mental Health - People feeling tired or having little energy (%)
Mental Health - People with poor appetite or overeating (%)
Mental Health - People feeling bad about themself (%)
Mental Health - People who have trouble concentrating on things (%)
Mental Health - People moving or speaking slowly or too fast (%)
Mental Health - People having thoughts they would be better off dead (%)
Oral Health - Average years since last visit a dentist
Oral Health - People embarrassed because of mouth (%)
Oral Health - People with gum disease (%)
Oral Health - General health of teeth and gums (%)
Oral Health - Average days a week using dental floss/device
Oral Health - Average days a week using mouthwash for dental problem
Oral Health - Average number of teeth
Pesticide Use - Households using pesticides to control insects (%)
Pesticide Use - Households using pesticides to kill weeds (%)
Physical Activity - People doing vigorous-intensity work activities (%)
Physical Activity - People doing moderate-intensity work activities (%)
Physical Activity - People walking or bicycling (%)
Physical Activity - People doing vigorous-intensity recreational activities (%)
Physical Activity - People doing moderate-intensity recreational activities (%)
Physical Activity - Average hours a day doing sedentary activities
Physical Activity - Average hours a day watching TV or videos
Physical Activity - Average hours a day using computer
Physical Functioning - People having limitations keeping them from working (%)
Physical Functioning - People limited in amount of work they can do (%)
Physical Functioning - People that need special equipment to walk (%)
Physical Functioning - People experiencing confusion/memory problems (%)
Physical Functioning - People requiring special healthcare equipment (%)
Prescription Medications - Average number of prescription medicines taking
Preventive Aspirin Use - Adults 40+ taking low-dose aspirin (%)
Reproductive Health - Vaginal deliveries (%)
Reproductive Health - Cesarean deliveries (%)
Reproductive Health - Deliveries resulted in a live birth (%)
Reproductive Health - Pregnancies resulted in a delivery (%)
Reproductive Health - Women breastfeeding newborns (%)
Reproductive Health - Women that had a hysterectomy (%)
Reproductive Health - Women that had both ovaries removed (%)
Reproductive Health - Women that have ever taken birth control pills (%)
Reproductive Health - Women taking birth control pills (%)
Reproductive Health - Women that have ever used Depo-Provera or injectables (%)
Reproductive Health - Women that have ever used female hormones (%)
Sexual Behavior - People 18+ that ever had sex (vaginal, anal, or oral) (%)
Sexual Behavior - Males 18+ that ever had vaginal sex with a woman (%)
Sexual Behavior - Males 18+ that ever performed oral sex on a woman (%)
Sexual Behavior - Males 18+ that ever had anal sex with a woman (%)
Sexual Behavior - Males 18+ that ever had any sex with a man (%)
Sexual Behavior - Females 18+ that ever had vaginal sex with a man (%)
Sexual Behavior - Females 18+ that ever performed oral sex on a man (%)
Sexual Behavior - Females 18+ that ever had anal sex with a man (%)
Sexual Behavior - Females 18+ that ever had any kind of sex with a woman (%)
Sexual Behavior - Average age people first had sex
Sexual Behavior - Average number of female sex partners in lifetime (males 18+)
Sexual Behavior - Average number of female vaginal sex partners in lifetime (males 18+)
Sexual Behavior - Average age people first performed oral sex on a woman (18+)
Sexual Behavior - Average number of woman performed oral sex on in lifetime (18+)
Sexual Behavior - Average number of male sex partners in lifetime (males 18+)
Sexual Behavior - Average number of male anal sex partners in lifetime (males 18+)
Sexual Behavior - Average age people first performed oral sex on a man (18+)
Sexual Behavior - Average number of male oral sex partners in lifetime (18+)
Sexual Behavior - People using protection when performing oral sex (%)
Sexual Behavior - Average number of times people have vaginal or anal sex a year
Sexual Behavior - People having sex without condom (%)
Sexual Behavior - Average number of male sex partners in lifetime (females 18+)
Sexual Behavior - Average number of male vaginal sex partners in lifetime (females 18+)
Sexual Behavior - Average number of female sex partners in lifetime (females 18+)
Sexual Behavior - Circumcised males 18+ (%)
Sleep Disorders - Average hours sleeping at night
Sleep Disorders - People that has trouble sleeping (%)
Smoking-Cigarette Use - People smoking cigarettes (%)
Taste & Smell - People 40+ having problems with smell (%)
Taste & Smell - People 40+ having problems with taste (%)
Taste & Smell - People 40+ that ever had wisdom teeth removed (%)
Taste & Smell - People 40+ that ever had tonsils teeth removed (%)
Taste & Smell - People 40+ that ever had a loss of consciousness because of a head injury (%)
Taste & Smell - People 40+ that ever had a broken nose or other serious injury to face or skull (%)
Taste & Smell - People 40+ that ever had two or more sinus infections (%)
Weight - Average height (inches)
Weight - Average weight (pounds)
Weight - Average BMI
Weight - People that are obese (%)
Weight - People that ever were obese (%)
Weight - People trying to lose weight (%)
100%
urban population.
Estimated median house/condo value in 2022: $111,137
19604:
$111,137Pennsylvania:
$245,500
Median resident age: This zip code:
28.9 yearsPennsylvania median age:
40.9 years
Average household size: This zip code:
3.0 peoplePennsylvania:
2.4 people
Averages for the 2020 tax year for zip code 19604, filed in 2021:
Average Adjusted Gross Income (AGI) in 2020: $34,223 (Individual Income Tax Returns) Here:
$34,223State:
$75,707
Salary/wage: $29,236 (reported on 87.2% of returns )Here:
$29,236State:
$62,806
(% of AGI for various income ranges: 1113.8% for AGIs below $25k , 3419.3% for AGIs $25k-50k , 6103.0% for AGIs $50k-75k , 8995.1% for AGIs $75k-100k , 13958.2% for AGIs $100k-200k ) Taxable interest for individuals: $769 (reported on 7.7% of returns )This zip code:
$769Pennsylvania:
$1,633
(% of AGI for various income ranges: 2.0% for AGIs below $25k , 2.8% for AGIs $25k-50k , 11.4% for AGIs $50k-75k , 15.1% for AGIs $75k-100k , 104.7% for AGIs $100k-200k ) Ordinary dividends: $4,080 (reported on 3.5% of returns )(% of AGI for various income ranges: 3.8% for AGIs below $25k , 4.5% for AGIs $25k-50k , 11.5% for AGIs $50k-75k , 39.7% for AGIs $75k-100k , 291.8% for AGIs $100k-200k ) Net capital gain/loss in AGI: +$35,502 (reported on 3.2% of returns )Here:
+$35,502State:
+$23,522
(% of AGI for various income ranges: 0.4% for AGIs below $25k , 4.6% for AGIs $25k-50k , 22.8% for AGIs $50k-75k , 81.7% for AGIs $75k-100k , 562.4% for AGIs $100k-200k ) Profit/loss from business: +$5,622 (reported on 11.1% of returns )Here:
+$5,622State:
+$16,274
(% of AGI for various income ranges: 66.7% for AGIs below $25k , 56.8% for AGIs $25k-50k , 49.9% for AGIs $50k-75k , 74.0% for AGIs $75k-100k , 1054.1% for AGIs $100k-200k ) Taxable individual retirement arrangement distribution: $11,737 (reported on 2.6% of returns )19604:
$11,737Pennsylvania:
$18,583
(% of AGI for various income ranges: 13.4% for AGIs below $25k , 14.2% for AGIs $25k-50k , 34.3% for AGIs $50k-75k , 194.0% for AGIs $75k-100k , 1027.1% for AGIs $100k-200k ) Total itemized deductions: $26,776 (reported on 1.9% of returns )Here:
$26,776State:
$34,850
(% of AGI for various income ranges: 10.5% for AGIs below $25k , 55.4% for AGIs $25k-50k , 122.1% for AGIs $50k-75k , 217.1% for AGIs $75k-100k , 902.4% for AGIs $100k-200k ) Charity contributions: $8,679 (reported on 1.4% of returns )(% of AGI for various income ranges: 13.6% for AGIs $25k-50k , 32.6% for AGIs $50k-75k , 62.9% for AGIs $75k-100k , 259.4% for AGIs $100k-200k ) Taxes paid: $6,479 (reported on 1.8% of returns )(% of AGI for various income ranges: 0.9% for AGIs below $25k , 10.6% for AGIs $25k-50k , 37.8% for AGIs $50k-75k , 64.3% for AGIs $75k-100k , 211.2% for AGIs $100k-200k ) Earned income credit: $2,563 (reported on 34.7% of returns )(% of AGI for various income ranges: 147.3% for AGIs below $25k , 110.8% for AGIs $25k-50k , 1.9% for AGIs $50k-75k ) Percentage of individuals using paid preparers for their 2020 taxes: 94.8%(% for various income ranges: 93.8% for AGIs below $25k , 95.8% for AGIs $25k-50k , 95.4% for AGIs $50k-75k , 93.8% for AGIs $75k-100k , 96.3% for AGIs $100k-200k , 100.0% for AGIs over 200k )
Averages for the 2012 tax year for zip code 19604, filed in 2013:
Average Adjusted Gross Income (AGI) in 2012: $26,868 (Individual Income Tax Returns) Here:
$26,868State:
$61,346
Salary/wage: $24,971 (reported on 88.6% of returns )Here:
$24,971State:
$51,902
(% of AGI for various income ranges: 81.0% for AGIs below $25k , 90.3% for AGIs $25k-50k , 84.3% for AGIs $50k-75k , 74.0% for AGIs $75k-100k , 85.2% for AGIs $100k-200k ) Taxable interest for individuals: $1,046 (reported on 13.1% of returns )This zip code:
$1,046Pennsylvania:
$1,588
(% of AGI for various income ranges: 0.4% for AGIs below $25k , 0.2% for AGIs $25k-50k , 0.5% for AGIs $50k-75k , 0.9% for AGIs $75k-100k , 1.5% for AGIs $100k-200k , 2.0% for AGIs over 200k ) Ordinary dividends: $4,232 (reported on 6.2% of returns )(% of AGI for various income ranges: 0.5% for AGIs below $25k , 0.3% for AGIs $25k-50k , 0.9% for AGIs $50k-75k , 1.3% for AGIs $75k-100k , 4.2% for AGIs $100k-200k , 6.0% for AGIs over 200k ) Net capital gain/loss in AGI: +$2,493 (reported on 3.8% of returns )Here:
+$2,493State:
+$14,495
(% of AGI for various income ranges: 0.1% for AGIs $75k-100k , 4.8% for AGIs $100k-200k ) Profit/loss from business: +$8,684 (reported on 8.5% of returns )Here:
+$8,684State:
+$16,268
(% of AGI for various income ranges: 7.0% for AGIs below $25k , 1.0% for AGIs $25k-50k , 1.0% for AGIs $50k-75k , 1.4% for AGIs $75k-100k , 1.0% for AGIs $100k-200k ) Taxable individual retirement arrangement distribution: $9,777 (reported on 4.4% of returns )19604:
$9,777Pennsylvania:
$14,550
(% of AGI for various income ranges: 1.0% for AGIs below $25k , 0.9% for AGIs $25k-50k , 1.7% for AGIs $50k-75k , 4.3% for AGIs $75k-100k , 5.1% for AGIs $100k-200k ) Total itemized deductions: $16,259 (28% of AGI, reported on 11.9% of returns )Here:
$16,259State:
$23,538
Here:
27.7% of AGIState:
18.4% of AGI
(% of AGI for various income ranges: 2.5% for AGIs below $25k , 7.2% for AGIs $25k-50k , 10.6% for AGIs $50k-75k , 11.2% for AGIs $75k-100k , 12.3% for AGIs $100k-200k , 12.3% for AGIs over 200k ) Charity contributions: $2,248 (reported on 8.8% of returns )(% of AGI for various income ranges: 0.2% for AGIs below $25k , 0.6% for AGIs $25k-50k , 1.0% for AGIs $50k-75k , 1.4% for AGIs $75k-100k , 2.0% for AGIs $100k-200k , 2.2% for AGIs over 200k ) Taxes paid: $6,288 (reported on 11.9% of returns )(% of AGI for various income ranges: 0.7% for AGIs below $25k , 2.5% for AGIs $25k-50k , 4.2% for AGIs $50k-75k , 4.6% for AGIs $75k-100k , 6.2% for AGIs $100k-200k , 5.9% for AGIs over 200k ) Earned income credit: $2,638 (reported on 43.1% of returns )(% of AGI for various income ranges: 11.8% for AGIs below $25k , 2.2% for AGIs $25k-50k ) Percentage of individuals using paid preparers for their 2012 taxes: 69.6%(% for various income ranges: 69.9% for AGIs below $25k , 71.3% for AGIs $25k-50k , 63.5% for AGIs $50k-75k , 61.5% for AGIs $75k-100k , 58.8% for AGIs $100k-200k , 100.0% for AGIs over 200k )
Averages for the 2004 tax year for zip code 19604, filed in 2005:
Average Adjusted Gross Income (AGI) in 2004: $26,409 (Individual Income Tax Returns) Here:
$26,409State:
$48,049
Salary/wage: $24,648 (reported on 88.9% of returns )Here:
$24,648State:
$42,646
(% of AGI for various income ranges: 84.2% for AGIs below $10k , 85.2% for AGIs $10k-25k , 89.9% for AGIs $25k-50k , 83.4% for AGIs $50k-75k , 78.7% for AGIs $75k-100k , 57.5% for AGIs over 100k ) Taxable interest for individuals: $1,604 (reported on 24.1% of returns )This zip code:
$1,604Pennsylvania:
$1,657
(% of AGI for various income ranges: 2.0% for AGIs below $10k , 1.2% for AGIs $10k-25k , 0.6% for AGIs $25k-50k , 1.6% for AGIs $50k-75k , 1.7% for AGIs $75k-100k , 4.3% for AGIs over 100k ) Taxable dividends: $3,016 (reported on 11.7% of returns )(% of AGI for various income ranges: 1.7% for AGIs below $10k , 0.6% for AGIs $10k-25k , 0.5% for AGIs $25k-50k , 0.9% for AGIs $50k-75k , 1.7% for AGIs $75k-100k , 6.1% for AGIs over 100k ) Net capital gain/loss: +$1,882 (reported on 7.9% of returns )Here:
+$1,882State:
+$9,716
(% of AGI for various income ranges: -1.0% for AGIs below $10k , 0.1% for AGIs $10k-25k , 0.3% for AGIs $25k-50k , 0.8% for AGIs $50k-75k , 0.6% for AGIs $75k-100k , 2.6% for AGIs over 100k ) Profit/loss from business: +$7,931 (reported on 6.6% of returns )Here:
+$7,931State:
+$14,267
(% of AGI for various income ranges: 5.7% for AGIs below $10k , 2.7% for AGIs $10k-25k , 1.2% for AGIs $25k-50k , 1.7% for AGIs $50k-75k , 2.7% for AGIs $75k-100k , 1.3% for AGIs over 100k ) IRA payment deduction: $2,536 (reported on 1.1% of returns )19604:
$2,536Pennsylvania:
$2,903
Self-employed pension: $3,667 (reported on 0.1% of returns )Here:
$3,667Pennsylvania:
$14,674
Total itemized deductions: $13,393 (22% of AGI, reported on 12.4% of returns )Here:
$13,393State:
$18,804
Here:
22.1% of AGIState:
19.5% of AGI
(% of AGI for various income ranges: 2.1% for AGIs below $10k , 3.4% for AGIs $10k-25k , 5.8% for AGIs $25k-50k , 7.8% for AGIs $50k-75k , 9.1% for AGIs $75k-100k , 11.8% for AGIs over 100k ) Charity contributions deductions: $2,728 (4% of AGI, reported on 10.1% of returns )Here:
4.1% of AGIState:
3.3% of AGI
(% of AGI for various income ranges: 0.1% for AGIs below $10k , 0.4% for AGIs $10k-25k , 0.6% for AGIs $25k-50k , 1.1% for AGIs $50k-75k , 1.4% for AGIs $75k-100k , 4.0% for AGIs over 100k ) Total tax: $3,482 (reported on 54.8% of returns )(% of AGI for various income ranges: 1.6% for AGIs below $10k , 2.7% for AGIs $10k-25k , 5.6% for AGIs $25k-50k , 8.8% for AGIs $50k-75k , 11.3% for AGIs $75k-100k , 19.8% for AGIs over 100k ) Earned income credit: $2,021 (reported on 34.8% of returns )Percentage of individuals using paid preparers for their 2004 taxes: 64.5%(% for various income ranges: 61.0% for AGIs below $10k , 69.8% for AGIs $10k-25k , 63.5% for AGIs $25k-50k , 55.6% for AGIs $50k-75k , 58.9% for AGIs $75k-100k , 62.4% for AGIs over 100k )
Estimated median household income in 2022: This zip code:
$51,389Pennsylvania:
$71,798
Nearest zip codes: 19602 ,
19601 ,
19611 ,
19560 ,
19605 ,
19606 .
Reading Zip Code Map
Percentage of family households: This zip code:
52.2%Pennsylvania:
42.6%
Percentage of households with unmarried partners: This zip code:
9.0%Pennsylvania:
46.5%
Likely homosexual households (counted as self-reported same-sex unmarried-partner households)
Lesbian couples: 0.3% of all households Gay men: 0.0% of all households
Household received Food Stamps/SNAP in the past 12 months: 3,392Household did not receive Food Stamps/SNAP in the past 12 months: 6,368
Women who had a birth in the past 12 months: 489 (209 now married , 251 unmarried) Women who did not have a birth in the past 12 months: 7,419 (2,461 now married , 4,973 unmarried)
Housing units in zip code 19604 with a mortgage: 2,727 (346
second mortgage , 34
home equity loan , 297
both second mortgage and home equity loan )
Houses without a mortgage: 135
Median monthly owner costs for units with a mortgage: $1,112
Median monthly owner costs for units without a mortgage: $510
Residents with income below the poverty level in 2022:
This zip code:
19.7%Whole state:
11.8%
Residents with income below 50% of the poverty level in 2022:
This zip code:
12.8%Whole state:
6.1%
Median number of rooms in houses and condos: Median number of rooms in apartments: Notable locations in this zip code not listed on our city pages
Click to draw/clear zip code borders Notable locations in zip code 19604: (A) , North Reading Plaza (B) , Teel Hall (C) , Selwyn Hall (D) , Rockland Professional Center (E) , Richmond Corporate Center (F) , Pushman Collage (G) , Multifaith Center (H) , Mohn Hall (I) , Merner-Pfeiffer Hall of Science (J) , Masters Hall (K) , Krause Hall (L) , F Wilbur Gingrich Library (M) , Corwell Hall (N) , Center for Experiental Learning and Research (O) , Center for Computing and Mathematics (P) , Campus Center Dining Hall (Q) , Bollman Center (R) , Albright Woods Apartments (S) , Albright Court (T) . Display/hide their locations on the map
Churches in zip code 19604 include: (A) , Sylvan Chapel (B) , Hampden Mennonite Church (C) , Grace United Methodist Church (D) , Grace Bible Fellowship Church (E) , New Revival Evangelical Mennonite Church (F) , Nativity Lutheran Church (G) , Saint Joseph's Roman Catholic Church (H) , Segunda Iglesia Tesalonica Christina Asambleas de Dios (I) . Display/hide their locations on the map
Reservoir: (A) . Display/hide its location on the map
Parks in zip code 19604 include: (1) , Hampden Park (2) , Hillside Playground (3) , Gene L Shirk Stadium (4) , Ketchner Field (5) , Science Field (6) . Display/hide their locations on the map
Year house built (houses)
0 2020 or later185 2010 to 2019133 2000 to 2009238 1990 to 1999448 1980 to 1989792 1970 to 1979993 1960 to 1969878 1950 to 1959789 1940 to 19495,743 1939 or earlier
Zip code 19604 household income distribution in 2022 589 Less than $10,000661 $10,000 to $14,999610 $15,000 to $19,999485 $20,000 to $24,999367 $25,000 to $29,999876 $30,000 to $34,999263 $35,000 to $39,999384 $40,000 to $44,999409 $45,000 to $49,999859 $50,000 to $59,9991,134 $60,000 to $74,9991,246 $75,000 to $99,999765 $100,000 to $124,999428 $125,000 to $149,999391 $150,000 to $199,999199 $200,000 or moreEstimate of home value of owner-occupied houses/condos in 2022 in zip code 19604 69 Less than $10,00019 $10,000 to $14,999145 $15,000 to $19,99931 $20,000 to $24,9995 $25,000 to $29,99944 $30,000 to $34,99931 $35,000 to $39,999160 $40,000 to $49,999214 $50,000 to $59,999449 $60,000 to $69,999333 $70,000 to $79,999306 $80,000 to $89,999176 $90,000 to $99,999851 $100,000 to $124,999169 $125,000 to $149,999359 $150,000 to $174,999179 $175,000 to $199,999263 $200,000 to $249,999111 $250,000 to $299,999128 $300,000 to $399,99913 $400,000 to $499,99932 $1,000,000 to $1,499,999Rent paid by renters in 2022 in zip code 19604 365 Less than $10032 $150 to $19957 $200 to $24967 $250 to $29913 $350 to $39969 $400 to $449116 $450 to $499299 $500 to $54989 $550 to $599265 $600 to $649539 $650 to $699198 $700 to $749421 $750 to $799870 $800 to $899684 $900 to $999678 $1,000 to $1,249341 $1,250 to $1,499111 No cash rent
Median gross rent in 2022: $1,020.
Median price asked for vacant for-sale houses and condos in 2022: $174,642.
Estimated median house (or condo) value in 2022 for: White Non-Hispanic householders: $111,636Black or African American householders: $124,373American Indian or Alaska Native householders: $81,167Asian householders: $113,384Some other race householders: $106,391Two or more races householders: $107,390Hispanic or Latino householders: $105,392Estimated median house or condo value in 2022: $111,137
19604:
$111,137Pennsylvania:
$245,500
Lower value quartile - upper value quartile: $74,460 - $161,386
Mean price in 2022: Detached houses: $205,415Here:
$205,415State:
$317,202
Townhouses or other attached units: $94,640Here:
$94,640State:
$254,369
In 2-unit structures: $63,274Here:
$63,274State:
$249,182
In 3-to-4-unit structures: $184,501Here:
$184,501State:
$297,446
In 5-or-more-unit structures: $62,290Here:
$62,290State:
$320,068
Housing units in structures:
One, detached: 1,264One, attached: 6,268Two: 1,2553 or 4: 6885 to 9: 10710 to 19: 23920 to 49: 15750 or more: 349Mobile homes: 33Unemployment : 6.8%
Means of transportation to work in zip code 19604 59.8% 7,938 Drove a car alone15.8% 2,092 Carpooled2.5% 337 Bus or trolley bus0.9% 116 Taxi4.6% 606 Walked8.8% 1,166 Other means6.7% 889 Worked at homeTravel time to work (commute) in zip code 19604 128 Less than 5 minutes1,065 5 to 9 minutes1,981 10 to 14 minutes2,643 15 to 19 minutes1,947 20 to 24 minutes1,001 25 to 29 minutes1,254 30 to 34 minutes286 35 to 39 minutes328 40 to 44 minutes547 45 to 59 minutes525 60 to 89 minutes387 90 or more minutes
Neighborhoods in zip code 19604: Percentage of zip code residents living and working in this county: 85.4%
Household type by relationship:
Households: 30,561
Male householders: 3,754 (869 living alone ), Female householders: 5,904 (1,711 living alone )3,572 spouses (3,572 opposite-sex spouses ), 975 unmarried partners , (941 opposite-sex unmarried partners ), 10,672 children (10,183 natural , 0 adopted , 495 stepchildren ), 1,516 grandchildren , 750 brothers or sisters , 649 parents , 0 foster children , 615 other relatives , 712 non-relatives In group quarters: 1,254 (-1 institutionalized population )
Size of family households: 1,935 2-persons , 1,625 3-persons , 1,284 4-persons , 862 5-persons , 523 6-persons , 279 7-or-more-persons
Size of nonfamily households: 2,579 1-person , 357 2-persons , 86 3-persons , 32 4-persons
3,368 married couples with children. single-parent households (352 men , 3,173 women ).
43.4% of residents of 19604 zip code speak English at home. of residents speak Spanish at home (51% very well, 16% well, 21% not well, 12% not at all ).of residents speak other Indo-European language at home (80% very well, 16% well, 4% not well ).of residents speak Asian or Pacific Island language at home (43% very well, 57% well ).of residents speak other language at home (92% very well, 8% well ).
Foreign born population: 7,183 (23.5%)
(41.6%
of them are naturalized citizens )
This zip code:
23.5%Whole state:
7.5%
69% Dominica 27% Honduras 5% El Salvador 5% Costa Rica 2% Guatemala 1% Ecuador 1% Colombia 4% German 2% American 2% English 1% Irish 1% Italian 1% Guyanese 1% Polish
Year of entry for the foreign-born population
5,141 2010 or later 2,463 2000 to 2009 2,238 1990 to 1999 2,073 Before 1990
There are
53 Medical Specialists in Zip Code 19604 .
Facilities with environmental interests located in this zip code:
AMERICAN COLOR & CHEM CORP (12TH & BERN STS in READING, PA)
(Integrated Compliance Information System) - ICIS-03-1991-0179, FORMAL ENFORCEMENT ACTION COMPLIANCE ACTIVITY (Tracking inspections of insecticide, fungicide, and rodenticide, and toxic substances) (Resource Conservation and Recovery Act (tracking hazardous waste)) Business NAICS classification: CYCLIC CRUDE AND INTERMEDIATE MANUFACTURING.Organizations: CIBA-GEIGY CORPORATION (CONTACT/OPERATOR)
BERKS AREA READING TRANSP AUTH (1700 N 11TH ST in READING, PA)
STATE MASTER (Pennsylvania database) - RCRIS-PAD063881858, HAZARDOUS WASTE PROGRAM Small Quantity Generators, between 100 kg and 1000 kg of hazardous waste/month (Resource Conservation and Recovery Act (tracking hazardous waste)) - notification Organizations: OPERNAME (CONTACT/OPERATOR)
AT&T MICROELECTRONICS READING (2136 NORTH 13TH STREET in READING, PA)
(Resource Conservation and Recovery Act (tracking hazardous waste)) Organizations: OPERNAME (CONTACT/OPERATOR)
, READING LTD PARTNERSHIP (CONTACT/OWNER)
Alternative names: AT&T TECHNOLOGIES INC
BACHMAN IRON WORKS INC (1645 N NINETH DT in READING, PA)
Small Quantity Generators, between 100 kg and 1000 kg of hazardous waste/month (Resource Conservation and Recovery Act (tracking hazardous waste)) - notification Organizations: OPERNAME (CONTACT/OPERATOR)
BERKS PRODS CORP/FUEL OIL TRUC (HESS'S EQUIPMENT RENTAL in READING, PA)
National Pollutant Discharge Elimination System NON-MAJOR (Tracking pollutant discharge elimination systems) - permit Business SIC classification: FUEL OIL DEALERSAlternative names: BERKS PROD CORP
Housing units lacking complete plumbing facilities: 1.0%
Housing units lacking complete kitchen facilities: 2.2%
57.7% Utility gas 21.4% Electricity 17.6% Fuel oil, kerosene, etc. 2.3% Bottled, tank, or LP gas
Population in 1990: 22,987. Population change in the 1990s: +945 (+4.1%).
Place of birth for U.S.-born residents:
This state: 13,973Northeast: 4,238Midwest: 207South: 476West: 171
55% of the 19604 zip code residents lived in the same house 5 years ago.
Out of people who lived in different houses, 70% lived in this county.
Out of people who lived in different counties, 50% lived in Pennsylvania.
89% of the 19604 zip code residents lived in the same house 1 year ago.
Out of people who lived in different houses, 51% moved from this county.
Out of people who lived in different houses, 22% moved from different county within same state.
Out of people who lived in different houses, 12% moved from different state.
Out of people who lived in different houses, 15% moved from abroad.
Private vs. public school enrollment:
Students in private schools in grades 1 to 8 (elementary and middle school): 360
Here:
8.7%Pennsylvania:
15.7%
Students in private schools in grades 9 to 12 (high school): 101
Here:
4.8%Pennsylvania:
13.4%
Students in private undergraduate colleges: 1,089
Here:
44.2%Pennsylvania:
39.8%
Occupation by median earnings in the past 12 months ($)
73,688 Law enforcement workers including supervisors 64,527 Health diagnosing and treating practitioners and other technical occupations 55,804 Community and social service occupations 51,486 Architecture and engineering occupations 51,422 Computer and mathematical occupations 44,420 Management occupations
Companies with federal contracts located in this zip code (READING, PA):
ST JOSEPH REGIONAL HEALTH NETW (12TH AND WALNUT ST) in 4 contracts from 2002 to 2006
$50,000 with Department of Veterans Affairs for General Health Care Services. Signed on 2002-09-15. Completion date: 2003-09-15.
with Department of Veterans Affairs for Lease or Rental of Facilities -- Laboratories and Clinics. Signed on 2006-08-31. Effective on 2006-10-01. Completion date: 2006-10-01.
, same as above. Signed on 2005-09-12. Effective on 2005-09-01. Completion date: 2006-08-31.
, same as above. Signed on 2004-09-15. Completion date: 2005-08-30.
ST JOSEPH'S REGIONAL HEALTH NE (12TH & WALNUT) in 4 contracts from 2000 to 2001
$120,000 with Department of Veterans Affairs for General Health Care Services. Signed on 2001-09-15. Completion date: 2001-09-15.
, same as above. Signed on 2000-09-15. Completion date: 2000-09-15.
, same as above. Signed on 2000-12-15. Completion date: 2001-09-15.
, same as above. Signed on 2000-06-15. Completion date: 2000-09-15.
AUSTIN HARDWARE & SUPPLY, INC. (1001 ROCKLAND ST; small business) in 10 contracts from 2005 to 2006
Contracts for Hardware, Weapon System, Vehicular Cab, Body, and Frame Structural Components, Vehicular Furniture and Accessories, Fastening Device, and more by Defense Logistics AgencySigned by year: 2000: $0; 2001: $0; 2002: $0; 2003: $0; 2004: $0; 2005: $32,033; 2006: $30,636.
Biggest contracts: with Defense Logistics Agency for Hardware, Weapon System. Signed on 2006-02-07. Completion date: 2006-04-26.
with Defense Logistics Agency for Vehicular Cab, Body, and Frame Structural Components. Signed on 2005-12-15. Completion date: 2006-02-23.
with Defense Logistics Agency for Vehicular Furniture and Accessories. Signed on 2005-11-16. Completion date: 2006-01-15.
, same as above. Signed on 2005-02-25. Completion date: 2005-05-14.
PERROTTO BUILDERS LTD INC (1209 N 11TH ST; small business)
$8,600 with U.S. Army Corps of Engineers - civil program financing only for Maintenance, Repair or Alteration of Real Property -- Other Non-Building Facilities. Signed on 2000-09-25. Completion date: 2000-11-30.
Top industries in this zip code by the number of employees in 2005:
Administrative and Support and Waste Management and Remediation Services: Temporary Help Services (500-999 employees: 1 establishment)Construction: Masonry Contractors (100-249: 1, 10-19: 2)Health Care and Social Assistance: Offices of Physicians (except Mental Health Specialists) (20-49: 1, 10-19: 1, 5-9: 4, 1-4: 2)Construction: Electrical Contractors (50-99: 1, 1-4: 1)
People in group quarters in 2010:
1,094 people in college/university student housing
3 people in group homes intended for adults
People in group quarters in 2000:
886 people in college dormitories (includes college quarters off campus)
34 people in nursing homes
9 people in religious group quarters
Fatal accident statistics in 2012:
Fatal accident count: 1Vehicles involved in fatal accidents: 9Fatal accidents caused by drunken drivers: 1Fatalities: 1Persons involved in fatal accidents: 5Pedestrians involved in fatal accidents: 0
Fatal accident statistics in 2011:
Fatal accident count: 1Vehicles involved in fatal accidents: 1Fatal accidents caused by drunken drivers: 0Fatalities: 1Persons involved in fatal accidents: 2Pedestrians involved in fatal accidents: 0
Home Mortgage Disclosure Act Aggregated Statistics For Year 2009(Based on 6 full and 8 partial tracts) A) FHA, FSA/RHS & VA B) Conventional C) Refinancings D) Home Improvement Loans E) Loans on Dwellings For 5+ Families F) Non-occupant Loans on G) Loans On Manufactured Number Average Value Number Average Value Number Average Value Number Average Value Number Average Value Number Average Value Number Average Value
LOANS ORIGINATED 151 $71,218 113 $58,348 117 $81,829 77 $16,643 1 $94,000 74 $49,380 0 $0 APPLICATIONS APPROVED, NOT ACCEPTED 2 $99,585 8 $46,102 14 $76,568 5 $14,400 0 $0 2 $58,710 0 $0 APPLICATIONS DENIED 39 $67,013 28 $42,740 136 $72,447 140 $17,196 3 $116,333 40 $52,245 1 $40,000 APPLICATIONS WITHDRAWN 13 $80,138 15 $74,772 63 $83,214 8 $41,029 0 $0 11 $45,637 1 $75,000 FILES CLOSED FOR INCOMPLETENESS 2 $91,000 2 $48,970 11 $69,325 3 $24,817 0 $0 1 $27,940 0 $0
Aggregated Statistics For Year 2008(Based on 6 full and 8 partial tracts) A) FHA, FSA/RHS & VA B) Conventional C) Refinancings D) Home Improvement Loans E) Loans on Dwellings For 5+ Families F) Non-occupant Loans on G) Loans On Manufactured Number Average Value Number Average Value Number Average Value Number Average Value Number Average Value Number Average Value Number Average Value
LOANS ORIGINATED 117 $77,774 218 $62,096 229 $69,598 112 $16,582 7 $152,940 179 $65,525 0 $0 APPLICATIONS APPROVED, NOT ACCEPTED 5 $79,630 17 $63,945 60 $67,670 6 $35,275 0 $0 26 $51,588 2 $32,415 APPLICATIONS DENIED 34 $68,260 76 $65,489 276 $76,314 165 $22,511 0 $0 89 $63,753 1 $45,960 APPLICATIONS WITHDRAWN 11 $77,126 13 $91,193 54 $77,768 8 $28,164 1 $187,000 18 $61,401 2 $57,020 FILES CLOSED FOR INCOMPLETENESS 2 $87,100 24 $61,952 20 $67,531 2 $79,280 0 $0 8 $46,421 0 $0
Aggregated Statistics For Year 2007(Based on 6 full and 8 partial tracts) A) FHA, FSA/RHS & VA B) Conventional C) Refinancings D) Home Improvement Loans E) Loans on Dwellings For 5+ Families F) Non-occupant Loans on G) Loans On Manufactured Number Average Value Number Average Value Number Average Value Number Average Value Number Average Value Number Average Value Number Average Value
LOANS ORIGINATED 54 $74,880 515 $63,928 332 $59,763 156 $21,170 9 $124,674 244 $53,557 0 $0 APPLICATIONS APPROVED, NOT ACCEPTED 1 $37,080 85 $63,406 96 $57,982 23 $29,575 0 $0 67 $50,263 0 $0 APPLICATIONS DENIED 15 $73,186 183 $61,752 449 $67,604 292 $24,041 3 $57,097 181 $60,628 1 $16,120 APPLICATIONS WITHDRAWN 3 $97,587 43 $73,375 119 $62,402 18 $45,339 0 $0 26 $51,045 1 $7,660 FILES CLOSED FOR INCOMPLETENESS 0 $0 33 $71,136 36 $69,634 2 $20,975 0 $0 15 $56,436 0 $0
Aggregated Statistics For Year 2006(Based on 6 full and 8 partial tracts) A) FHA, FSA/RHS & VA B) Conventional C) Refinancings D) Home Improvement Loans E) Loans on Dwellings For 5+ Families F) Non-occupant Loans on G) Loans On Manufactured Number Average Value Number Average Value Number Average Value Number Average Value Number Average Value Number Average Value Number Average Value
LOANS ORIGINATED 37 $74,175 769 $57,559 395 $57,183 169 $20,329 13 $1,134,073 476 $49,297 0 $0 APPLICATIONS APPROVED, NOT ACCEPTED 0 $0 78 $57,420 99 $62,240 19 $24,834 2 $45,535 54 $50,176 1 $32,000 APPLICATIONS DENIED 4 $66,378 235 $59,189 497 $62,261 274 $26,339 7 $193,666 195 $44,767 4 $57,250 APPLICATIONS WITHDRAWN 4 $75,628 55 $74,311 175 $62,495 18 $45,876 1 $30,000 31 $60,426 0 $0 FILES CLOSED FOR INCOMPLETENESS 1 $46,000 18 $78,342 31 $77,792 1 $25,000 0 $0 8 $85,636 0 $0
Aggregated Statistics For Year 2005(Based on 6 full and 8 partial tracts) A) FHA, FSA/RHS & VA B) Conventional C) Refinancings D) Home Improvement Loans E) Loans on Dwellings For 5+ Families F) Non-occupant Loans on G) Loans On Manufactured Number Average Value Number Average Value Number Average Value Number Average Value Number Average Value Number Average Value Number Average Value
LOANS ORIGINATED 50 $56,678 666 $52,175 367 $52,822 146 $16,280 16 $104,915 443 $46,979 1 $8,000 APPLICATIONS APPROVED, NOT ACCEPTED 3 $41,843 75 $59,190 107 $51,999 17 $23,716 2 $72,900 50 $49,760 1 $65,000 APPLICATIONS DENIED 6 $90,117 182 $55,880 542 $56,993 288 $17,923 9 $94,730 158 $36,270 11 $54,849 APPLICATIONS WITHDRAWN 3 $56,500 67 $65,753 182 $73,905 32 $80,401 0 $0 51 $49,103 0 $0 FILES CLOSED FOR INCOMPLETENESS 2 $62,500 26 $56,727 21 $83,883 5 $51,922 1 $66,820 17 $62,792 0 $0
Aggregated Statistics For Year 2004(Based on 6 full and 8 partial tracts) A) FHA, FSA/RHS & VA B) Conventional C) Refinancings D) Home Improvement Loans E) Loans on Dwellings For 5+ Families F) Non-occupant Loans on G) Loans On Manufactured Number Average Value Number Average Value Number Average Value Number Average Value Number Average Value Number Average Value Number Average Value
LOANS ORIGINATED 69 $56,909 462 $46,957 367 $50,696 141 $15,405 9 $81,899 302 $36,131 1 $54,250 APPLICATIONS APPROVED, NOT ACCEPTED 4 $56,478 43 $56,255 161 $49,226 26 $13,183 0 $0 48 $34,412 0 $0 APPLICATIONS DENIED 9 $61,593 133 $52,516 661 $54,833 313 $14,668 1 $47,000 207 $23,947 6 $36,442 APPLICATIONS WITHDRAWN 4 $65,625 67 $48,706 290 $59,656 12 $25,902 1 $24,180 45 $41,399 0 $0 FILES CLOSED FOR INCOMPLETENESS 1 $88,470 22 $47,418 35 $47,124 3 $45,023 0 $0 15 $37,292 0 $0
Aggregated Statistics For Year 2003(Based on 6 full and 8 partial tracts) A) FHA, FSA/RHS & VA B) Conventional C) Refinancings D) Home Improvement Loans E) Loans on Dwellings For 5+ Families F) Non-occupant Loans on Number Average Value Number Average Value Number Average Value Number Average Value Number Average Value Number Average Value
LOANS ORIGINATED 59 $54,171 385 $46,350 403 $52,747 73 $9,771 9 $136,841 196 $32,178 APPLICATIONS APPROVED, NOT ACCEPTED 4 $53,238 46 $47,267 158 $49,288 27 $8,693 0 $0 46 $31,565 APPLICATIONS DENIED 13 $45,482 98 $38,719 475 $48,889 181 $10,123 0 $0 114 $30,638 APPLICATIONS WITHDRAWN 7 $43,214 23 $42,996 207 $56,417 10 $26,507 2 $220,500 18 $31,255 FILES CLOSED FOR INCOMPLETENESS 4 $35,950 15 $59,360 27 $57,307 0 $0 0 $0 8 $52,901
Aggregated Statistics For Year 2002(Based on 6 full and 8 partial tracts) A) FHA, FSA/RHS & VA B) Conventional C) Refinancings D) Home Improvement Loans E) Loans on Dwellings For 5+ Families F) Non-occupant Loans on Number Average Value Number Average Value Number Average Value Number Average Value Number Average Value Number Average Value
LOANS ORIGINATED 110 $46,758 342 $41,024 284 $47,231 54 $13,742 3 $102,760 188 $31,556 APPLICATIONS APPROVED, NOT ACCEPTED 2 $24,580 25 $50,408 89 $42,227 6 $14,195 0 $0 13 $43,899 APPLICATIONS DENIED 13 $42,587 76 $42,741 473 $47,871 85 $15,361 3 $88,740 57 $40,444 APPLICATIONS WITHDRAWN 6 $52,285 17 $46,688 173 $50,295 13 $15,751 0 $0 11 $39,185 FILES CLOSED FOR INCOMPLETENESS 4 $38,832 8 $58,054 32 $55,268 4 $38,755 0 $0 10 $48,609
Aggregated Statistics For Year 2001(Based on 6 full and 8 partial tracts) A) FHA, FSA/RHS & VA B) Conventional C) Refinancings D) Home Improvement Loans E) Loans on Dwellings For 5+ Families F) Non-occupant Loans on Number Average Value Number Average Value Number Average Value Number Average Value Number Average Value Number Average Value
LOANS ORIGINATED 159 $46,519 294 $40,682 270 $49,002 69 $21,256 4 $1,091,785 139 $38,332 APPLICATIONS APPROVED, NOT ACCEPTED 2 $71,000 45 $39,794 80 $44,137 26 $13,495 0 $0 19 $32,132 APPLICATIONS DENIED 13 $42,018 119 $39,295 473 $43,175 178 $14,199 1 $150,470 43 $56,018 APPLICATIONS WITHDRAWN 7 $47,913 26 $46,128 136 $50,438 22 $17,468 0 $0 20 $52,075 FILES CLOSED FOR INCOMPLETENESS 5 $40,502 4 $34,352 36 $46,981 1 $10,000 0 $0 3 $36,330
Aggregated Statistics For Year 2000(Based on 6 full and 8 partial tracts) A) FHA, FSA/RHS & VA B) Conventional C) Refinancings D) Home Improvement Loans E) Loans on Dwellings For 5+ Families F) Non-occupant Loans on Number Average Value Number Average Value Number Average Value Number Average Value Number Average Value Number Average Value
LOANS ORIGINATED 101 $44,898 327 $38,196 224 $37,755 84 $12,867 5 $343,992 170 $30,893 APPLICATIONS APPROVED, NOT ACCEPTED 4 $43,042 35 $35,906 91 $38,857 24 $15,135 0 $0 29 $24,000 APPLICATIONS DENIED 15 $52,308 152 $37,571 443 $37,937 114 $14,261 0 $0 49 $36,920 APPLICATIONS WITHDRAWN 8 $51,924 42 $43,252 162 $41,178 15 $19,564 0 $0 15 $49,503 FILES CLOSED FOR INCOMPLETENESS 2 $79,500 16 $33,320 33 $38,338 2 $18,450 0 $0 2 $39,500
Aggregated Statistics For Year 1999(Based on 4 full and 6 partial tracts) A) FHA, FSA/RHS & VA B) Conventional C) Refinancings D) Home Improvement Loans E) Loans on Dwellings For 5+ Families F) Non-occupant Loans on Number Average Value Number Average Value Number Average Value Number Average Value Number Average Value Number Average Value
LOANS ORIGINATED 58 $47,956 290 $43,518 225 $39,771 59 $15,281 3 $408,337 101 $35,885 APPLICATIONS APPROVED, NOT ACCEPTED 4 $44,738 45 $35,023 85 $42,730 22 $15,795 0 $0 14 $42,714 APPLICATIONS DENIED 9 $50,358 116 $39,205 261 $47,487 95 $12,172 0 $0 20 $66,676 APPLICATIONS WITHDRAWN 8 $51,196 50 $43,990 119 $39,144 8 $48,825 0 $0 8 $26,452 FILES CLOSED FOR INCOMPLETENESS 1 $25,900 14 $45,865 30 $50,876 0 $0 0 $0 2 $85,455
Private Mortgage Insurance Companies Aggregated Statistics For Year 2009(Based on 6 full and 6 partial tracts) A) Conventional B) Refinancings C) Non-occupant Loans on Number Average Value Number Average Value Number Average Value
LOANS ORIGINATED 7 $89,549 3 $114,357 0 $0 APPLICATIONS APPROVED, NOT ACCEPTED 6 $69,880 1 $48,000 0 $0 APPLICATIONS DENIED 5 $47,278 0 $0 4 $41,000 APPLICATIONS WITHDRAWN 0 $0 0 $0 0 $0 FILES CLOSED FOR INCOMPLETENESS 1 $41,000 1 $122,000 1 $41,000
Aggregated Statistics For Year 2008(Based on 6 full and 8 partial tracts) A) Conventional B) Refinancings C) Non-occupant Loans on Number Average Value Number Average Value Number Average Value
LOANS ORIGINATED 74 $65,185 21 $97,486 37 $60,975 APPLICATIONS APPROVED, NOT ACCEPTED 36 $76,164 10 $88,292 10 $57,911 APPLICATIONS DENIED 6 $85,325 3 $73,310 6 $81,248 APPLICATIONS WITHDRAWN 1 $62,000 1 $53,000 1 $62,000 FILES CLOSED FOR INCOMPLETENESS 7 $64,473 3 $85,483 5 $72,490
Aggregated Statistics For Year 2007(Based on 6 full and 8 partial tracts) A) Conventional B) Refinancings C) Non-occupant Loans on Number Average Value Number Average Value Number Average Value
LOANS ORIGINATED 271 $68,404 35 $57,489 57 $54,624 APPLICATIONS APPROVED, NOT ACCEPTED 41 $69,010 12 $78,475 13 $51,882 APPLICATIONS DENIED 10 $87,118 0 $0 3 $65,647 APPLICATIONS WITHDRAWN 12 $71,263 6 $76,438 1 $64,000 FILES CLOSED FOR INCOMPLETENESS 1 $58,600 0 $0 0 $0
Aggregated Statistics For Year 2006(Based on 6 full and 8 partial tracts) A) Conventional B) Refinancings C) Non-occupant Loans on Number Average Value Number Average Value Number Average Value
LOANS ORIGINATED 278 $59,648 17 $81,457 93 $48,010 APPLICATIONS APPROVED, NOT ACCEPTED 34 $62,170 5 $61,376 11 $48,901 APPLICATIONS DENIED 12 $117,985 0 $0 8 $67,365 APPLICATIONS WITHDRAWN 22 $57,933 5 $82,344 10 $57,671 FILES CLOSED FOR INCOMPLETENESS 0 $0 0 $0 0 $0
Aggregated Statistics For Year 2005(Based on 6 full and 8 partial tracts) A) Conventional B) Refinancings C) Non-occupant Loans on Number Average Value Number Average Value Number Average Value
LOANS ORIGINATED 277 $54,956 30 $52,046 121 $47,047 APPLICATIONS APPROVED, NOT ACCEPTED 46 $52,917 5 $51,346 19 $40,520 APPLICATIONS DENIED 7 $40,921 1 $31,000 6 $40,237 APPLICATIONS WITHDRAWN 17 $56,491 2 $42,275 9 $53,383 FILES CLOSED FOR INCOMPLETENESS 9 $74,867 0 $0 1 $100,000
Aggregated Statistics For Year 2004(Based on 6 full and 8 partial tracts) A) Conventional B) Refinancings C) Non-occupant Loans on Number Average Value Number Average Value Number Average Value
LOANS ORIGINATED 237 $48,947 34 $57,006 72 $37,918 APPLICATIONS APPROVED, NOT ACCEPTED 39 $52,722 10 $43,564 12 $35,519 APPLICATIONS DENIED 12 $48,906 1 $43,000 9 $47,073 APPLICATIONS WITHDRAWN 10 $47,587 1 $51,000 3 $53,170 FILES CLOSED FOR INCOMPLETENESS 5 $46,978 0 $0 1 $41,000
Aggregated Statistics For Year 2003(Based on 6 full and 8 partial tracts) A) Conventional B) Refinancings C) Non-occupant Loans on Number Average Value Number Average Value Number Average Value
LOANS ORIGINATED 200 $45,517 35 $65,233 41 $33,488 APPLICATIONS APPROVED, NOT ACCEPTED 20 $42,098 6 $73,967 4 $33,385 APPLICATIONS DENIED 3 $38,773 1 $62,000 2 $46,500 APPLICATIONS WITHDRAWN 6 $41,502 3 $83,333 0 $0 FILES CLOSED FOR INCOMPLETENESS 1 $43,000 0 $0 0 $0
Aggregated Statistics For Year 2002(Based on 6 full and 8 partial tracts) A) Conventional B) Refinancings C) Non-occupant Loans on Number Average Value Number Average Value Number Average Value
LOANS ORIGINATED 174 $45,765 29 $61,748 40 $33,604 APPLICATIONS APPROVED, NOT ACCEPTED 14 $44,916 8 $55,316 2 $36,500 APPLICATIONS DENIED 8 $37,802 5 $38,470 9 $39,400 APPLICATIONS WITHDRAWN 5 $49,574 2 $90,630 2 $57,500 FILES CLOSED FOR INCOMPLETENESS 5 $56,000 0 $0 2 $54,500
Aggregated Statistics For Year 2001(Based on 6 full and 8 partial tracts) A) Conventional B) Refinancings C) Non-occupant Loans on Number Average Value Number Average Value Number Average Value
LOANS ORIGINATED 125 $45,673 36 $48,891 21 $30,567 APPLICATIONS APPROVED, NOT ACCEPTED 12 $45,558 12 $56,223 1 $28,000 APPLICATIONS DENIED 5 $40,070 1 $47,000 3 $34,137 APPLICATIONS WITHDRAWN 5 $45,868 0 $0 2 $40,000 FILES CLOSED FOR INCOMPLETENESS 2 $24,905 0 $0 0 $0
Aggregated Statistics For Year 2000(Based on 6 full and 8 partial tracts) A) Conventional B) Refinancings C) Non-occupant Loans on Number Average Value Number Average Value Number Average Value
LOANS ORIGINATED 98 $41,705 28 $44,217 15 $30,099 APPLICATIONS APPROVED, NOT ACCEPTED 2 $74,500 3 $70,207 1 $17,200 APPLICATIONS DENIED 3 $35,960 3 $85,353 1 $33,000 APPLICATIONS WITHDRAWN 2 $59,960 0 $0 0 $0 FILES CLOSED FOR INCOMPLETENESS 3 $23,870 0 $0 0 $0
Aggregated Statistics For Year 1999(Based on 4 full and 6 partial tracts) A) Conventional B) Refinancings C) Non-occupant Loans on Number Average Value Number Average Value Number Average Value
LOANS ORIGINATED 56 $58,634 24 $57,983 2 $41,950 APPLICATIONS APPROVED, NOT ACCEPTED 8 $50,676 5 $58,346 0 $0 APPLICATIONS DENIED 7 $45,437 4 $62,272 2 $45,500 APPLICATIONS WITHDRAWN 3 $45,120 2 $40,330 1 $45,770 FILES CLOSED FOR INCOMPLETENESS 2 $52,815 3 $37,000 0 $0
2003 - 2018 National Fire Incident Reporting System (NFIRS) incidents See full 2006 National Fire Incident Reporting System statistics for zip code 19604, Pennsylvania
Most common first names in zip code 19604 among deceased individuals Name Count Lived (average)
John 243 75.4 years Mary 194 79.2 years William 192 75.1 years Robert 165 70.0 years Charles 158 75.1 years George 145 74.3 years Anna 138 79.8 years Helen 116 78.7 years Joseph 108 75.5 years Harry 107 75.9 years
Most common last names in zip code 19604 among deceased individuals Last name Count Lived (average)
Miller 103 75.6 years Smith 70 75.1 years Moyer 65 75.4 years Snyder 56 76.1 years Brown 42 74.1 years Fisher 34 79.2 years Schaeffer 28 76.3 years Wagner 25 73.4 years Boyer 24 77.2 years Wentzel 24 76.0 years
Businesses in zip code 19604
Name Count Name Count
CVS 1 MasterBrand Cabinets 1 Domino's Pizza 1 McDonald's 1 Haworth 1 Nike 1 Kroger 2 U-Haul 1
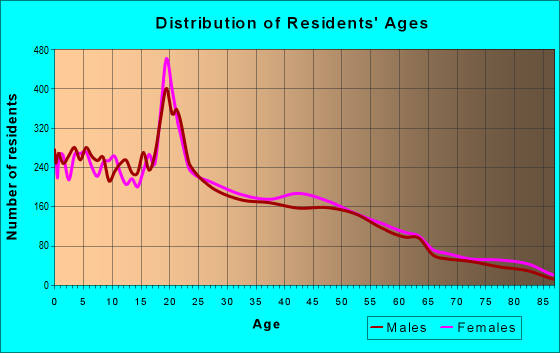
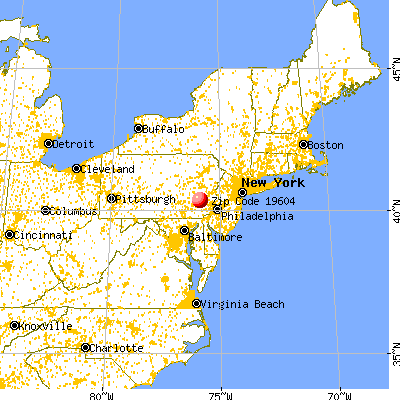


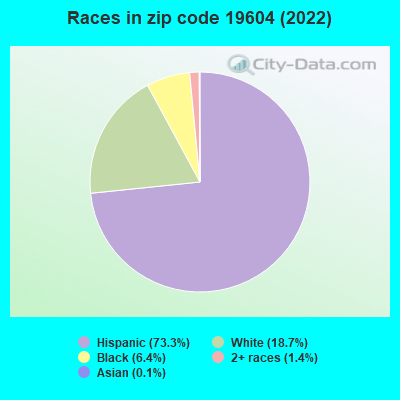


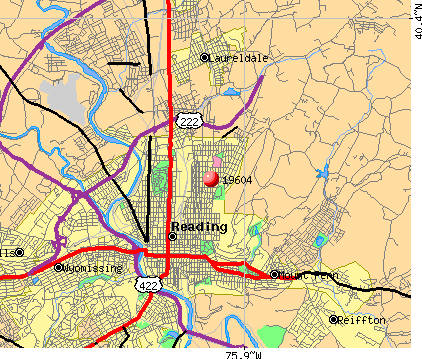 Nearest zip codes: 19602, 19601, 19611, 19560, 19605, 19606.
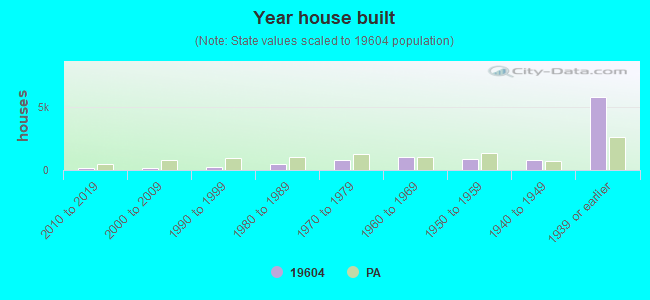
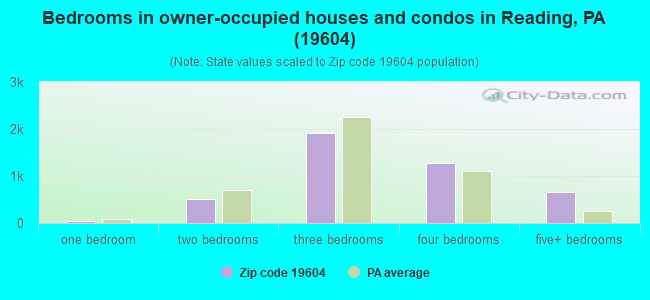
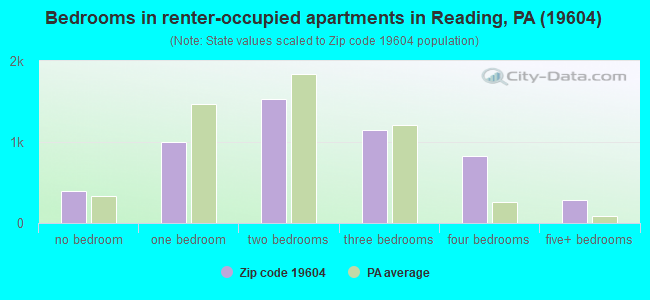
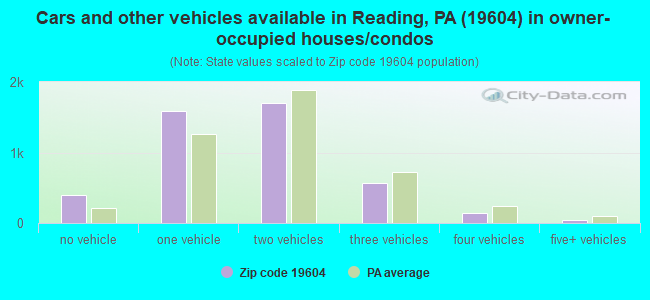


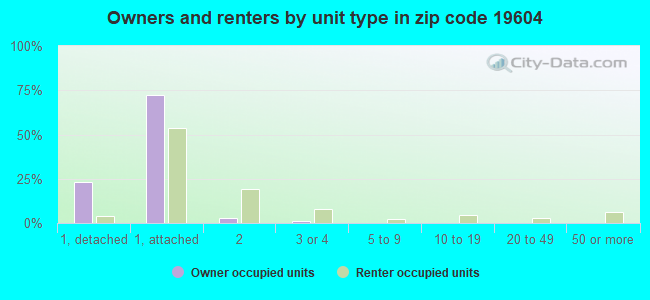


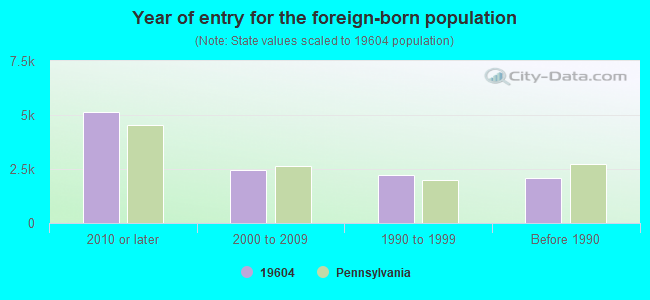


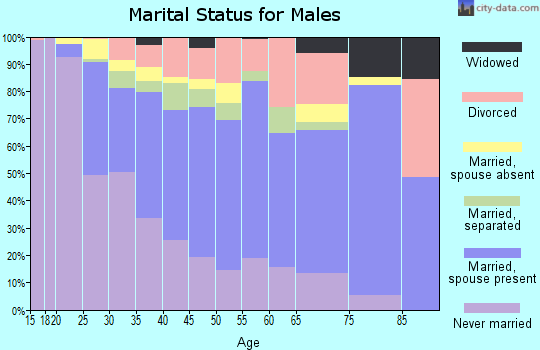
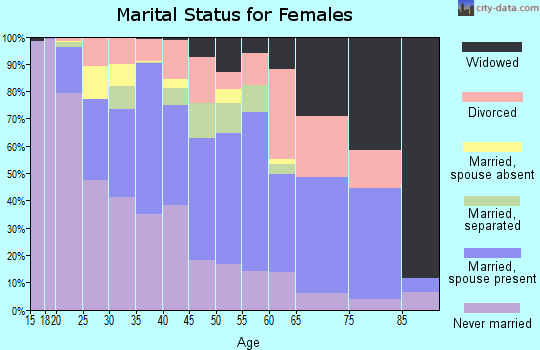
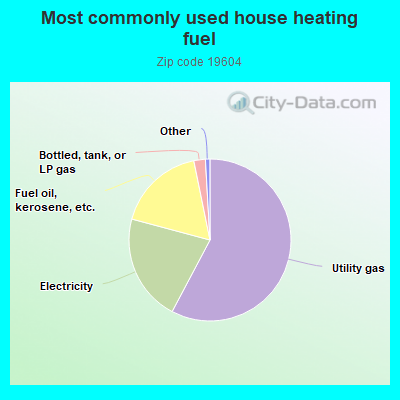
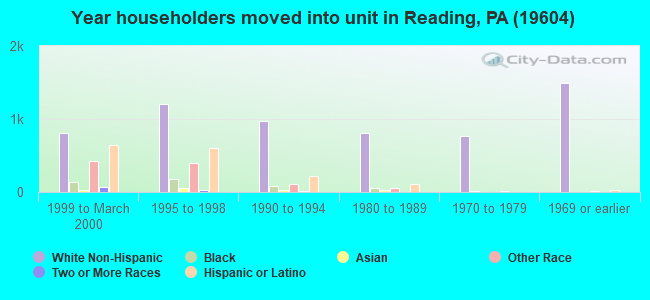
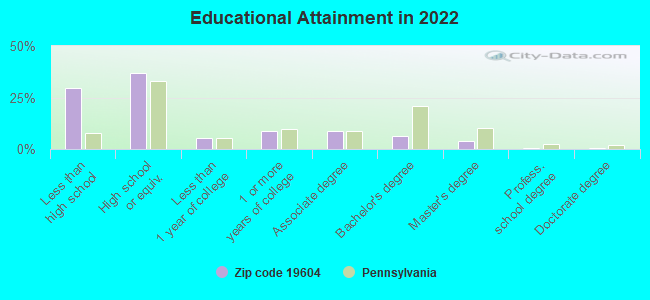
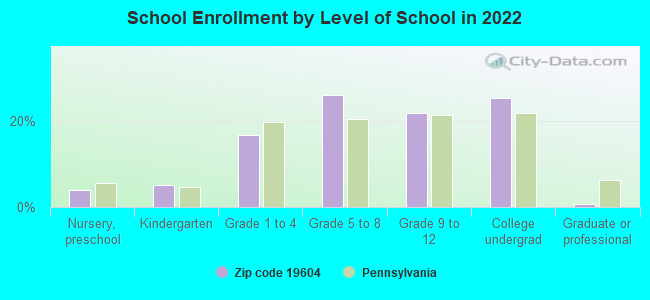
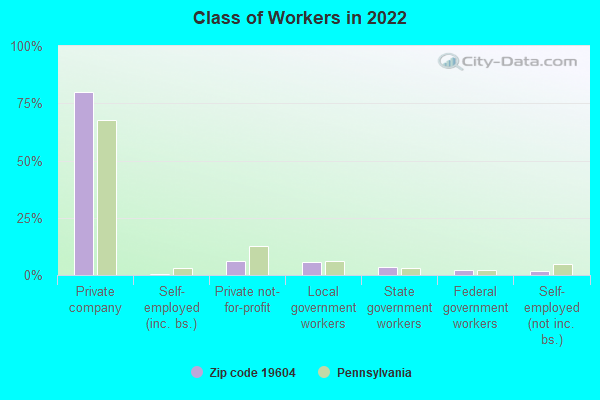
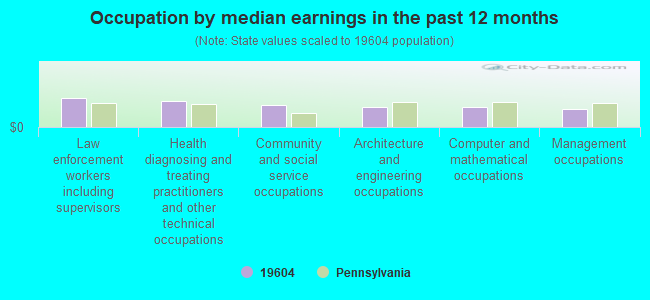
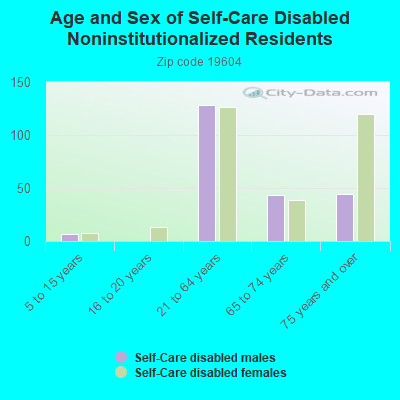
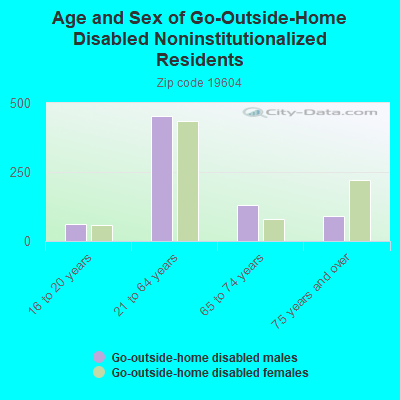
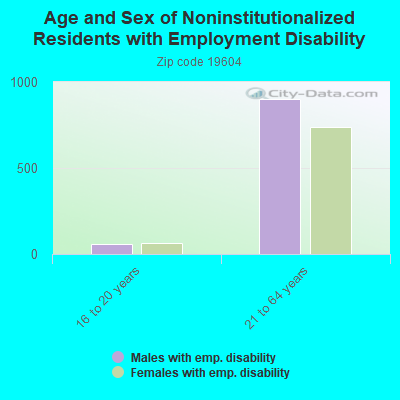
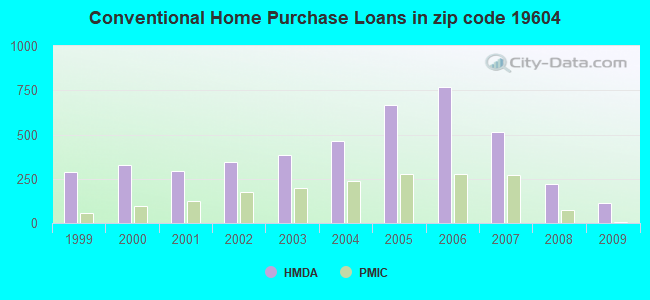
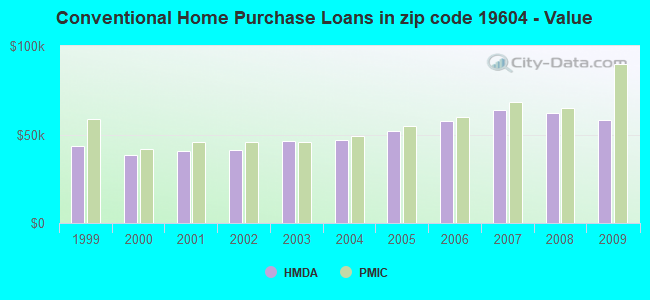
 Based on the data from the years 2003 - 2018 the average number of fire incidents per year is 16. The highest number of fire incidents - 85 took place in 2017, and the least - 0 in 2011. The data has a growing trend.
 When looking into fire subcategories, the most incidents belonged to: Structure Fires (68.0%), and Outside Fires (19.3%).