Estimated zip code population in 2022: 571 Zip code population in 2010: 451 Zip code population in 2000: 316
Houses and condos: 242 Renter-occupied apartments: 18
% of renters here:
8%
State:
26%
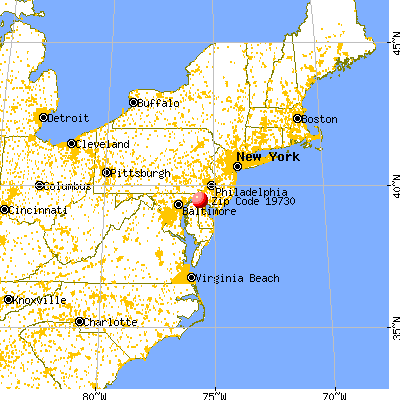
March 2022 cost of living index in zip code 19730: 101.8 (near average, U.S. average is 100)
Land area: 1.4 sq. mi. Water area: 0.1 sq. mi.
Population density: 418 people per square mile
(low).
OSM Map
General Map
Google Map
MSN Map
OSM Map
General Map
Google Map
MSN Map
OSM Map
General Map
Google Map
MSN Map
OSM Map
General Map
Google Map
MSN Map
Please wait while loading the map...
Real estate property taxes paid for housing units in 2022:
This zip code:
0.7% ($2,227)
Delaware:
0.5% ($1,635)
Median real estate property taxes paid for housing units with mortgages in 2022: $2,243 (0.6%) Median real estate property taxes paid for housing units with no mortgage in 2022: $2,104 (0.8%)
Business Search- 14 Million verified businesses
Males: 306
(53.6%)
Females: 265
(46.4%)
For population 25 years and over in 19730:
High school or higher: 97.1%
Bachelor's degree or higher: 43.7%
Graduate or professional degree: 12.7%
Unemployed: 0.3%
Mean travel time to work (commute): 34.2 minutes
For population 15 years and over in 19730:
Never married: 17.1%
Now married: 62.1%
Separated: 0.8%
Widowed: 5.8%
Divorced: 14.1%
Zip code 19730 compared to state average:
Unemployed percentage significantly below state average.
Black race population percentage below state average.
Hispanic race population percentage significantly below state average.
Foreign-born population percentage significantly below state average.
Renting percentage significantly below state average.
Length of stay since moving in significantly above state average.
Estimated median house/condo value in 2022: $332,891
19730:
$332,891
Delaware:
$337,200
According to our research of Delaware and other state lists, there was 1 registered sex offender living in 19730 zip code as of May 28, 2024. The ratio of all residents to sex offenders in zip code 19730 is 1,268 to 1. The ratio of registered sex offenders to all residents in this zip code is much lower than the state average.
Median resident age:
This zip code:
42.6 years
Delaware median age:
41.5 years
Average household size:
This zip code:
2.5 people
Delaware:
2.5 people
Averages for the 2004 tax year for zip code 19730, filed in 2005:
Average Adjusted Gross Income (AGI) in 2004: $51,958 (Individual Income Tax Returns)
Here:
$51,958
State:
$54,038
Salary/wage: $46,129 (reported on 81.1% of returns)
Here:
$46,129
State:
$44,625
(% of AGI for various income ranges: 90.8% for AGIs below $10k, 66.9% for AGIs $10k-25k, 72.7% for AGIs $25k-50k, 63.9% for AGIs $50k-75k, 79.9% for AGIs $75k-100k, 71.2% for AGIs over 100k)
Taxable interest for individuals: $1,800 (reported on 50.5% of returns)
This zip code:
$1,800
Delaware:
$1,734
(% of AGI for various income ranges: 5.6% for AGIs below $10k, 1.6% for AGIs $10k-25k, 3.0% for AGIs $25k-50k, 2.0% for AGIs $50k-75k, 0.2% for AGIs $75k-100k, 1.6% for AGIs over 100k)
Taxable dividends: $2,104 (reported on 31.3% of returns)
Here:
$2,104
State:
$5,362
(% of AGI for various income ranges: 1.8% for AGIs $10k-25k, 1.0% for AGIs $25k-50k, 1.4% for AGIs $50k-75k, 0.3% for AGIs $75k-100k, 1.8% for AGIs over 100k)
Net capital gain/loss: +$4,073 (reported on 17.9% of returns)
Here:
+$4,073
State:
+$17,328
(% of AGI for various income ranges: -2.8% for AGIs below $10k, -0.3% for AGIs $25k-50k, 0.9% for AGIs $50k-75k, 3.6% for AGIs over 100k)
Total itemized deductions: $17,983 (20% of AGI, reported on 37.5% of returns)
Here:
$17,983
State:
$19,441
Here:
20.3% of AGI
State:
19.3% of AGI
(% of AGI for various income ranges: 12.2% for AGIs $25k-50k, 14.3% for AGIs $50k-75k, 15.6% for AGIs $75k-100k, 13.7% for AGIs over 100k)
Charity contributions deductions: $3,292 (4% of AGI, reported on 34.5% of returns)
Here:
$3,292
State:
$3,727
Here:
3.6% of AGI
State:
3.5% of AGI
(% of AGI for various income ranges: 1.6% for AGIs $25k-50k, 2.4% for AGIs $50k-75k, 2.1% for AGIs $75k-100k, 2.8% for AGIs over 100k)
Total tax: $7,208 (reported on 83.1% of returns)
19730:
$7,208
State:
$8,958
(% of AGI for various income ranges: 2.0% for AGIs below $10k, 3.9% for AGIs $10k-25k, 7.4% for AGIs $25k-50k, 9.7% for AGIs $50k-75k, 11.1% for AGIs $75k-100k, 16.1% for AGIs over 100k)
Earned income credit: $2,000 (reported on 8.5% of returns)
Here:
$2,000
State:
$1,733
Percentage of individuals using paid preparers for their 2004 taxes: 61.9%
Here:
62%
State:
55%
(% for various income ranges: 59.6% for AGIs below $10k, 58.0% for AGIs $10k-25k, 59.8% for AGIs $25k-50k, 61.0% for AGIs $50k-75k, 76.5% for AGIs $75k-100k, 63.2% for AGIs over 100k)
Household received Food Stamps/SNAP in the past 12 months: 5 Household did not receive Food Stamps/SNAP in the past 12 months: 221
Women who had a birth in the past 12 months: 2 (2 now married, 0 unmarried) Women who did not have a birth in the past 12 months: 91 (64 now married, 29 unmarried)
Housing units in zip code 19730 with a mortgage: 147 (11 second mortgage, 11 both second mortgage and home equity loan) Houses without a mortgage: 5
Median monthly owner costs for units with a mortgage: $2,093 Median monthly owner costs for units without a mortgage: $442
Residents with income below the poverty level in 2022:
This zip code:
1.7%
Whole state:
9.4%
Residents with income below 50% of the poverty level in 2022:
This zip code:
0.7%
Whole state:
4.6%
Median number of rooms in houses and condos:
Here:
6.9
State:
6.9
Median number of rooms in apartments:
Here:
5.9
State:
4.4
Notable locations in this zip code not listed on our city pages
Notable locations in zip code 19730: Delaware State Police Troop 9 (A), Corbit - Calloway Memorial Library (B), Odessa Fire Company Station 24 (C). Display/hide their locations on the map
Size of family households: 42 2-persons, 74 3-persons, 25 4-persons, 6 5-persons, 3 6-persons
Size of nonfamily households: 64 1-person, 6 2-persons, 1 3-persons
135 married couples with children.
10 single-parent households (3 men, 7 women).
98.1% of residents of 19730 zip code speak English at home.
1.9% of residents speak Spanish at home (80% very well, 20% well).
0.4% of residents speak other Indo-European language at home (100% very well).
Foreign born population: 9 (1.7%) (79.5% of them are naturalized citizens)
This zip code:
1.7%
Whole state:
9.9%
22%Honduras
11%Bosnia and Herzegovina
38%English
14%Irish
5%American
5%Italian
4%German
3%Polish
2%Scandinavian
Year of entry for the foreign-born population
22010 or later
12000 to 2009
51990 to 1999
19Before 1990
Facilities with environmental interests located in this zip code:
HEALTHWAYS INC. (3146 NORTH DUPONT HIGHWAY in ODESSA, DE)
SUPERFUND (Superfund database) (Integrated Compliance Information System) - ICIS-03-1993-0293, FORMAL ENFORCEMENT ACTION Business SIC classification: MOTOR VEHICLE DEALERS (USED ONLY); AUTO AND HOME SUPPLY STORES Alternative names: HEALTHWAYS TRUCK SALVAGE
APPOQUINIMINK SCHOOL DISTRICT (118 SOUTH SIXTH ST. P.O. BOX 4010 in ODESSA, DE)
COMPLIANCE ACTIVITY (Tracking inspections of insecticide, fungicide, and rodenticide, and toxic substances) Alternative names: APPOQUINIMINK S.D.
DELAWARE STATE POLICE TROOP 9 (414 MAIN ST in ODESSA, DE)
Small Quantity Generators, between 100 kg and 1000 kg of hazardous waste/month (Resource Conservation and Recovery Act (tracking hazardous waste)) - notification Organizations: OPERNAME (CONTACT/OPERATOR)
, STATE OF DELAWARE (CONTACT/OWNER)
GENES BODY SHOP (US RTE 13 in ODESSA, DE)
Conditionally Exempt Small Quantity Generators, less than 100 kg/month of hazardous waste (Resource Conservation and Recovery Act (tracking hazardous waste)) - notification Organizations: OPERNAME (CONTACT/OPERATOR)
, GENE STEWART (CONTACT/OWNER)
Housing units lacking complete plumbing facilities: 1.5% Housing units lacking complete kitchen facilities: 3.0%
46.9%Fuel oil, kerosene, etc.
36.8%Utility gas
13.3%Electricity
2.8%Bottled, tank, or LP gas
0.9%Wood
Place of birth for U.S.-born residents:
This state: 268
Northeast: 166
Midwest: 19
South: 64
West: 20
71% of the 19730 zip code residents lived in the same house 5 years ago. Out of people who lived in different houses, 85% lived in this county. Out of people who lived in different counties, 50% lived in Delaware.
95% of the 19730 zip code residents lived in the same house 1 year ago. Out of people who lived in different houses, 43% moved from this county. Out of people who lived in different houses, 62% moved from different state.
Private vs. public school enrollment:
Students in private schools in grades 1 to 8 (elementary and middle school):
Here:
0.0%
Delaware:
11.5%
Students in private schools in grades 9 to 12 (high school): 15
Here:
42.9%
Delaware:
12.1%
Students in private undergraduate colleges:
Here:
0.0%
Delaware:
19.2%
Occupation by median earnings in the past 12 months ($)
109,229Architecture and engineering occupations
73,063Health diagnosing and treating practitioners and other technical occupations
70,690Construction and extraction occupations
65,324Business and financial operations occupations
64,366Management occupations
54,002Education, training, and library occupations
Companies with federal contracts located in this zip code:
MUMFORD & MILLER CONCRETE, INC (3272 S DUPONT PKWY in ODESSA, DE) : $690,557 in 2 contractsfrom 1999 to 2001
$637,000 with U.S. Army Corps of Engineers - civil program financing only for Construction of Structures and Facilities -- Restoration of real property. Signed on 1999-11-22. Completion date: 2000-06-08.
$53,557, same as above.Signed on 2001-03-29. Completion date: 2000-06-29.
TIDEWATER UTILITIES INC (603 MAIN ST in ODESSA, DE; small business) : $117,590 in 2 contractsfrom 2002 to 2003
$70,140 with Air Force for Water Services. Signed on 2003-09-19. Completion date: 2003-09-30.
$47,450, same as above.Signed on 2002-09-28. Completion date: 2002-09-30.
DIAMOND GROUP INC (ODESSA PROFESSIONAL PARK in ODESSA, DE) : $99,255 in 8 contractsfrom 1999 to 2001
Contracts for Other Architect and Engineering Services, Architect - Engineer Services (including landscaping, interior layout, and designing) by Air Force Signed by year:2000: $32,889; 2001: $61,366; 2002: $0; 2003: $0; 2004: $0; 2005: $0; 2006: $0.
Biggest contracts:
$81,069 with Air Force for Other Architect and Engineering Services. Signed on 2001-06-28. Completion date: 2001-06-28.
$21,576, same as above.Signed on 2000-09-23. Completion date: 2000-11-16.
$19,557, same as above.Signed on 2000-09-29. Completion date: 2000-11-24.
$5,000, same as above.Signed on 1999-12-03. Completion date: 1999-06-30.
Top industries in this zip code by the number of employees in 2005:
Professional, Scientific, and Technical Services: Offices of Lawyers (10-19 employees: 2 establishments, 1-4 employees: 2 establishments)
Construction: Plumbing, Heating, and Air-Conditioning Contractors (20-49: 1)
Information: Libraries and Archives (10-19: 1)
Wholesale Trade: Brick, Stone, and Related Construction Material Merchant Wholesalers (10-19: 1)
Accommodation and Food Services: Full-Service Restaurants (10-19: 1)
Health Care and Social Assistance: Child Day Care Services (5-9: 1, 1-4: 1)
Professional, Scientific, and Technical Services: Title Abstract and Settlement Offices (5-9: 1)
Wholesale Trade: Construction and Mining (except Oil Well) Machinery and Equipment Merchant Wholesalers (5-9: 1)
Construction: Structural Steel and Precast Concrete Contractors (5-9: 1)
Home Mortgage Disclosure Act Aggregated Statistics For Year 2009 (Based on 2 partial tracts)
A) FHA, FSA/RHS & VA Home Purchase Loans
B) Conventional Home Purchase Loans
C) Refinancings
D) Home Improvement Loans
F) Non-occupant Loans on < 5 Family Dwellings (A B C & D)
G) Loans On Manufactured Home Dwelling (A B C & D)
Number
Average Value
Number
Average Value
Number
Average Value
Number
Average Value
Number
Average Value
Number
Average Value
LOANS ORIGINATED
17
$245,414
6
$224,462
36
$233,824
2
$39,885
1
$315,800
1
$11,810
APPLICATIONS APPROVED, NOT ACCEPTED
0
$0
0
$0
3
$237,953
0
$0
0
$0
0
$0
APPLICATIONS DENIED
2
$226,845
1
$216,090
19
$243,107
3
$59,783
1
$72,550
1
$40,800
APPLICATIONS WITHDRAWN
3
$314,050
1
$172,270
9
$288,421
0
$0
1
$102,340
0
$0
FILES CLOSED FOR INCOMPLETENESS
1
$87,380
0
$0
2
$220,875
0
$0
0
$0
0
$0
Aggregated Statistics For Year 2008 (Based on 2 partial tracts)
A) FHA, FSA/RHS & VA Home Purchase Loans
B) Conventional Home Purchase Loans
C) Refinancings
D) Home Improvement Loans
F) Non-occupant Loans on < 5 Family Dwellings (A B C & D)
G) Loans On Manufactured Home Dwelling (A B C & D)
Number
Average Value
Number
Average Value
Number
Average Value
Number
Average Value
Number
Average Value
Number
Average Value
LOANS ORIGINATED
10
$261,127
14
$225,879
25
$215,457
4
$55,728
3
$169,423
1
$22,170
APPLICATIONS APPROVED, NOT ACCEPTED
1
$153,900
2
$178,040
5
$275,520
2
$82,855
0
$0
0
$0
APPLICATIONS DENIED
2
$336,530
5
$190,974
23
$221,751
6
$71,875
2
$143,925
1
$37,260
APPLICATIONS WITHDRAWN
1
$278,280
3
$256,410
8
$247,115
1
$86,200
1
$137,240
0
$0
FILES CLOSED FOR INCOMPLETENESS
1
$121,100
0
$0
2
$325,505
0
$0
1
$62,710
0
$0
Aggregated Statistics For Year 2007 (Based on 2 partial tracts)
A) FHA, FSA/RHS & VA Home Purchase Loans
B) Conventional Home Purchase Loans
C) Refinancings
D) Home Improvement Loans
F) Non-occupant Loans on < 5 Family Dwellings (A B C & D)
G) Loans On Manufactured Home Dwelling (A B C & D)
Number
Average Value
Number
Average Value
Number
Average Value
Number
Average Value
Number
Average Value
Number
Average Value
LOANS ORIGINATED
4
$235,045
44
$202,519
31
$210,161
8
$52,906
7
$186,117
2
$33,585
APPLICATIONS APPROVED, NOT ACCEPTED
0
$0
5
$221,676
9
$184,686
2
$36,275
1
$244,160
0
$0
APPLICATIONS DENIED
0
$0
7
$201,054
29
$222,112
10
$87,169
3
$146,943
1
$23,880
APPLICATIONS WITHDRAWN
0
$0
7
$215,074
13
$231,498
1
$272,900
1
$210,970
0
$0
FILES CLOSED FOR INCOMPLETENESS
0
$0
2
$171,740
5
$260,668
0
$0
1
$62,980
0
$0
Aggregated Statistics For Year 2006 (Based on 2 partial tracts)
A) FHA, FSA/RHS & VA Home Purchase Loans
B) Conventional Home Purchase Loans
C) Refinancings
D) Home Improvement Loans
F) Non-occupant Loans on < 5 Family Dwellings (A B C & D)
G) Loans On Manufactured Home Dwelling (A B C & D)
Number
Average Value
Number
Average Value
Number
Average Value
Number
Average Value
Number
Average Value
Number
Average Value
LOANS ORIGINATED
3
$177,077
43
$166,676
44
$194,835
11
$57,013
12
$126,028
1
$48,540
APPLICATIONS APPROVED, NOT ACCEPTED
0
$0
6
$184,817
9
$192,762
2
$33,390
1
$233,800
1
$34,110
APPLICATIONS DENIED
0
$0
11
$163,439
32
$225,438
12
$58,657
6
$105,747
1
$24,010
APPLICATIONS WITHDRAWN
0
$0
6
$190,983
22
$225,330
2
$113,620
2
$120,900
0
$0
FILES CLOSED FOR INCOMPLETENESS
0
$0
2
$148,650
5
$263,030
0
$0
0
$0
0
$0
Aggregated Statistics For Year 2005 (Based on 2 partial tracts)
A) FHA, FSA/RHS & VA Home Purchase Loans
B) Conventional Home Purchase Loans
C) Refinancings
D) Home Improvement Loans
F) Non-occupant Loans on < 5 Family Dwellings (A B C & D)
G) Loans On Manufactured Home Dwelling (A B C & D)
Number
Average Value
Number
Average Value
Number
Average Value
Number
Average Value
Number
Average Value
Number
Average Value
LOANS ORIGINATED
5
$194,544
82
$212,030
49
$187,474
11
$62,499
10
$141,434
2
$24,730
APPLICATIONS APPROVED, NOT ACCEPTED
0
$0
6
$209,483
6
$185,102
3
$33,630
1
$53,660
1
$64,160
APPLICATIONS DENIED
0
$0
10
$167,936
26
$172,856
9
$44,054
3
$105,923
2
$39,620
APPLICATIONS WITHDRAWN
0
$0
7
$197,194
18
$170,013
3
$118,737
1
$129,100
0
$0
FILES CLOSED FOR INCOMPLETENESS
0
$0
2
$213,395
8
$226,681
1
$77,280
0
$0
0
$0
Aggregated Statistics For Year 2004 (Based on 2 partial tracts)
A) FHA, FSA/RHS & VA Home Purchase Loans
B) Conventional Home Purchase Loans
C) Refinancings
D) Home Improvement Loans
F) Non-occupant Loans on < 5 Family Dwellings (A B C & D)
G) Loans On Manufactured Home Dwelling (A B C & D)
Number
Average Value
Number
Average Value
Number
Average Value
Number
Average Value
Number
Average Value
Number
Average Value
LOANS ORIGINATED
5
$154,056
50
$190,996
38
$161,704
7
$55,704
7
$114,426
1
$12,990
APPLICATIONS APPROVED, NOT ACCEPTED
0
$0
4
$172,988
6
$155,887
1
$50,250
0
$0
0
$0
APPLICATIONS DENIED
0
$0
7
$133,824
20
$159,612
7
$28,096
3
$79,290
2
$30,765
APPLICATIONS WITHDRAWN
0
$0
6
$167,215
11
$159,408
1
$69,540
0
$0
0
$0
FILES CLOSED FOR INCOMPLETENESS
0
$0
1
$232,880
7
$186,247
0
$0
1
$66,780
0
$0
Aggregated Statistics For Year 2003 (Based on 2 partial tracts)
A) FHA, FSA/RHS & VA Home Purchase Loans
B) Conventional Home Purchase Loans
C) Refinancings
D) Home Improvement Loans
F) Non-occupant Loans on < 5 Family Dwellings (A B C & D)
Number
Average Value
Number
Average Value
Number
Average Value
Number
Average Value
Number
Average Value
LOANS ORIGINATED
5
$134,402
22
$138,171
52
$164,961
4
$21,485
4
$88,625
APPLICATIONS APPROVED, NOT ACCEPTED
1
$81,480
3
$124,117
9
$131,288
1
$27,680
0
$0
APPLICATIONS DENIED
0
$0
4
$92,038
24
$141,947
5
$28,654
1
$59,960
APPLICATIONS WITHDRAWN
1
$88,820
3
$127,397
12
$158,063
1
$12,730
1
$26,630
FILES CLOSED FOR INCOMPLETENESS
1
$70,450
0
$0
3
$204,890
0
$0
0
$0
Aggregated Statistics For Year 1999 (Based on 1 partial tract)
Detailed PMIC statistics for the following Tracts:0166.04
2002 - 2018 National Fire Incident Reporting System (NFIRS) incidents
Based on the data from the years 2002 - 2018 the average number of fires per year is 28. The highest number of reported fires - 52 took place in 2002, and the least - 6 in 2018. The data has a decreasing trend.
When looking into fire subcategories, the most incidents belonged to: Structure Fires (38.1%), and Outside Fires (25.5%).
Fire incident types reported to NFIRS in Zip Code 19730


 Nearest zip codes: 19709, 19734, 19731, 19733, 19706, 19701.


 Based on the data from the years 2002 - 2018 the average number of fires per year is 28. The highest number of reported fires - 52 took place in 2002, and the least - 6 in 2018. The data has a decreasing trend.
 When looking into fire subcategories, the most incidents belonged to: Structure Fires (38.1%), and Outside Fires (25.5%).