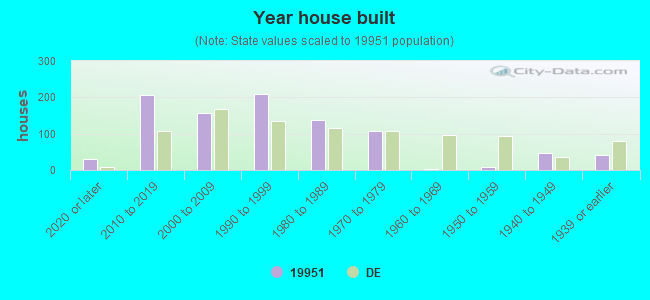
Estimated zip code population in 2022: 2,227 Zip code population in 2010: 1,733 Zip code population in 2000: 973
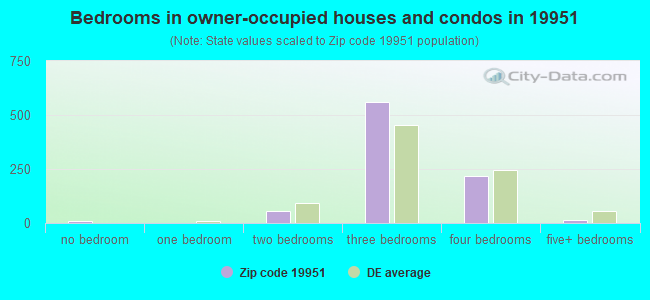
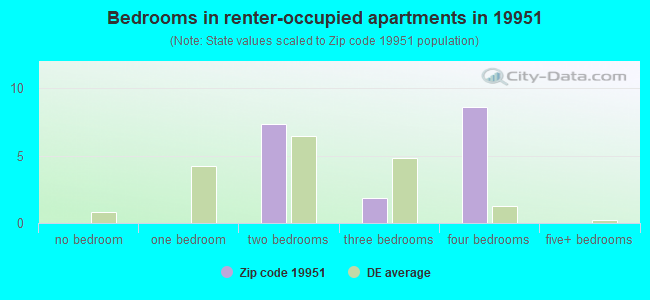
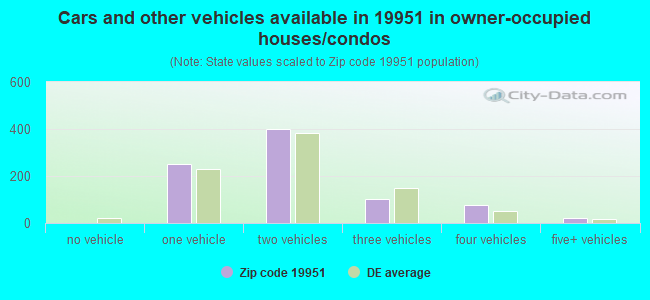
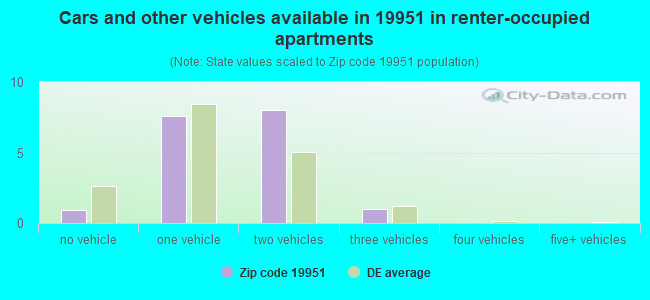
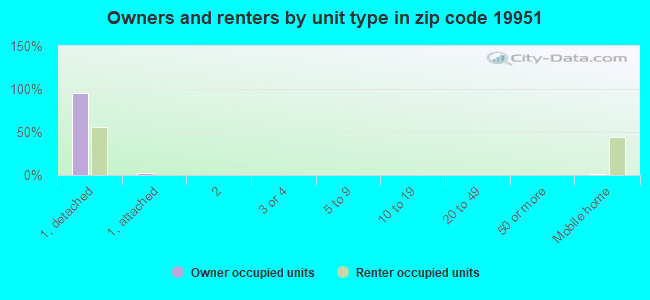
Houses and condos: 942 Renter-occupied apartments: 17
% of renters here:
2%
State:
26%
March 2022 cost of living index in zip code 19951: 81.9 (low, U.S. average is 100)
Land area: 10.1 sq. mi. Water area: 0.1 sq. mi.
Population density: 220 people per square mile
(very low).
OSM Map
General Map
Google Map
MSN Map
OSM Map
General Map
Google Map
MSN Map
OSM Map
General Map
Google Map
MSN Map
OSM Map
General Map
Google Map
MSN Map
Please wait while loading the map...
Real estate property taxes paid for housing units in 2022:
This zip code:
0.2% ($846)
Delaware:
0.5% ($1,635)
Median real estate property taxes paid for housing units with mortgages in 2022: $805 (0.2%) Median real estate property taxes paid for housing units with no mortgage in 2022: $957 (0.3%)
Business Search- 14 Million verified businesses
Males: 1,199
(53.9%)
Females: 1,027
(46.1%)
For population 25 years and over in 19951:
High school or higher: 92.5%
Bachelor's degree or higher: 26.2%
Graduate or professional degree: 11.0%
Unemployed: 6.3%
Mean travel time to work (commute): 25.6 minutes
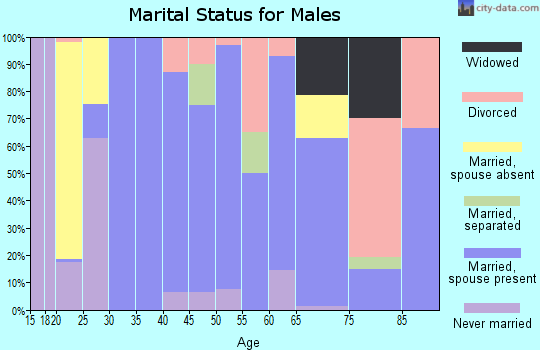
For population 15 years and over in 19951:
Never married: 19.5%
Now married: 65.1%
Separated: 0.5%
Widowed: 6.4%
Divorced: 8.5%
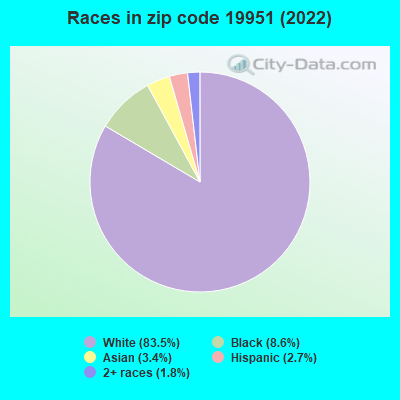
Zip code 19951 compared to state average:
Black race population percentage below state average.
Hispanic race population percentage significantly below state average.
Median age significantly above state average.
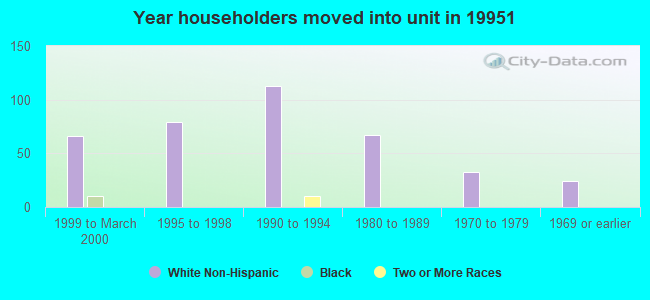
Renting percentage significantly below state average.
Length of stay since moving in significantly above state average.
Estimated median house/condo value in 2022: $371,119
19951:
$371,119
Delaware:
$337,200
According to our research of Delaware and other state lists, there were 5 registered sex offenders living in 19951 zip code as of May 28, 2024. The ratio of all residents to sex offenders in zip code 19951 is 380 to 1. The ratio of registered sex offenders to all residents in this zip code is near the state average.
Median resident age:
This zip code:
53.8 years
Delaware median age:
41.5 years
Average household size:
This zip code:
2.6 people
Delaware:
2.5 people
Averages for the 2020 tax year for zip code 19951, filed in 2021:
Average Adjusted Gross Income (AGI) in 2020: $77,742 (Individual Income Tax Returns)
Here:
$77,742
State:
$74,239
Salary/wage: $62,404 (reported on 68.5% of returns)
Here:
$62,404
State:
$59,982
(% of AGI for various income ranges: 1321.1% for AGIs below $25k, 3260.6% for AGIs $25k-50k, 5137.0% for AGIs $50k-75k, 7138.3% for AGIs $75k-100k, 12352.9% for AGIs $100k-200k)
Taxable interest for individuals: $1,593 (reported on 39.6% of returns)
This zip code:
$1,593
Delaware:
$1,604
(% of AGI for various income ranges: 22.8% for AGIs below $25k, 47.5% for AGIs $25k-50k, 94.0% for AGIs $50k-75k, 145.0% for AGIs $75k-100k, 226.4% for AGIs $100k-200k)
Ordinary dividends: $4,232 (reported on 25.2% of returns)
Here:
$4,232
State:
$8,303
(% of AGI for various income ranges: 55.0% for AGIs below $25k, 99.4% for AGIs $25k-50k, 83.0% for AGIs $50k-75k, 338.3% for AGIs $75k-100k, 349.3% for AGIs $100k-200k)
Net capital gain/loss in AGI: +$10,562 (reported on 23.4% of returns)
Here:
+$10,562
State:
+$19,461
(% of AGI for various income ranges: 3.3% for AGIs below $25k, 39.4% for AGIs $25k-50k, 94.0% for AGIs $50k-75k, 423.3% for AGIs $75k-100k, 689.3% for AGIs $100k-200k)
Profit/loss from business: +$13,921 (reported on 17.1% of returns)
Here:
+$13,921
State:
+$13,079
(% of AGI for various income ranges: 270.6% for AGIs below $25k, 114.4% for AGIs $25k-50k, 827.0% for AGIs $50k-75k, 820.0% for AGIs $100k-200k)
Taxable individual retirement arrangement distribution: $20,035 (reported on 18.0% of returns)
19951:
$20,035
Delaware:
$22,095
(% of AGI for various income ranges: 348.8% for AGIs $25k-50k, 631.0% for AGIs $50k-75k, 898.3% for AGIs $75k-100k, 1627.9% for AGIs $100k-200k)
Total itemized deductions: $32,467 (reported on 10.8% of returns)
Here:
$32,467
State:
$30,452
(% of AGI for various income ranges: 1087.0% for AGIs $50k-75k, 1109.3% for AGIs $100k-200k)
Charity contributions: $5,400 (reported on 8.1% of returns)
Here:
$5,400
State:
$8,999
(% of AGI for various income ranges: 36.9% for AGIs $25k-50k, 140.0% for AGIs $100k-200k)
Taxes paid: $7,125 (reported on 10.8% of returns)
19951:
$7,125
State:
$7,483
(% of AGI for various income ranges: 171.0% for AGIs $50k-75k, 277.9% for AGIs $100k-200k)
Earned income credit: $1,990 (reported on 9.0% of returns)
Here:
$1,990
State:
$2,247
(% of AGI for various income ranges: 72.8% for AGIs below $25k, 42.5% for AGIs $25k-50k)
Percentage of individuals using paid preparers for their 2020 taxes: 88.3%
Here:
88%
State:
92%
(% for various income ranges: 90.3% for AGIs below $25k, 86.4% for AGIs $25k-50k, 87.5% for AGIs $50k-75k, 90.9% for AGIs $75k-100k, 87.5% for AGIs $100k-200k, 85.7% for AGIs over 200k)
Averages for the 2012 tax year for zip code 19951, filed in 2013:
Average Adjusted Gross Income (AGI) in 2012: $54,233 (Individual Income Tax Returns)
Here:
$54,233
State:
$61,157
Salary/wage: $42,150 (reported on 76.5% of returns)
Here:
$42,150
State:
$50,642
(% of AGI for various income ranges: 67.1% for AGIs below $25k, 63.3% for AGIs $25k-50k, 55.8% for AGIs $50k-75k, 51.9% for AGIs $75k-100k, 100.5% for AGIs $100k-200k)
Taxable interest for individuals: $1,197 (reported on 38.3% of returns)
This zip code:
$1,197
Delaware:
$1,571
(% of AGI for various income ranges: 1.9% for AGIs below $25k, 1.1% for AGIs $25k-50k, 0.5% for AGIs $50k-75k, 1.0% for AGIs $75k-100k, 1.0% for AGIs $100k-200k)
Ordinary dividends: $3,330 (reported on 24.7% of returns)
Here:
$3,330
State:
$6,610
(% of AGI for various income ranges: 2.5% for AGIs below $25k, 2.6% for AGIs $25k-50k, 1.1% for AGIs $50k-75k, 1.5% for AGIs $75k-100k, 1.8% for AGIs $100k-200k)
Net capital gain/loss in AGI: +$1,127 (reported on 18.5% of returns)
Here:
+$1,127
State:
+$11,439
(% of AGI for various income ranges: 2.0% for AGIs $100k-200k)
Profit/loss from business: +$10,185 (reported on 16.0% of returns)
Here:
+$10,185
State:
+$12,773
(% of AGI for various income ranges: 6.6% for AGIs below $25k, 5.0% for AGIs $25k-50k, 5.1% for AGIs $50k-75k, 4.5% for AGIs $75k-100k)
Taxable individual retirement arrangement distribution: $17,529 (reported on 17.3% of returns)
19951:
$17,529
Delaware:
$16,790
(% of AGI for various income ranges: 4.2% for AGIs below $25k, 4.2% for AGIs $25k-50k, 5.2% for AGIs $50k-75k, 5.9% for AGIs $75k-100k, 10.7% for AGIs $100k-200k)
Total itemized deductions: $21,588 (22% of AGI, reported on 32.1% of returns)
Here:
$21,588
State:
$23,216
Here:
22.4% of AGI
State:
19.8% of AGI
(% of AGI for various income ranges: 10.6% for AGIs below $25k, 8.5% for AGIs $25k-50k, 13.1% for AGIs $50k-75k, 14.0% for AGIs $75k-100k, 14.5% for AGIs $100k-200k, 14.0% for AGIs over 200k)
Charity contributions: $2,295 (reported on 23.5% of returns)
Here:
$2,295
State:
$3,791
(% of AGI for various income ranges: 1.1% for AGIs $25k-50k, 1.3% for AGIs $50k-75k, 1.1% for AGIs $75k-100k, 1.6% for AGIs $100k-200k)
Taxes paid: $5,919 (reported on 32.1% of returns)
19951:
$5,919
State:
$8,129
(% of AGI for various income ranges: 1.6% for AGIs $25k-50k, 2.5% for AGIs $50k-75k, 3.4% for AGIs $75k-100k, 4.6% for AGIs $100k-200k, 6.8% for AGIs over 200k)
Earned income credit: $1,755 (reported on 13.6% of returns)
Here:
$1,755
State:
$2,231
(% of AGI for various income ranges: 4.0% for AGIs below $25k, 0.6% for AGIs $25k-50k)
Percentage of individuals using paid preparers for their 2012 taxes: 51.9%
Here:
52%
State:
47%
(% for various income ranges: 45.2% for AGIs below $25k, 52.6% for AGIs $25k-50k, 53.8% for AGIs $50k-75k, 50.0% for AGIs $75k-100k, 87.5% for AGIs $100k-200k)
Averages for the 2004 tax year for zip code 19951, filed in 2005:
Average Adjusted Gross Income (AGI) in 2004: $40,428 (Individual Income Tax Returns)
Here:
$40,428
State:
$54,038
Salary/wage: $34,436 (reported on 77.6% of returns)
Here:
$34,436
State:
$44,625
(% of AGI for various income ranges: 87.8% for AGIs below $10k, 60.4% for AGIs $10k-25k, 71.5% for AGIs $25k-50k, 66.0% for AGIs $50k-75k, 76.5% for AGIs $75k-100k, 57.2% for AGIs over 100k)
Taxable interest for individuals: $1,514 (reported on 46.1% of returns)
This zip code:
$1,514
Delaware:
$1,734
(% of AGI for various income ranges: 6.9% for AGIs below $10k, 4.8% for AGIs $10k-25k, 1.5% for AGIs $25k-50k, 2.3% for AGIs $50k-75k, 0.3% for AGIs $75k-100k, 0.6% for AGIs over 100k)
Taxable dividends: $2,503 (reported on 26.0% of returns)
Here:
$2,503
State:
$5,362
(% of AGI for various income ranges: 1.3% for AGIs below $10k, 2.5% for AGIs $10k-25k, 0.9% for AGIs $25k-50k, 3.8% for AGIs $50k-75k, 0.2% for AGIs $75k-100k, 1.0% for AGIs over 100k)
Net capital gain/loss: +$9,638 (reported on 17.4% of returns)
Here:
+$9,638
State:
+$17,328
(% of AGI for various income ranges: -0.9% for AGIs $10k-25k, 1.2% for AGIs $25k-50k, 2.2% for AGIs $50k-75k, 1.1% for AGIs $75k-100k, 12.1% for AGIs over 100k)
Profit/loss from business: +$7,056 (reported on 17.9% of returns)
Here:
+$7,056
State:
+$12,191
(% of AGI for various income ranges: 5.4% for AGIs below $10k, 9.0% for AGIs $10k-25k, 4.1% for AGIs $25k-50k, 4.8% for AGIs $50k-75k)
IRA payment deduction: $2,333 (reported on 2.5% of returns)
19951:
$2,333
Delaware:
$3,027
Total itemized deductions: $17,198 (26% of AGI, reported on 31.8% of returns)
Here:
$17,198
State:
$19,441
Here:
25.6% of AGI
State:
19.3% of AGI
(% of AGI for various income ranges: 11.3% for AGIs $10k-25k, 14.4% for AGIs $25k-50k, 14.1% for AGIs $50k-75k, 12.9% for AGIs $75k-100k, 14.7% for AGIs over 100k)
Charity contributions deductions: $2,321 (3% of AGI, reported on 26.9% of returns)
Here:
$2,321
State:
$3,727
Here:
3.3% of AGI
State:
3.5% of AGI
(% of AGI for various income ranges: 1.3% for AGIs $10k-25k, 1.9% for AGIs $25k-50k, 1.5% for AGIs $50k-75k, 1.2% for AGIs $75k-100k, 1.6% for AGIs over 100k)
Total tax: $4,977 (reported on 78.8% of returns)
19951:
$4,977
State:
$8,958
(% of AGI for various income ranges: 2.6% for AGIs below $10k, 4.8% for AGIs $10k-25k, 6.8% for AGIs $25k-50k, 8.8% for AGIs $50k-75k, 10.9% for AGIs $75k-100k, 14.7% for AGIs over 100k)
Earned income credit: $1,589 (reported on 14.9% of returns)
Here:
$1,589
State:
$1,733
Percentage of individuals using paid preparers for their 2004 taxes: 60.0%
Here:
60%
State:
55%
(% for various income ranges: 42.6% for AGIs below $10k, 60.1% for AGIs $10k-25k, 61.5% for AGIs $25k-50k, 65.9% for AGIs $50k-75k, 61.0% for AGIs $75k-100k, 80.0% for AGIs over 100k)
Household received Food Stamps/SNAP in the past 12 months: 89 Household did not receive Food Stamps/SNAP in the past 12 months: 759
Women who did not have a birth in the past 12 months: 206 (137 now married, 72 unmarried)
Housing units in zip code 19951 with a mortgage: 594 (111 second mortgage, 110 both second mortgage and home equity loan) Houses without a mortgage: 11
Median monthly owner costs for units with a mortgage: $1,522 Median monthly owner costs for units without a mortgage: $369
Residents with income below the poverty level in 2022:
This zip code:
4.1%
Whole state:
9.4%
Residents with income below 50% of the poverty level in 2022:
This zip code:
1.9%
Whole state:
4.6%
Median number of rooms in houses and condos:
Here:
6.8
State:
6.9
Median number of rooms in apartments:
Here:
6.0
State:
4.4
Notable locations in this zip code not listed on our city pages
Churches in zip code 19951 include: Saint Georges Church (A), Indian Mission Church (B), Seventh Day Adventist Church (C). Display/hide their locations on the map
Size of family households: 334 2-persons, 144 3-persons, 169 4-persons, 2 5-persons, 4 6-persons, 3 7-or-more-persons
Size of nonfamily households: 181 1-person, 4 2-persons, 3 3-persons
201 married couples with children.
23 single-parent households (23 women).
92.2% of residents of 19951 zip code speak English at home.
2.3% of residents speak Spanish at home (90% very well, 10% well).
4.0% of residents speak other Indo-European language at home (68% very well, 32% well).
0.7% of residents speak Asian or Pacific Island language at home (25% very well, 12% well, 62% not well).
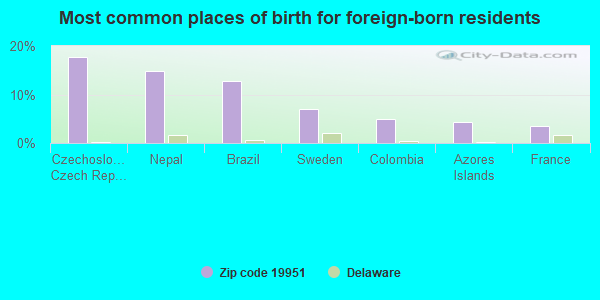
Foreign born population: 147 (6.6%) (73.3% of them are naturalized citizens)
This zip code:
6.6%
Whole state:
9.9%
18%Czechoslovakia (includes Czech Republic and Slovakia)
15%Nepal
13%Brazil
7%Sweden
5%Colombia
4%Azores Islands
4%France
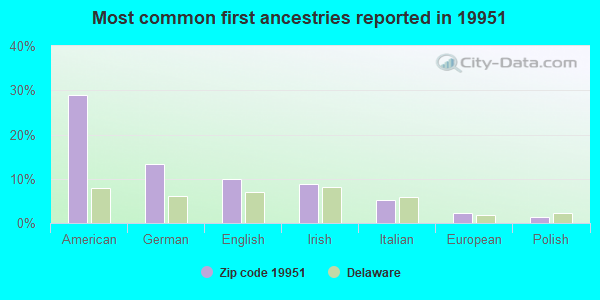
29%American
13%German
10%English
9%Irish
5%Italian
2%European
1%Polish
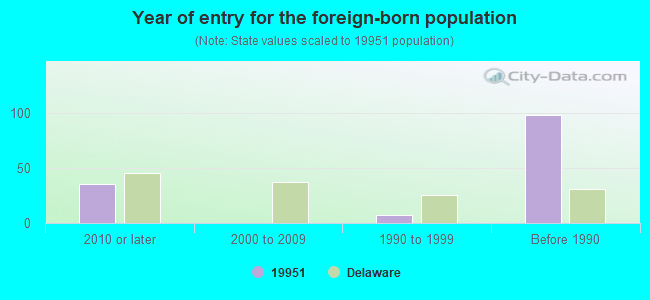
Year of entry for the foreign-born population
352010 or later
02000 to 2009
71990 to 1999
98Before 1990
Facilities with environmental interests located in this zip code:
ALLEN FAMILY FOODS INCORPORATED HARBESON (ROUTE 5 in HARBESON, DE)
AIR SYNTHETIC MINOR (AIRS/AFS) (Integrated Compliance Information System) - ICIS-03-2001-0016, FORMAL ENFORCEMENT ACTION CRITERIA AND HAZARDOUS AIR POLLUTANT INVENTORY (Inventory of air pollution sources) National Pollutant Discharge Elimination System MAJOR (Tracking pollutant discharge elimination systems) - permit Small Quantity Generators, between 100 kg and 1000 kg of hazardous waste/month (Resource Conservation and Recovery Act (tracking hazardous waste)) - notification TRI REPORTER (Tracking of toxic chemicals releasing facilities) Business SIC classification: POULTRY SLAUGHTERING AND PROCESSING Organizations: OPERNAME (CONTACT/OPERATOR)
, CARGILL INC (CONTACT/OWNER)
Alternative names: CARGILL POULTRY, PARAMOUNT POULTRY HARBESON 19951
CARGILL INCORPORATED PARAMOUNT PRODUCTS DIVISION (ROUTE 5 in HARBESON, DE)
(Integrated Compliance Information System) - ICIS-03-1979-0003, FORMAL ENFORCEMENT ACTION TRI REPORTER (Tracking of toxic chemicals releasing facilities) Business SIC classification: POULTRY SLAUGHTERING AND PROCESSING
HARBESON SWAN SITE (RT 9 in HARBESON, DE)
(Integrated Compliance Information System) - ICIS-03-2000-0096, FORMAL ENFORCEMENT ACTION
HARBESON DEAD SWAN SITE (ROUTE #1 in HARBESON, DE)
SUPERFUND (Superfund database)
THE PONTOON EXPRESS (RT. 5, BOX 205 in HABERSON, DE)
COMPLIANCE ACTIVITY (Tracking inspections of insecticide, fungicide, and rodenticide, and toxic substances)
Housing units lacking complete plumbing facilities: 0.8% Housing units lacking complete kitchen facilities: 0.8%
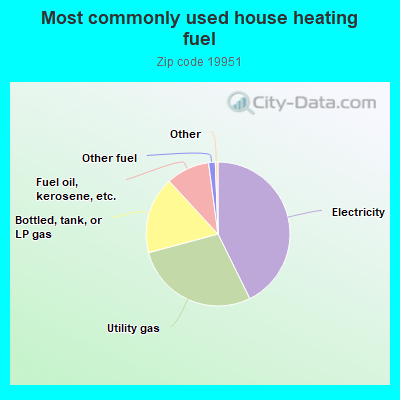
42.9%Electricity
28.2%Utility gas
17.4%Bottled, tank, or LP gas
9.8%Fuel oil, kerosene, etc.
1.5%Other fuel
Population in 1990: 598. Population change in the 1990s: +375 (+62.7%).
Place of birth for U.S.-born residents:
This state: 888
Northeast: 874
Midwest: 21
South: 246
West: 63
73% of the 19951 zip code residents lived in the same house 5 years ago. Out of people who lived in different houses, 38% lived in this county. Out of people who lived in different counties, 50% lived in Delaware.
95% of the 19951 zip code residents lived in the same house 1 year ago. Out of people who lived in different houses, 24% moved from this county. Out of people who lived in different houses, 76% moved from different state. Out of people who lived in different houses, 10% moved from abroad.
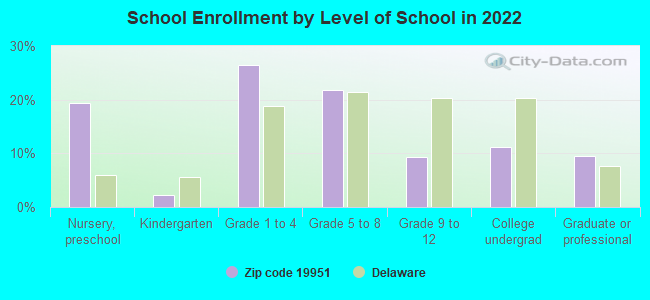
Private vs. public school enrollment:
Students in private schools in grades 1 to 8 (elementary and middle school): 10
Here:
7.1%
Delaware:
11.5%
Students in private schools in grades 9 to 12 (high school):
Here:
0.0%
Delaware:
12.1%
Students in private undergraduate colleges: 1
Here:
5.6%
Delaware:
19.2%
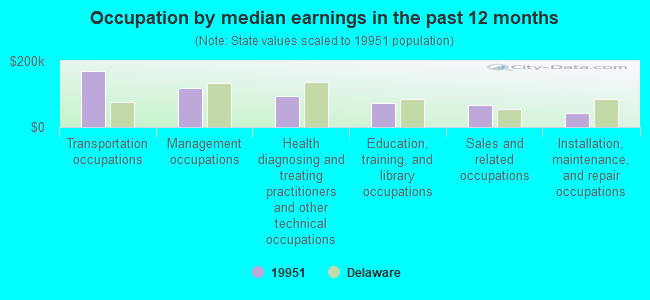
Occupation by median earnings in the past 12 months ($)
170,542Transportation occupations
117,946Management occupations
93,813Health diagnosing and treating practitioners and other technical occupations
72,603Education, training, and library occupations
67,540Sales and related occupations
41,919Installation, maintenance, and repair occupations
Top industries in this zip code by the number of employees in 2005:

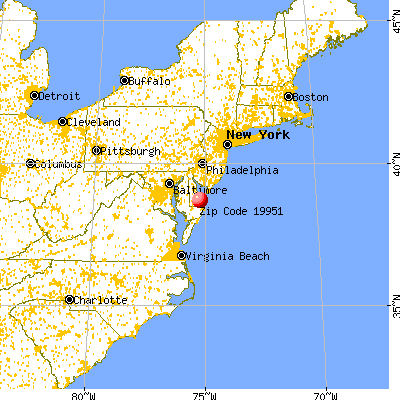


 Nearest zip codes: 19968, 19958, 19966, 19939, 19947, 19971.