Estimated zip code population in 2022: 7,829 Zip code population in 2010: 6,170 Zip code population in 2000: 4,481
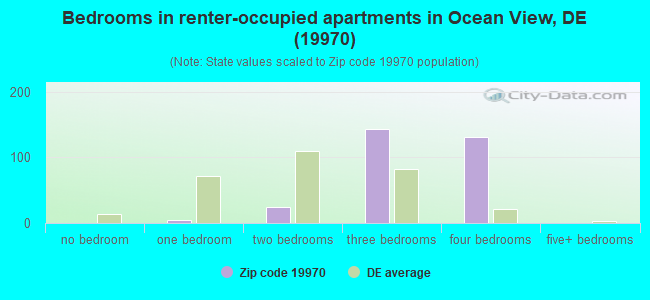
Houses and condos: 8,476 Renter-occupied apartments: 292
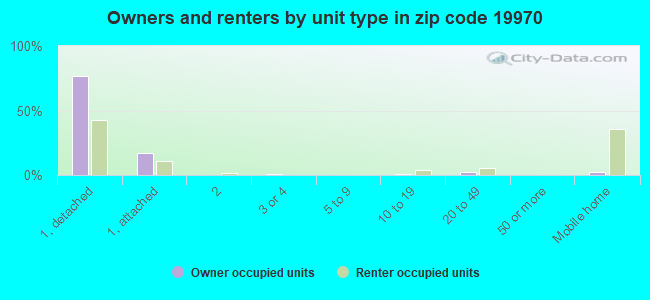
% of renters here:
8%
State:
26%
March 2022 cost of living index in zip code 19970: 86.9 (less than average, U.S. average is 100)
Land area: 9.7 sq. mi. Water area: 3.4 sq. mi.
Population density: 808 people per square mile
(low).
OSM Map
General Map
Google Map
MSN Map
OSM Map
General Map
Google Map
MSN Map
OSM Map
General Map
Google Map
MSN Map
OSM Map
General Map
Google Map
MSN Map
Please wait while loading the map...
Real estate property taxes paid for housing units in 2022:
This zip code:
0.3% ($1,366)
Delaware:
0.5% ($1,635)
Median real estate property taxes paid for housing units with mortgages in 2022: $1,352 (0.3%) Median real estate property taxes paid for housing units with no mortgage in 2022: $1,407 (0.3%)
Estimated median house/condo value in 2022: $497,514
19970:
$497,514
Delaware:
$337,200
According to our research of Delaware and other state lists, there were 8 registered sex offenders living in 19970 zip code as of May 28, 2024. The ratio of all residents to sex offenders in zip code 19970 is 989 to 1. The ratio of registered sex offenders to all residents in this zip code is much lower than the state average.
Median resident age:
This zip code:
63.3 years
Delaware median age:
41.5 years
Average household size:
This zip code:
2.1 people
Delaware:
2.5 people
Averages for the 2020 tax year for zip code 19970, filed in 2021:
Average Adjusted Gross Income (AGI) in 2020: $95,937 (Individual Income Tax Returns)
Here:
$95,937
State:
$74,239
Salary/wage: $69,894 (reported on 60.2% of returns)
Here:
$69,894
State:
$59,982
(% of AGI for various income ranges: 907.0% for AGIs below $25k, 2637.1% for AGIs $25k-50k, 4370.5% for AGIs $50k-75k, 5140.5% for AGIs $75k-100k, 10929.7% for AGIs $100k-200k, 67730.8% for AGIs over 200k)
Taxable interest for individuals: $1,886 (reported on 54.2% of returns)
This zip code:
$1,886
Delaware:
$1,604
(% of AGI for various income ranges: 40.7% for AGIs below $25k, 74.4% for AGIs $25k-50k, 133.4% for AGIs $50k-75k, 169.5% for AGIs $75k-100k, 325.9% for AGIs $100k-200k, 1014.6% for AGIs over 200k)
Ordinary dividends: $6,029 (reported on 40.2% of returns)
Here:
$6,029
State:
$8,303
(% of AGI for various income ranges: 91.0% for AGIs below $25k, 196.6% for AGIs $25k-50k, 212.7% for AGIs $50k-75k, 425.7% for AGIs $75k-100k, 760.7% for AGIs $100k-200k, 2664.6% for AGIs over 200k)
Net capital gain/loss in AGI: +$15,040 (reported on 35.1% of returns)
Here:
+$15,040
State:
+$19,461
(% of AGI for various income ranges: 22.1% for AGIs below $25k, 88.2% for AGIs $25k-50k, 194.6% for AGIs $50k-75k, 415.1% for AGIs $75k-100k, 1110.5% for AGIs $100k-200k, 13071.5% for AGIs over 200k)
Profit/loss from business: +$25,503 (reported on 15.5% of returns)
Here:
+$25,503
State:
+$13,079
(% of AGI for various income ranges: 138.9% for AGIs below $25k, 219.7% for AGIs $25k-50k, 419.3% for AGIs $50k-75k, 543.5% for AGIs $75k-100k, 831.4% for AGIs $100k-200k, 6927.7% for AGIs over 200k)
Taxable individual retirement arrangement distribution: $26,217 (reported on 26.5% of returns)
19970:
$26,217
Delaware:
$22,095
(% of AGI for various income ranges: 177.4% for AGIs below $25k, 399.5% for AGIs $25k-50k, 677.3% for AGIs $50k-75k, 1330.0% for AGIs $75k-100k, 2517.2% for AGIs $100k-200k, 6808.5% for AGIs over 200k)
Self-employed (Keogh) retirement plans: $21,900 (reported on 1.4% of returns)
19970:
$21,900
Delaware:
$28,197
(% of AGI for various income ranges: 143.2% for AGIs $75k-100k, 771.5% for AGIs over 200k)
Total itemized deductions: $29,830 (reported on 15.9% of returns)
Here:
$29,830
State:
$30,452
(% of AGI for various income ranges: 185.7% for AGIs below $25k, 261.9% for AGIs $25k-50k, 573.9% for AGIs $50k-75k, 662.2% for AGIs $75k-100k, 1406.2% for AGIs $100k-200k, 6139.2% for AGIs over 200k)
Charity contributions: $5,852 (reported on 13.3% of returns)
Here:
$5,852
State:
$8,999
(% of AGI for various income ranges: 8.9% for AGIs below $25k, 21.6% for AGIs $25k-50k, 53.7% for AGIs $50k-75k, 82.7% for AGIs $75k-100k, 219.5% for AGIs $100k-200k, 1481.5% for AGIs over 200k)
Taxes paid: $7,194 (reported on 15.7% of returns)
19970:
$7,194
State:
$7,483
(% of AGI for various income ranges: 15.9% for AGIs below $25k, 39.7% for AGIs $25k-50k, 98.5% for AGIs $50k-75k, 171.9% for AGIs $75k-100k, 391.2% for AGIs $100k-200k, 1551.5% for AGIs over 200k)
Earned income credit: $1,710 (reported on 6.0% of returns)
Here:
$1,710
State:
$2,247
(% of AGI for various income ranges: 43.4% for AGIs below $25k, 33.7% for AGIs $25k-50k)
Percentage of individuals using paid preparers for their 2020 taxes: 92.2%
Here:
92%
State:
92%
(% for various income ranges: 90.4% for AGIs below $25k, 92.4% for AGIs $25k-50k, 92.8% for AGIs $50k-75k, 93.8% for AGIs $75k-100k, 92.2% for AGIs $100k-200k, 93.5% for AGIs over 200k)
Averages for the 2012 tax year for zip code 19970, filed in 2013:
Average Adjusted Gross Income (AGI) in 2012: $65,474 (Individual Income Tax Returns)
Here:
$65,474
State:
$61,157
Salary/wage: $44,041 (reported on 65.9% of returns)
Here:
$44,041
State:
$50,642
(% of AGI for various income ranges: 60.0% for AGIs below $25k, 50.7% for AGIs $25k-50k, 38.4% for AGIs $50k-75k, 37.8% for AGIs $75k-100k, 46.3% for AGIs $100k-200k, 42.2% for AGIs over 200k)
Taxable interest for individuals: $1,820 (reported on 51.2% of returns)
This zip code:
$1,820
Delaware:
$1,571
(% of AGI for various income ranges: 2.2% for AGIs below $25k, 1.7% for AGIs $25k-50k, 1.9% for AGIs $50k-75k, 1.5% for AGIs $75k-100k, 1.0% for AGIs $100k-200k, 1.3% for AGIs over 200k)
Ordinary dividends: $4,618 (reported on 35.5% of returns)
Here:
$4,618
State:
$6,610
(% of AGI for various income ranges: 2.9% for AGIs below $25k, 2.6% for AGIs $25k-50k, 2.3% for AGIs $50k-75k, 2.4% for AGIs $75k-100k, 2.4% for AGIs $100k-200k, 2.6% for AGIs over 200k)
Net capital gain/loss in AGI: +$8,782 (reported on 28.0% of returns)
Here:
+$8,782
State:
+$11,439
(% of AGI for various income ranges: 0.2% for AGIs $25k-50k, 0.5% for AGIs $50k-75k, 1.4% for AGIs $75k-100k, 1.9% for AGIs $100k-200k, 12.3% for AGIs over 200k)
Profit/loss from business: +$19,145 (reported on 15.9% of returns)
Here:
+$19,145
State:
+$12,773
(% of AGI for various income ranges: 7.4% for AGIs below $25k, 4.0% for AGIs $25k-50k, 3.4% for AGIs $50k-75k, 2.7% for AGIs $75k-100k, 4.5% for AGIs $100k-200k, 6.3% for AGIs over 200k)
Taxable individual retirement arrangement distribution: $17,974 (reported on 25.7% of returns)
19970:
$17,974
Delaware:
$16,790
(% of AGI for various income ranges: 8.5% for AGIs below $25k, 7.0% for AGIs $25k-50k, 8.8% for AGIs $50k-75k, 7.6% for AGIs $75k-100k, 7.0% for AGIs $100k-200k, 5.5% for AGIs over 200k)
Self-employment retirement plans: $20,450 (reported on 1.2% of returns)
19970:
$20,450
Delaware:
$22,611
Total itemized deductions: $25,085 (22% of AGI, reported on 38.2% of returns)
Here:
$25,085
State:
$23,216
Here:
21.8% of AGI
State:
19.8% of AGI
(% of AGI for various income ranges: 17.0% for AGIs below $25k, 13.1% for AGIs $25k-50k, 13.7% for AGIs $50k-75k, 14.7% for AGIs $75k-100k, 16.5% for AGIs $100k-200k, 13.1% for AGIs over 200k)
Charity contributions: $2,959 (reported on 34.1% of returns)
Here:
$2,959
State:
$3,791
(% of AGI for various income ranges: 1.1% for AGIs below $25k, 1.1% for AGIs $25k-50k, 1.3% for AGIs $50k-75k, 1.8% for AGIs $75k-100k, 1.7% for AGIs $100k-200k, 1.7% for AGIs over 200k)
Taxes paid: $7,373 (reported on 37.9% of returns)
19970:
$7,373
State:
$8,129
(% of AGI for various income ranges: 1.4% for AGIs below $25k, 1.9% for AGIs $25k-50k, 2.6% for AGIs $50k-75k, 3.7% for AGIs $75k-100k, 5.3% for AGIs $100k-200k, 6.3% for AGIs over 200k)
Earned income credit: $1,878 (reported on 9.2% of returns)
Here:
$1,878
State:
$2,231
(% of AGI for various income ranges: 3.1% for AGIs below $25k, 0.6% for AGIs $25k-50k)
Percentage of individuals using paid preparers for their 2012 taxes: 50.6%
Here:
51%
State:
47%
(% for various income ranges: 38.5% for AGIs below $25k, 45.5% for AGIs $25k-50k, 58.0% for AGIs $50k-75k, 62.5% for AGIs $75k-100k, 65.3% for AGIs $100k-200k, 69.2% for AGIs over 200k)
Averages for the 2004 tax year for zip code 19970, filed in 2005:
Average Adjusted Gross Income (AGI) in 2004: $54,106 (Individual Income Tax Returns)
Here:
$54,106
State:
$54,038
Salary/wage: $37,566 (reported on 67.7% of returns)
Here:
$37,566
State:
$44,625
(% of AGI for various income ranges: 114.1% for AGIs below $10k, 49.5% for AGIs $10k-25k, 51.7% for AGIs $25k-50k, 45.4% for AGIs $50k-75k, 54.8% for AGIs $75k-100k, 41.5% for AGIs over 100k)
Taxable interest for individuals: $2,266 (reported on 59.9% of returns)
This zip code:
$2,266
Delaware:
$1,734
(% of AGI for various income ranges: 7.0% for AGIs below $10k, 4.6% for AGIs $10k-25k, 2.6% for AGIs $25k-50k, 2.8% for AGIs $50k-75k, 1.6% for AGIs $75k-100k, 2.1% for AGIs over 100k)
Taxable dividends: $2,763 (reported on 39.7% of returns)
Here:
$2,763
State:
$5,362
(% of AGI for various income ranges: 7.8% for AGIs below $10k, 4.0% for AGIs $10k-25k, 2.0% for AGIs $25k-50k, 2.1% for AGIs $50k-75k, 1.6% for AGIs $75k-100k, 1.7% for AGIs over 100k)
Net capital gain/loss: +$14,619 (reported on 30.8% of returns)
Here:
+$14,619
State:
+$17,328
(% of AGI for various income ranges: -6.4% for AGIs below $10k, 0.5% for AGIs $10k-25k, 1.2% for AGIs $25k-50k, 1.9% for AGIs $50k-75k, 2.9% for AGIs $75k-100k, 17.4% for AGIs over 100k)
Profit/loss from business: +$20,066 (reported on 18.2% of returns)
Here:
+$20,066
State:
+$12,191
(% of AGI for various income ranges: 18.5% for AGIs below $10k, 6.8% for AGIs $10k-25k, 5.0% for AGIs $25k-50k, 6.9% for AGIs $50k-75k, 3.6% for AGIs $75k-100k, 8.1% for AGIs over 100k)
IRA payment deduction: $3,504 (reported on 4.2% of returns)
19970:
$3,504
Delaware:
$3,027
(% of AGI for various income ranges: 0.4% for AGIs $10k-25k, 0.3% for AGIs $25k-50k, 0.4% for AGIs $50k-75k, 0.4% for AGIs $75k-100k, 0.1% for AGIs over 100k)
Self-employed pension: $17,371 (reported on 1.3% of returns)
Here:
$17,371
Delaware:
$15,466
Total itemized deductions: $19,424 (21% of AGI, reported on 39.9% of returns)
Here:
$19,424
State:
$19,441
Here:
20.7% of AGI
State:
19.3% of AGI
(% of AGI for various income ranges: 27.8% for AGIs below $10k, 19.1% for AGIs $10k-25k, 13.2% for AGIs $25k-50k, 16.3% for AGIs $50k-75k, 15.5% for AGIs $75k-100k, 12.5% for AGIs over 100k)
Charity contributions deductions: $2,620 (3% of AGI, reported on 36.2% of returns)
Here:
$2,620
State:
$3,727
Here:
2.7% of AGI
State:
3.5% of AGI
(% of AGI for various income ranges: 0.9% for AGIs below $10k, 1.4% for AGIs $10k-25k, 1.6% for AGIs $25k-50k, 2.2% for AGIs $50k-75k, 2.1% for AGIs $75k-100k, 1.6% for AGIs over 100k)
Total tax: $8,776 (reported on 82.5% of returns)
19970:
$8,776
State:
$8,958
(% of AGI for various income ranges: 5.5% for AGIs below $10k, 4.5% for AGIs $10k-25k, 7.7% for AGIs $25k-50k, 9.9% for AGIs $50k-75k, 11.4% for AGIs $75k-100k, 19.5% for AGIs over 100k)
Earned income credit: $1,441 (reported on 8.1% of returns)
Here:
$1,441
State:
$1,733
Percentage of individuals using paid preparers for their 2004 taxes: 62.9%
Here:
63%
State:
55%
(% for various income ranges: 55.6% for AGIs below $10k, 58.1% for AGIs $10k-25k, 62.9% for AGIs $25k-50k, 66.6% for AGIs $50k-75k, 66.1% for AGIs $75k-100k, 76.6% for AGIs over 100k)
Likely homosexual households (counted as self-reported same-sex unmarried-partner households)
Lesbian couples: 1.0% of all households
Gay men: 0.0% of all households
Household received Food Stamps/SNAP in the past 12 months: 170 Household did not receive Food Stamps/SNAP in the past 12 months: 3,537
Women who had a birth in the past 12 months: 99 (16 now married, 73 unmarried) Women who did not have a birth in the past 12 months: 766 (449 now married, 328 unmarried)
Housing units in zip code 19970 with a mortgage: 2,125 (172 second mortgage, 14 home equity loan, 161 both second mortgage and home equity loan) Houses without a mortgage: 93
Median monthly owner costs for units with a mortgage: $1,833 Median monthly owner costs for units without a mortgage: $570
Residents with income below the poverty level in 2022:
This zip code:
12.2%
Whole state:
9.4%
Residents with income below 50% of the poverty level in 2022:
This zip code:
0.8%
Whole state:
4.6%
Median number of rooms in houses and condos:
Here:
6.8
State:
6.9
Median number of rooms in apartments:
Here:
6.2
State:
4.4
Notable locations in this zip code not listed on our city pages
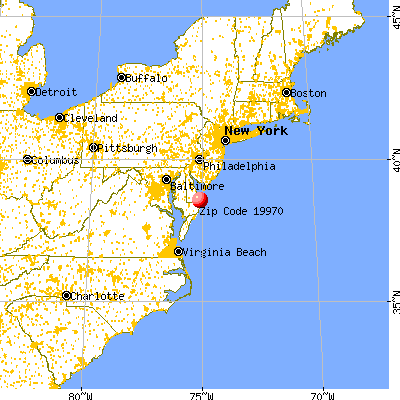
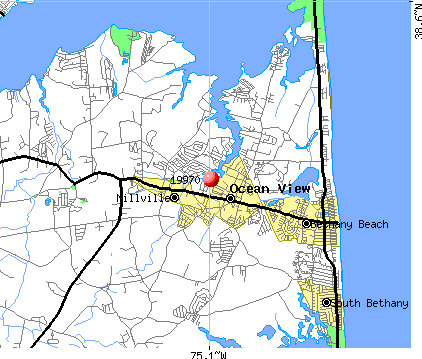
Notable locations in zip code 19970: Sandy Cove Camping (A), Bear Trap Dunes Golf Course (B), Bethany Bay Golf Course (C), Ocean View Police Department (D), Millville Town Hall (E). Display/hide their locations on the map
Size of family households: 2,042 2-persons, 245 3-persons, 292 4-persons, 47 5-persons, 10 6-persons
Size of nonfamily households: 873 1-person, 181 2-persons
441 married couples with children.
599 single-parent households (72 men, 527 women).
96.5% of residents of 19970 zip code speak English at home.
3.6% of residents speak Spanish at home (93% very well, 4% well, 3% not well).
1.5% of residents speak other Indo-European language at home (64% very well, 31% well, 4% not well, 2% not at all).
0.5% of residents speak Asian or Pacific Island language at home (80% very well, 8% well, 12% not well).
0.1% of residents speak other language at home (9% very well, 91% well).
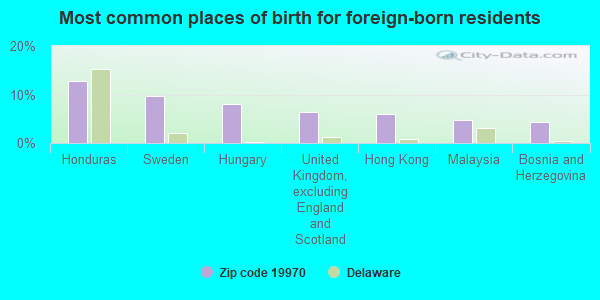
Foreign born population: 406 (5.2%) (86.5% of them are naturalized citizens)
This zip code:
5.2%
Whole state:
9.9%
13%Honduras
10%Sweden
8%Hungary
6%United Kingdom, excluding England and Scotland
6%Hong Kong
5%Malaysia
4%Bosnia and Herzegovina
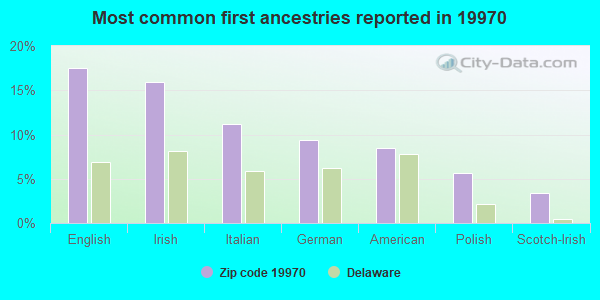
18%English
16%Irish
11%Italian
9%German
8%American
6%Polish
3%Scotch-Irish
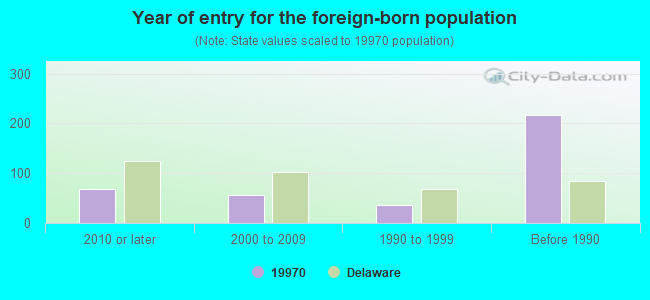
Year of entry for the foreign-born population
692010 or later
562000 to 2009
371990 to 1999
217Before 1990
Facilities with environmental interests located in this zip code:
LORD BALTIMORE ELEMENTARY SCHOOL (120 ATLANTIC AVENUE in OCEAN VIEW, DE)
(Geographic Names Information System) (National Center for Education Statistics) - STATE ID-736 Organizations: INDIAN RIVER SCHOOL DISTRICT (SCHOOL DISTRICT)
BETHANY BAY (FAIRWAY BLVD. in OCEAN VIEW, DE)
(Integrated Compliance Information System) - ICIS-03-1995-0233, FORMAL ENFORCEMENT ACTION Business SIC classification: GENERAL CONTRACTORS-INDUSTRIAL BUILDINGS AND WAREHOUSES; GENERAL CONTRACTORS-NONRESIDENTIAL BUILDINGS, OTHER THAN INDUSTRIAL BUILDINGS AND WAREHOUSES
BETHANY CREST, LLC (RR 2 in CLARKSVILLE, DE)
(Integrated Compliance Information System) - ICIS-03-2000-0463, FORMAL ENFORCEMENT ACTION
INDIAN RIVER SCHOOL DISTRICT (RTE 26 in OCEAN VIEW, DE)
(Integrated Compliance Information System) - ICIS-03-1986-0403, FORMAL ENFORCEMENT ACTION Business SIC classification: ELEMENTARY AND SECONDARY SCHOOLS
SHIP, DONALD W. JR (OFF OF RD 363 in OCEAN VIEW, DE)
(Integrated Compliance Information System) - ICIS-03-2000-0216, FORMAL ENFORCEMENT ACTION
BOBS MARINE SERVICE (ROUTES 17 & 26 in CLARKSVILLE, DE)
Small Quantity Generators, between 100 kg and 1000 kg of hazardous waste/month (Resource Conservation and Recovery Act (tracking hazardous waste)) - notification Organizations: ROBERT LITTLETON (CONTACT/OWNER)
GA HASTINGS & ASSOCIATES INC (102 CENTRAL AVE in OCEAN VIEW, DE)
Conditionally Exempt Small Quantity Generators, less than 100 kg/month of hazardous waste (Resource Conservation and Recovery Act (tracking hazardous waste)) Organizations: GREGORY HASTINGS (CONTACT/OWNER)
LAND TECH LLC (118 ATLANTIC AVE in OCEAN VIEW, DE)
Conditionally Exempt Small Quantity Generators, less than 100 kg/month of hazardous waste (Resource Conservation and Recovery Act (tracking hazardous waste)) - notification Organizations: ATLANTIC INVESTMENT GROUP INC (CONTACT/OWNER)
Housing units lacking complete plumbing facilities: 0.6% Housing units lacking complete kitchen facilities: 1.0%
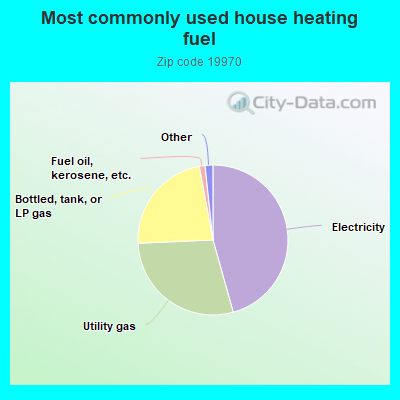
45.7%Electricity
28.7%Utility gas
22.8%Bottled, tank, or LP gas
1.2%Fuel oil, kerosene, etc.
0.8%No fuel used
0.7%Other fuel
Population in 1990: 1,532. Population change in the 1990s: +2,949 (+192.5%).
Place of birth for U.S.-born residents:
This state: 1,030
Northeast: 3,248
Midwest: 280
South: 2,735
West: 235
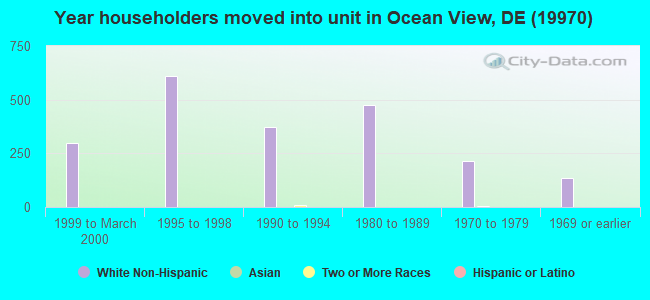
58% of the 19970 zip code residents lived in the same house 5 years ago. Out of people who lived in different houses, 28% lived in this county. Out of people who lived in different counties, 50% lived in Delaware.
91% of the 19970 zip code residents lived in the same house 1 year ago. Out of people who lived in different houses, 21% moved from this county. Out of people who lived in different houses, 11% moved from different county within same state. Out of people who lived in different houses, 72% moved from different state.
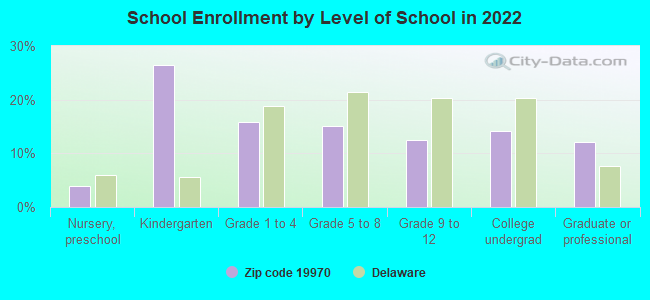
Private vs. public school enrollment:
Students in private schools in grades 1 to 8 (elementary and middle school): 39
Here:
14.0%
Delaware:
11.5%
Students in private schools in grades 9 to 12 (high school): 10
Here:
8.8%
Delaware:
12.1%
Students in private undergraduate colleges: 31
Here:
24.8%
Delaware:
19.2%
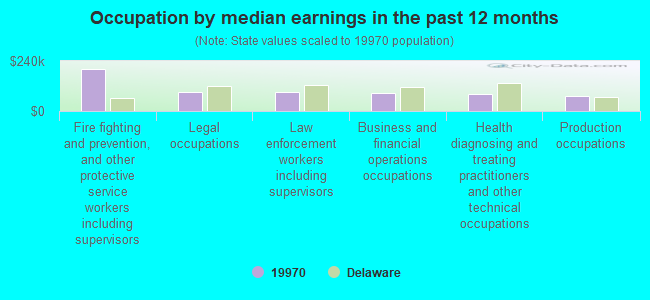
Occupation by median earnings in the past 12 months ($)
200,526Fire fighting and prevention, and other protective service workers including supervisors
92,418Legal occupations
91,777Law enforcement workers including supervisors
85,312Business and financial operations occupations
80,071Health diagnosing and treating practitioners and other technical occupations
71,477Production occupations
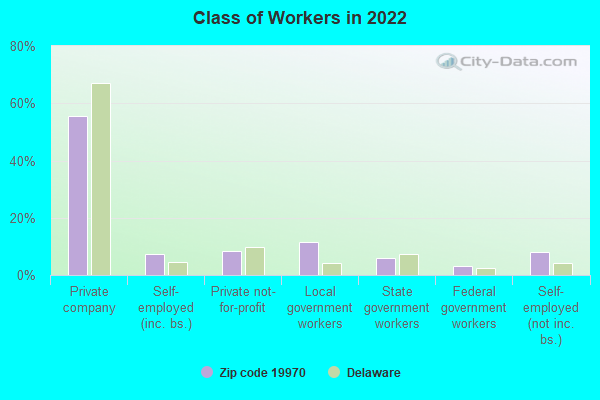
Companies with federal contracts located in this zip code:
ZOOK, WILLIAM CHAD (792 HICKMAN DR in MILLVILLE, DE; small business)
$5,250 with Air Force for Care of Remains and/or Funeral Services. Signed on 2004-11-30. Completion date: 2008-04-01.
Top industries in this zip code by the number of employees in 2005:
Real Estate and Rental and Leasing: Lessors of Nonresidential Buildings (except Miniwarehouses) (250-499 employees: 1 establishment)
Construction: Siding Contractors (50-99: 1)
Accommodation and Food Services: Limited-Service Restaurants (20-49: 2, 1-4: 2)
Accommodation and Food Services: Full-Service Restaurants (20-49: 2, 1-4: 1)
Construction: New Single-Family Housing Construction (except Operative Builders) (20-49: 1, 10-19: 1, 5-9: 1, 1-4: 5)
2002 - 2018 National Fire Incident Reporting System (NFIRS) incidents
According to the data from the years 2002 - 2018 the average number of fires per year is 34. The highest number of fires - 46 took place in 2008, and the least - 23 in 2012. The data has a growing trend.
When looking into fire subcategories, the most incidents belonged to: Structure Fires (56.6%), and Outside Fires (32.9%).
Fire incident types reported to NFIRS in Zip Code 19970


 Nearest zip codes: 19967, 19930, 19944, 19939, 19975, 19971.


 According to the data from the years 2002 - 2018 the average number of fires per year is 34. The highest number of fires - 46 took place in 2008, and the least - 23 in 2012. The data has a growing trend.
 When looking into fire subcategories, the most incidents belonged to: Structure Fires (56.6%), and Outside Fires (32.9%).