Estimated zip code population in 2022: 34,199 Zip code population in 2010: 11,315 Zip code population in 2000: 1,311
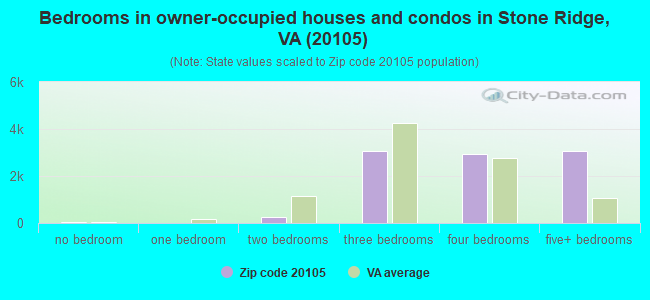
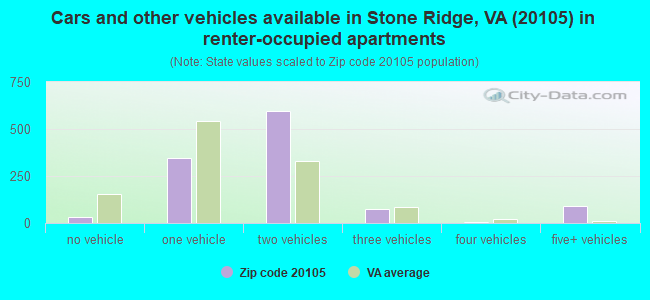
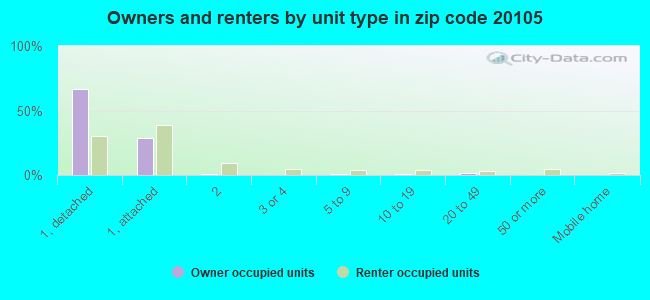
Houses and condos: 10,388 Renter-occupied apartments: 1,152
% of renters here:
11%
State:
33%
March 2022 cost of living index in zip code 20105: 166.1 (very high, U.S. average is 100)
Land area: 37.1 sq. mi. Water area: 0.4 sq. mi.
Population density: 921 people per square mile
(low).
OSM Map
General Map
Google Map
MSN Map
OSM Map
General Map
Google Map
MSN Map
OSM Map
General Map
Google Map
MSN Map
OSM Map
General Map
Google Map
MSN Map
Please wait while loading the map...
Real estate property taxes paid for housing units in 2022:
This zip code:
0.8% ($6,891)
Virginia:
0.7% ($2,617)
Median real estate property taxes paid for housing units with mortgages in 2022: $6,968 (0.8%) Median real estate property taxes paid for housing units with no mortgage in 2022: $6,537 (0.9%)
Estimated median house/condo value in 2022: $825,677
20105:
$825,677
Virginia:
$365,700
According to our research of Virginia and other state lists, there were 6 registered sex offenders living in 20105 zip code as of May 28, 2024. The ratio of all residents to sex offenders in zip code 20105 is 2,750 to 1. The ratio of registered sex offenders to all residents in this zip code is much lower than the state average.
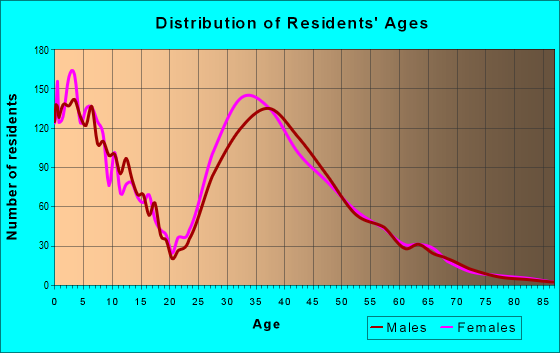
Median resident age:
This zip code:
36.6 years
Virginia median age:
39.0 years
Average household size:
This zip code:
3.3 people
Virginia:
2.5 people
Averages for the 2020 tax year for zip code 20105, filed in 2021:
Average Adjusted Gross Income (AGI) in 2020: $160,313 (Individual Income Tax Returns)
Here:
$160,313
State:
$86,446
Salary/wage: $147,169 (reported on 90.5% of returns)
Here:
$147,169
State:
$71,185
(% of AGI for various income ranges: 1102.1% for AGIs below $25k, 3821.4% for AGIs $25k-50k, 6963.7% for AGIs $50k-75k, 10589.5% for AGIs $75k-100k, 20927.9% for AGIs $100k-200k, 81712.5% for AGIs over 200k)
Taxable interest for individuals: $1,126 (reported on 43.9% of returns)
This zip code:
$1,126
Virginia:
$1,805
(% of AGI for various income ranges: 17.2% for AGIs below $25k, 32.8% for AGIs $25k-50k, 30.2% for AGIs $50k-75k, 44.9% for AGIs $75k-100k, 72.1% for AGIs $100k-200k, 278.7% for AGIs over 200k)
Ordinary dividends: $4,566 (reported on 33.6% of returns)
Here:
$4,566
State:
$8,327
(% of AGI for various income ranges: 21.2% for AGIs below $25k, 29.3% for AGIs $25k-50k, 47.5% for AGIs $50k-75k, 61.6% for AGIs $75k-100k, 139.4% for AGIs $100k-200k, 1184.5% for AGIs over 200k)
Net capital gain/loss in AGI: +$17,689 (reported on 35.0% of returns)
Here:
+$17,689
State:
+$24,644
(% of AGI for various income ranges: 22.0% for AGIs below $25k, 44.5% for AGIs $25k-50k, 95.5% for AGIs $50k-75k, 133.5% for AGIs $75k-100k, 311.1% for AGIs $100k-200k, 5508.5% for AGIs over 200k)
Profit/loss from business: +$16,812 (reported on 20.9% of returns)
Here:
+$16,812
State:
+$12,836
(% of AGI for various income ranges: 185.8% for AGIs below $25k, 279.3% for AGIs $25k-50k, 269.7% for AGIs $50k-75k, 279.9% for AGIs $75k-100k, 360.0% for AGIs $100k-200k, 2153.2% for AGIs over 200k)
Taxable individual retirement arrangement distribution: $26,622 (reported on 5.1% of returns)
20105:
$26,622
Virginia:
$21,535
(% of AGI for various income ranges: 28.7% for AGIs below $25k, 72.3% for AGIs $25k-50k, 116.0% for AGIs $50k-75k, 140.2% for AGIs $75k-100k, 246.2% for AGIs $100k-200k, 692.7% for AGIs over 200k)
Self-employed (Keogh) retirement plans: $22,662 (reported on 1.5% of returns)
20105:
$22,662
Virginia:
$31,172
(% of AGI for various income ranges: 28.1% for AGIs $100k-200k, 283.4% for AGIs over 200k)
Total itemized deductions: $33,912 (reported on 42.4% of returns)
Here:
$33,912
State:
$33,287
(% of AGI for various income ranges: 58.8% for AGIs below $25k, 281.5% for AGIs $25k-50k, 738.0% for AGIs $50k-75k, 1351.6% for AGIs $75k-100k, 2620.3% for AGIs $100k-200k, 8206.3% for AGIs over 200k)
Charity contributions: $6,279 (reported on 33.2% of returns)
Here:
$6,279
State:
$10,381
(% of AGI for various income ranges: 2.3% for AGIs below $25k, 29.4% for AGIs $25k-50k, 83.3% for AGIs $50k-75k, 137.0% for AGIs $75k-100k, 299.8% for AGIs $100k-200k, 1403.7% for AGIs over 200k)
Taxes paid: $9,517 (reported on 42.4% of returns)
20105:
$9,517
State:
$8,284
(% of AGI for various income ranges: 15.3% for AGIs below $25k, 69.5% for AGIs $25k-50k, 205.2% for AGIs $50k-75k, 438.3% for AGIs $75k-100k, 819.9% for AGIs $100k-200k, 2115.4% for AGIs over 200k)
Earned income credit: $2,005 (reported on 5.3% of returns)
Here:
$2,005
State:
$2,214
(% of AGI for various income ranges: 48.9% for AGIs below $25k, 71.5% for AGIs $25k-50k, 1.3% for AGIs $50k-75k)
Percentage of individuals using paid preparers for their 2020 taxes: 94.2%
Here:
94%
State:
92%
(% for various income ranges: 90.3% for AGIs below $25k, 94.0% for AGIs $25k-50k, 92.6% for AGIs $50k-75k, 93.9% for AGIs $75k-100k, 95.2% for AGIs $100k-200k, 96.1% for AGIs over 200k)
Averages for the 2012 tax year for zip code 20105, filed in 2013:
Average Adjusted Gross Income (AGI) in 2012: $117,731 (Individual Income Tax Returns)
Here:
$117,731
State:
$71,192
Salary/wage: $107,618 (reported on 93.5% of returns)
Here:
$107,618
State:
$59,229
(% of AGI for various income ranges: 86.7% for AGIs below $25k, 87.9% for AGIs $25k-50k, 90.2% for AGIs $50k-75k, 89.7% for AGIs $75k-100k, 92.3% for AGIs $100k-200k, 75.8% for AGIs over 200k)
Taxable interest for individuals: $777 (reported on 47.8% of returns)
This zip code:
$777
Virginia:
$1,600
(% of AGI for various income ranges: 0.8% for AGIs below $25k, 0.4% for AGIs $25k-50k, 0.3% for AGIs $50k-75k, 0.3% for AGIs $75k-100k, 0.2% for AGIs $100k-200k, 0.5% for AGIs over 200k)
Ordinary dividends: $2,944 (reported on 27.9% of returns)
Here:
$2,944
State:
$6,959
(% of AGI for various income ranges: 1.4% for AGIs below $25k, 0.8% for AGIs $25k-50k, 0.3% for AGIs $50k-75k, 0.5% for AGIs $75k-100k, 0.4% for AGIs $100k-200k, 1.1% for AGIs over 200k)
Net capital gain/loss in AGI: +$5,903 (reported on 23.5% of returns)
Here:
+$5,903
State:
+$16,672
(% of AGI for various income ranges: 0.2% for AGIs $25k-50k, 0.3% for AGIs $50k-75k, 0.7% for AGIs $75k-100k, 0.3% for AGIs $100k-200k, 2.6% for AGIs over 200k)
Profit/loss from business: +$16,209 (reported on 17.3% of returns)
Here:
+$16,209
State:
+$14,116
(% of AGI for various income ranges: 10.2% for AGIs below $25k, 4.4% for AGIs $25k-50k, 3.0% for AGIs $50k-75k, 2.9% for AGIs $75k-100k, 1.9% for AGIs $100k-200k, 2.2% for AGIs over 200k)
Taxable individual retirement arrangement distribution: $19,344 (reported on 5.8% of returns)
20105:
$19,344
Virginia:
$16,667
(% of AGI for various income ranges: 0.9% for AGIs below $25k, 2.2% for AGIs $25k-50k, 1.1% for AGIs $50k-75k, 0.9% for AGIs $75k-100k, 0.9% for AGIs $100k-200k, 0.9% for AGIs over 200k)
Self-employment retirement plans: $24,667 (reported on 1.0% of returns)
20105:
$24,667
Virginia:
$25,373
Total itemized deductions: $33,307 (21% of AGI, reported on 65.8% of returns)
Here:
$33,307
State:
$26,596
Here:
21.2% of AGI
State:
20.1% of AGI
(% of AGI for various income ranges: 12.4% for AGIs below $25k, 15.8% for AGIs $25k-50k, 19.2% for AGIs $50k-75k, 20.7% for AGIs $75k-100k, 20.8% for AGIs $100k-200k, 16.1% for AGIs over 200k)
Charity contributions: $3,141 (reported on 52.7% of returns)
Here:
$3,141
State:
$4,443
(% of AGI for various income ranges: 0.5% for AGIs below $25k, 1.5% for AGIs $25k-50k, 1.7% for AGIs $50k-75k, 1.5% for AGIs $75k-100k, 1.4% for AGIs $100k-200k, 1.4% for AGIs over 200k)
Taxes paid: $13,225 (reported on 65.8% of returns)
20105:
$13,225
State:
$9,951
(% of AGI for various income ranges: 2.6% for AGIs below $25k, 4.2% for AGIs $25k-50k, 5.8% for AGIs $50k-75k, 7.1% for AGIs $75k-100k, 8.0% for AGIs $100k-200k, 7.5% for AGIs over 200k)
Earned income credit: $1,869 (reported on 5.2% of returns)
Here:
$1,869
State:
$2,211
(% of AGI for various income ranges: 3.5% for AGIs below $25k, 0.8% for AGIs $25k-50k)
Percentage of individuals using paid preparers for their 2012 taxes: 45.4%
Here:
45%
State:
46%
(% for various income ranges: 42.2% for AGIs below $25k, 44.6% for AGIs $25k-50k, 45.2% for AGIs $50k-75k, 49.3% for AGIs $75k-100k, 42.1% for AGIs $100k-200k, 55.4% for AGIs over 200k)
Averages for the 2004 tax year for zip code 20105, filed in 2005:
Average Adjusted Gross Income (AGI) in 2004: $106,824 (Individual Income Tax Returns)
Here:
$106,824
State:
$56,704
Salary/wage: $85,884 (reported on 91.7% of returns)
Here:
$85,884
State:
$48,441
(% of AGI for various income ranges: 92.2% for AGIs below $10k, 79.8% for AGIs $10k-25k, 88.7% for AGIs $25k-50k, 87.0% for AGIs $50k-75k, 89.1% for AGIs $75k-100k, 68.5% for AGIs over 100k)
Taxable interest for individuals: $1,635 (reported on 61.5% of returns)
This zip code:
$1,635
Virginia:
$1,688
(% of AGI for various income ranges: 3.9% for AGIs below $10k, 1.9% for AGIs $10k-25k, 0.5% for AGIs $25k-50k, 0.5% for AGIs $50k-75k, 1.2% for AGIs $75k-100k, 1.0% for AGIs over 100k)
Taxable dividends: $5,308 (reported on 33.0% of returns)
Here:
$5,308
State:
$4,028
(% of AGI for various income ranges: 4.3% for AGIs below $10k, 1.3% for AGIs $10k-25k, 0.9% for AGIs $25k-50k, 0.5% for AGIs $50k-75k, 0.4% for AGIs $75k-100k, 2.0% for AGIs over 100k)
Net capital gain/loss: +$26,697 (reported on 31.7% of returns)
Here:
+$26,697
State:
+$14,375
(% of AGI for various income ranges: -6.3% for AGIs below $10k, 0.9% for AGIs $10k-25k, -0.0% for AGIs $25k-50k, 0.9% for AGIs $50k-75k, 0.0% for AGIs $75k-100k, 10.8% for AGIs over 100k)
Profit/loss from business: +$21,543 (reported on 17.2% of returns)
Here:
+$21,543
State:
+$13,342
(% of AGI for various income ranges: 6.5% for AGIs below $10k, 12.6% for AGIs $10k-25k, 3.9% for AGIs $25k-50k, 5.4% for AGIs $50k-75k, 3.0% for AGIs $75k-100k, 3.0% for AGIs over 100k)
IRA payment deduction: $3,094 (reported on 2.9% of returns)
20105:
$3,094
Virginia:
$2,943
Self-employed pension: $18,256 (reported on 1.8% of returns)
Here:
$18,256
Virginia:
$17,430
Total itemized deductions: $30,245 (21% of AGI, reported on 66.4% of returns)
Here:
$30,245
State:
$21,492
Here:
21.0% of AGI
State:
21.0% of AGI
(% of AGI for various income ranges: 17.9% for AGIs $10k-25k, 19.2% for AGIs $25k-50k, 23.7% for AGIs $50k-75k, 25.5% for AGIs $75k-100k, 17.3% for AGIs over 100k)
Charity contributions deductions: $3,666 (2% of AGI, reported on 57.8% of returns)
Here:
$3,666
State:
$3,794
Here:
2.4% of AGI
State:
3.5% of AGI
(% of AGI for various income ranges: 1.4% for AGIs $10k-25k, 1.7% for AGIs $25k-50k, 1.7% for AGIs $50k-75k, 2.1% for AGIs $75k-100k, 2.0% for AGIs over 100k)
Total tax: $17,181 (reported on 90.0% of returns)
20105:
$17,181
State:
$9,537
(% of AGI for various income ranges: 3.3% for AGIs below $10k, 5.7% for AGIs $10k-25k, 7.7% for AGIs $25k-50k, 9.7% for AGIs $50k-75k, 9.7% for AGIs $75k-100k, 16.6% for AGIs over 100k)
Earned income credit: $1,612 (reported on 4.5% of returns)
Here:
$1,612
State:
$1,734
Percentage of individuals using paid preparers for their 2004 taxes: 51.5%
Here:
51%
State:
52%
(% for various income ranges: 41.7% for AGIs below $10k, 56.2% for AGIs $10k-25k, 48.0% for AGIs $25k-50k, 52.1% for AGIs $50k-75k, 54.5% for AGIs $75k-100k, 52.5% for AGIs over 100k)
Likely homosexual households (counted as self-reported same-sex unmarried-partner households)
Lesbian couples: 0.1% of all households
Gay men: 0.0% of all households
Household received Food Stamps/SNAP in the past 12 months: 413 Household did not receive Food Stamps/SNAP in the past 12 months: 9,888
Women who had a birth in the past 12 months: 364 (374 now married, 0 unmarried) Women who did not have a birth in the past 12 months: 8,721 (5,335 now married, 3,322 unmarried)
Housing units in zip code 20105 with a mortgage: 7,891 (1,109 second mortgage, 30 home equity loan, 972 both second mortgage and home equity loan) Houses without a mortgage: 103
Median monthly owner costs for units with a mortgage: $3,352 Median monthly owner costs for units without a mortgage: $946
Residents with income below the poverty level in 2022:
This zip code:
1.1%
Whole state:
10.6%
Residents with income below 50% of the poverty level in 2022:
This zip code:
0.3%
Whole state:
5.2%
Median number of rooms in houses and condos:
Here:
8.5
State:
7.0
Median number of rooms in apartments:
Here:
5.8
State:
4.3
Notable locations in this zip code not listed on our city pages
Notable locations in zip code 20105: Stone Ridge Village Center (A), Aldies Mill (B), Loudoun County Fire and Rescue Aldie Volunteer Fire Department Station 7 (C), Arcola Community Center (D). Display/hide their locations on the map
Churches in zip code 20105 include: Aldie United Methodist Church (A), Church of Our Redeemer (B), Little River Church (C), Mount Pleasant Church (D), Mount Zion Church (E). Display/hide their locations on the map
Cemeteries: Mount Zion Cemetery (1), Aldie Presbyterian Cemetery (2), Ish Family Cemetery (3), Mount Pleasant Cemetery (4). Display/hide their locations on the map
In group quarters: 13 (-1 institutionalized population)
Size of family households: 1,851 2-persons, 1,814 3-persons, 3,370 4-persons, 1,242 5-persons, 324 6-persons, 257 7-or-more-persons
Size of nonfamily households: 949 1-person, 422 2-persons, 30 3-persons
9,520 married couples with children.
1,051 single-parent households (245 men, 806 women).
63.1% of residents of 20105 zip code speak English at home.
5.2% of residents speak Spanish at home (69% very well, 15% well, 12% not well, 4% not at all).
15.9% of residents speak other Indo-European language at home (76% very well, 16% well, 7% not well, 1% not at all).
13.9% of residents speak Asian or Pacific Island language at home (71% very well, 21% well, 8% not well, 1% not at all).
1.9% of residents speak other language at home (69% very well, 16% well, 16% not well).
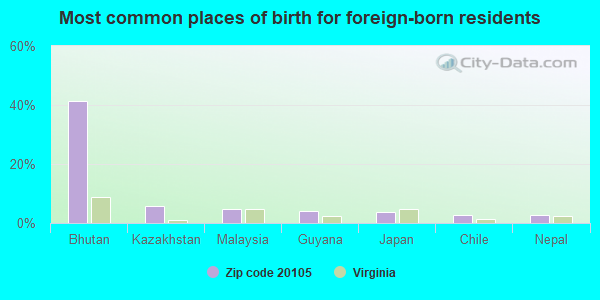
Foreign born population: 10,147 (29.7%) (69.2% of them are naturalized citizens)
This zip code:
29.7%
Whole state:
12.7%
41%Bhutan
6%Kazakhstan
5%Malaysia
4%Guyana
4%Japan
3%Chile
3%Nepal
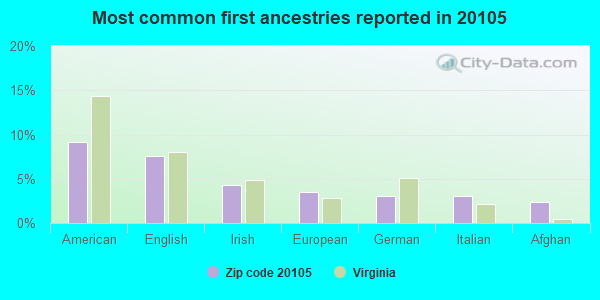
9%American
8%English
4%Irish
3%European
3%German
3%Italian
2%Afghan
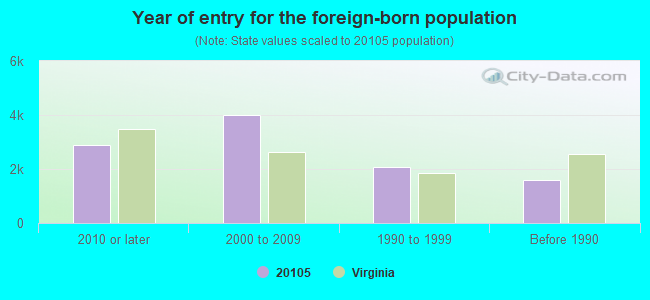
Year of entry for the foreign-born population
2,8712010 or later
4,0092000 to 2009
2,0641990 to 1999
1,596Before 1990
Public high school in in zip code 20105 not listed on the city page:
JOHN CHAMPE HS (Location: 41535 SACRED MOUNTAIN STREET, Grades: 9-12)
Public elementary/middle schools in in zip code 20105 not listed on the city page:
Facilities with environmental interests located in this zip code:
ALDIE ELEMENTARY SCHOOL (MEETING HOUSE LN in ALDIE, VA)
AIR MINOR (AIRS/AFS) STATE MASTER (Virginia pollutants databases) - CEDS-70049, AIR PROGRAM (Geographic Names Information System) (National Center for Education Statistics) - STATE ID-0530510 Business SIC and NAICS classification: ELEMENTARY AND SECONDARY SCHOOLS Organizations: LOUDOUN COUNTY PUBLIC SCHOOLS (SCHOOL DISTRICT)
Alternative names: ALDIE ELEM.
ALDIE WATER CO (39317 JOHN MOSBY HWY in ALDIE, VA)
(Integrated Compliance Information System) - ICIS-03-2001-0026, FORMAL ENFORCEMENT ACTION Business SIC classification: SEWERAGE SYSTEMS
CHESAPEAKE & POTOMAC TELEPHONE CO (RTE 771 in ALDIE, VA)
(Resource Conservation and Recovery Act (tracking hazardous waste)) Organizations: OPERNAME (CONTACT/OPERATOR)
, CHESAPEAKE & POTOMAC TELEPHONE COMPANY (CONTACT/OWNER)
ALDIE WASTEWATER TREATMENT PLA (39506 JOHN MOSBY HWY in ALDIE, VA)
National Pollutant Discharge Elimination System NON-MAJOR (Tracking pollutant discharge elimination systems) - permit Business SIC classification: SEWERAGE SYSTEMS Alternative names: ALDIE WASTEWATER TREAMENT PLAN, LOUDOUN CNTY. SANT. AUTH.
Housing units lacking complete plumbing facilities: 0.2% Housing units lacking complete kitchen facilities: 0.3%
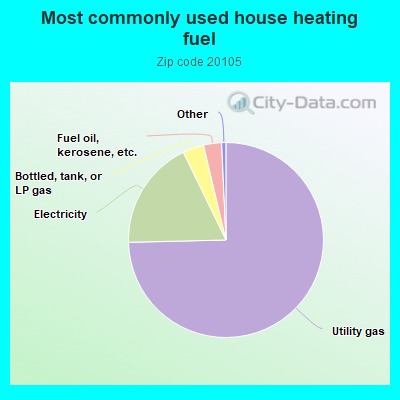
74.7%Utility gas
18.2%Electricity
3.5%Bottled, tank, or LP gas
3.0%Fuel oil, kerosene, etc.
Place of birth for U.S.-born residents:
This state: 10,956
Northeast: 4,352
Midwest: 1,530
South: 5,042
West: 1,826
73% of the 20105 zip code residents lived in the same house 5 years ago. Out of people who lived in different houses, 23% lived in this county. Out of people who lived in different counties, 50% lived in Virginia.
89% of the 20105 zip code residents lived in the same house 1 year ago. Out of people who lived in different houses, 51% moved from this county. Out of people who lived in different houses, 23% moved from different county within same state. Out of people who lived in different houses, 13% moved from different state. Out of people who lived in different houses, 11% moved from abroad.
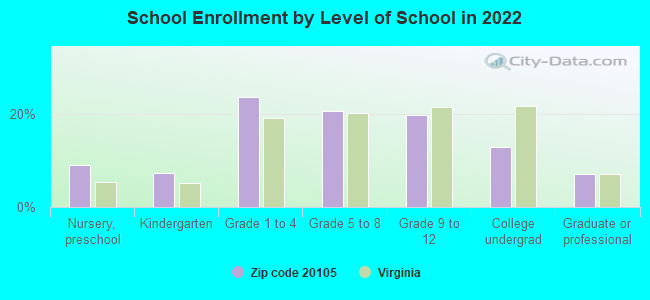
Private vs. public school enrollment:
Students in private schools in grades 1 to 8 (elementary and middle school): 594
Here:
11.9%
Virginia:
13.2%
Students in private schools in grades 9 to 12 (high school): 92
Here:
4.1%
Virginia:
10.2%
Students in private undergraduate colleges: 121
Here:
8.3%
Virginia:
18.7%
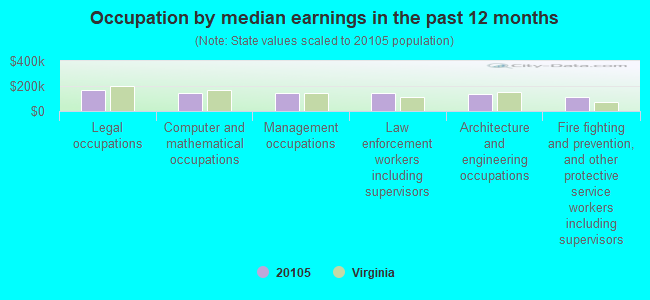
Occupation by median earnings in the past 12 months ($)
170,103Legal occupations
147,744Computer and mathematical occupations
142,540Management occupations
142,050Law enforcement workers including supervisors
137,803Architecture and engineering occupations
108,304Fire fighting and prevention, and other protective service workers including supervisors
Companies with federal contracts located in this zip code:
ELOGIC SOLUTIONS INC (42038 CHERISH CT in ALDIE, VA; small business) : $52,915 in 2 contractsin 2004
$99,750 with Navy for Programming Services. Signed on 2004-05-07. Completion date: 2004-12-31.
-$46,835 with Navy for ADP Facility Operation and Maintenance Services. Signed on 2004-09-21. Completion date: 2004-09-22.
TERRY RAUCH, PH.D (40702 LENAH RUN CIRCLE in AIDE, VA)
$39,300 with Offices, Boards and Divisions (includes Attorney General, Deputy Attorney General, etc.) for Expert Witness. Taking place in DC. Signed on 2005-08-30. Completion date: 2005-12-30.
AVISIAN, INC (40703 LENAH RUN CIRCLE in ALDIE, VA; small business)
$24,950 with Navy for Programming Services. Signed on 2005-01-04. Completion date: 2005-04-01.
Top industries in this zip code by the number of employees in 2005:
Administrative and Support and Waste Management and Remediation Services: Landscaping Services (20-49 employees: 2 establishments, 10-19 employees: 3 establishments, 5-9 employees: 2 establishments, 1-4 employees: 1 establishment)
Construction: Power and Communication Line and Related Structures Construction (50-99: 1)
Construction: Site Preparation Contractors (20-49: 1, 5-9: 1, 1-4: 3)
Detailed PMIC statistics for the following Tracts:6109.00
, 6118.00
2002 - 2018 National Fire Incident Reporting System (NFIRS) incidents
Based on the data from the years 2002 - 2018 the average number of fire incidents per year is 33. The highest number of fires - 50 took place in 2006, and the least - 12 in 2002. The data has an increasing trend.
When looking into fire subcategories, the most incidents belonged to: Structure Fires (43.8%), and Outside Fires (39.9%).
Fire incident types reported to NFIRS in Zip Code 20105


 Nearest zip codes: 20169, 20148, 20143, 20152, 20175, 20118.


 (Location: 41535 SACRED MOUNTAIN STREET, Grades: 9-12)


 Based on the data from the years 2002 - 2018 the average number of fire incidents per year is 33. The highest number of fires - 50 took place in 2006, and the least - 12 in 2002. The data has an increasing trend.
 When looking into fire subcategories, the most incidents belonged to: Structure Fires (43.8%), and Outside Fires (39.9%).